. 2019 May;56(5):283-292.
doi: 10.1136/jmedgenet-2018-105703. Epub 2018 Dec 27.

Integrative network and brain expression analysis reveals mechanistic modules in ataxia

Affiliations

Integrative network and brain expression analysis reveals mechanistic modules in ataxia

Ilse Eidhof et al. J Med Genet. 2019 May.

Abstract

Background: Genetic forms of ataxia are a heterogenous group of degenerative diseases of the cerebellum. Many causative genes have been identified. We aimed to systematically investigate these genes to better understand ataxia pathophysiology.

Methods: A manually curated catalogue of 71 genes involved in disorders with progressive ataxias as a major clinical feature was subjected to an integrated gene ontology, protein network and brain gene expression profiling analysis.

Results: We found that genes mutated in ataxias operate in networks with significantly enriched protein connectivity, demonstrating coherence on a global level, independent of inheritance mode. Moreover, elevated expression specifically in the cerebellum predisposes to ataxia. Genes expressed in this pattern are significantly over-represented among genes mutated in ataxia and are enriched for ion homeostasis/synaptic functions. The majority of genes mutated in ataxia, however, does not show elevated cerebellar expression that could account for region-specific degeneration. For these, we identified defective cellular stress responses as a major common biological theme, suggesting that the defence pathways against stress are more critical to maintain cerebellar integrity than integrity of other brain regions. Approximately half of the genes mutated in ataxia, mostly part of the stress module, show higher expression at embryonic stages, which argues for a developmental predisposition.

Conclusion: Genetic defects in ataxia predominantly affect neuronal homeostasis, to which the cerebellum appears to be excessively susceptible. Based on the identified modules, it is conceivable to propose common therapeutic interventions that target deregulated calcium and reactive oxygen species levels, or mechanisms that can decrease the harmful downstream effects of these deleterious insults.

Keywords: molecular genetics; movement disorders (other than parkinsons); neurology.


Conflict of interest statement

Competing interests: None declared.

Figures
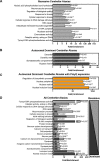
Figure 1
Figure 1
Cerebellar ataxia genes function in common biological processes. Gene ontology (GO) terms significantly enriched among (A) recessive ataxia genes, (B) dominant ataxia genes, (C) dominant ataxia genes with polyglutamine (polyQ) expansion, (D) all ataxia genes (all GO terms passed Bonferroni correction for multiple testing, p<0.05).
Figure 2
Figure 2
Cerebellar ataxia proteins show high connectivity on protein level and function in common processes. (A) Interaction network of ataxia proteins (black solid lines: direct protein interaction, grey solid lines: proteins with similar domains, dotted lines: interaction of protein with gene ontology (GO) term). (B) Physical interaction enrichment (PIE) score of all, recessive (R), dominant (D) and polyglutamine (PQ) ataxia proteins. *P<0.05, **p<0.01, ***p<0.001, based on 10 000 random repetitions.
Figure 3
Figure 3
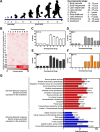
Cerebellar ataxia gene expression is enriched in the postnatal cerebellum. (A) Nine developmental stages were used for analysis of developmental human BrainSpan expression data. (B) Heatmap displaying % of ataxia genes differentially expressed in the cerebellum compared with indicated amount (Y-axis) of other non-cerebellar brain regions (a single up to 15) for developmental stages 1–9. (C–F) Percent of ataxia genes that show significant enriched expression in the cerebellum compared with 15 other brain regions for described developmental stages ((C) all ataxia genes, (D) recessive ataxia genes, (E) dominant ataxia genes, (F) dominant ataxia genes with polyglutamine (PQ) expansion, *p<0.05, **p<0.01, ***p<0.001. (G) Significantly enriched gene ontology (GO) terms for ataxia genes elevated in the cerebellum (red) and ataxia genes not elevated in the cerebellum (blue).
Figure 4
Figure 4
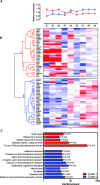
Ataxia genes can be separated in two distinct clusters based on their temporal expression levels in the cerebellum. (A) Average reads per kilobase per million mapped reads (RPKM) value for ataxia genes present in cluster 1 and cluster 2 of figure 4B, for the indicated developmental stages. (red: cluster 1, blue: cluster 2, error bars represent SD). (B) Hierarchical clustering of ataxia gene expression levels during cerebellar development using Spearman’s correlation. Data were obtained from BrainSpan and mean RPKM values were calculated for the indicated developmental stages. Heatmap colour codes are based on median RPKM value per row (developmental stage), divided by the row standard deviation (blue: low expression in cerebellum compared with median, red: high expression in cerebellum compared with median). (C) Significantly enriched gene ontology (GO) terms for cluster 1 and cluster 2 from figure 4B (all GO terms passed Bonferroni correction for multiple testing, p<0.05).
Figure 5
Figure 5
Ataxia genes can broadly be divided in two themes that affect neuronal homeostasis and when disrupted predispose to progressive cerebellar ataxia. Module 1: 13 genes are specifically elevated in the cerebellum during one or more developmental stages. Of these 13 genes, 7 are linked to Ion/Synapse function and 5 out of these 7 genes showed increased expression during postnatal cerebellar development compared with prenatal cerebellar development. Module 2: 55 genes do not show increased expression in the cerebellum. Of these 55 genes, 23 genes are linked to cellular response to stress and 12 out of these 23 genes show increased expression during prenatal cerebellar development compared with postnatal cerebellar development (data displayed in figures 2–4).

References

    1. Jayadev S, Bird TD. Hereditary ataxias: overview. Genet Med 2013;15:673–83. 10.1038/gim.2013.28 - DOI - PubMed
    1. Didonna A, Opal P. Advances in sequencing technologies for understanding hereditary ataxias: a review. JAMA Neurol 2016;73:1485–90. 10.1001/jamaneurol.2016.3097 - DOI - PMC - PubMed
    1. Lim J, Hao T, Shaw C, Patel AJ, Szabó G, Rual JF, Fisk CJ, Li N, Smolyar A, Hill DE, Barabási AL, Vidal M, Zoghbi HY. A protein-protein interaction network for human inherited ataxias and disorders of Purkinje cell degeneration. Cell 2006;125:801–14. 10.1016/j.cell.2006.03.032 - DOI - PubMed
    1. Bettencourt C, Ryten M, Forabosco P, Schorge S, Hersheson J, Hardy J, Houlden H. United Kingdom Brain Expression C. Insights from cerebellar transcriptomic analysis into the pathogenesis of ataxia. JAMA Neurol 2014;71:831–9. - PMC - PubMed
    1. Smeets CJ, Verbeek DS. Cerebellar ataxia and functional genomics: identifying the routes to cerebellar neurodegeneration. Biochim Biophys Acta 2014;1842:2030–8. 10.1016/j.bbadis.2014.04.004 - DOI - PubMed

Publication types

MeSH terms