. 2019 Mar 7;133(10):1119-1129.
doi: 10.1182/blood-2018-08-862292. Epub 2018 Dec 27.

Single-cell RNA-Seq of follicular lymphoma reveals malignant B-cell types and coexpression of T-cell immune checkpoints

Affiliations

Single-cell RNA-Seq of follicular lymphoma reveals malignant B-cell types and coexpression of T-cell immune checkpoints

Noemi Andor et al. Blood. .

Abstract

Follicular lymphoma (FL) is a low-grade B-cell malignancy that transforms into a highly aggressive and lethal disease at a rate of 2% per year. Perfect isolation of the malignant B-cell population from a surgical biopsy is a significant challenge, masking important FL biology, such as immune checkpoint coexpression patterns. To resolve the underlying transcriptional networks of follicular B-cell lymphomas, we analyzed the transcriptomes of 34 188 cells derived from 6 primary FL tumors. For each tumor, we identified normal immune subpopulations and malignant B cells, based on gene expression. We used multicolor flow cytometry analysis of the same tumors to confirm our assignments of cellular lineages and validate our predictions of expressed proteins. Comparison of gene expression between matched malignant and normal B cells from the same patient revealed tumor-specific features. Malignant B cells exhibited restricted immunoglobulin (Ig) light chain expression (either Igκ or Igλ), as well the expected upregulation of the BCL2 gene, but also downregulation of the FCER2, CD52, and major histocompatibility complex class II genes. By analyzing thousands of individual cells per patient tumor, we identified the mosaic of malignant B-cell subclones that coexist within a FL and examined the characteristics of tumor-infiltrating T cells. We identified genes coexpressed with immune checkpoint molecules, such as CEBPA and B2M in regulatory T (Treg) cells, providing a better understanding of the gene networks involved in immune regulation. In summary, parallel measurement of single-cell expression in thousands of tumor cells and tumor-infiltrating lymphocytes can be used to obtain a systems-level view of the tumor microenvironment and identify new avenues for therapeutic development.


Conflict of interest statement

Conflict-of-interest disclosure: G.X.Y.Z. is an employee of 10X Genomics. The remaining authors declare no competing financial interests.

Figures
None
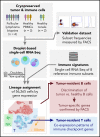
Graphical abstract
Figure 1.
Figure 1.
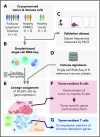
Single-cell RNA-Seq analysis and validation strategy. (A-B) Cryopreserved cells from dissociated FL tumor biopsies from 6 patients, 3 PBMC donors, and 2 healthy tonsil donors (A), were measured by droplet-based scRNA-Seq, capturing an average of 1951 to 8560 cells per sample (B). Low-quality cells and technical artifacts were identified algorithmically and discarded. (C) A portion of the same aliquots of each sample was measured by multicolor flow cytometry (FACS) to validate immune and tumor subset frequencies observed by scRNA-Seq. (D-E) Published immune signatures for 8 purified immune subsets (D) were used to assign lineages (E) to each cell based on gene expression. (F) Tumor-infiltrating normal and tumor-derived B cells had distinct gene expression profiles. Tumor-specific candidate genes were characterized by FACS on additional cryopreserved aliquots of the tumor biopsies, yielding tumor-specific expression at the protein level. (G) The scRNA-Seq data of tumor-infiltrating T cells revealed the landscape of immune checkpoint gene coexpression.
Figure 2.
Figure 2.
Integrating scRNA-Seq data derived from heterogeneous biopsies and purified immune populations enables assignment of hematopoietic lineage to each cell. (A) tSNE mapping of 8129 cells from a follicular lymphoma sample (LPJ128, gray dots) and of 2962 purified cells from 8 BEIL populations (colored dots). (B) RNA-Seq based assignment of all 11 091 cells to a hematopoietic lineage. Every single cell was compared with every BEIL representative. (C) Among the gray LPJ128 cells from panel (A), expression of an 18-gene signature of cell cycle progression is shown (colorbar legend) and was highest among B cells and Tregs. The scale shows the GSVA enrichment score per cell. (D-E) Overall cell type frequencies are quantified for the sample above, along with 5 additional follicular lymphoma samples. Sequencing-based (left) and FACS-based (right) cell type frequencies are shown in pairs for each specimen (D) and cell type (E). **Spearman r ≥ 0.95: *r ≥ 0.9.
Figure 3.
Figure 3.
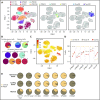
B cell scRNA-Seq transcriptional profiles segregate into normal and malignant phenotypes. (A) TSNE analysis of 25 106 B cells across 11 samples reveals sample-specific and shared clusters of B cells in FLs (left), PBMCs (middle), and tonsils (right). Single cells are colored according to sample origin. Shared nearest-neighbor clustering of B cells in PC space identifies 10 clusters. Normal B cells (cluster 4 and 5) were abundant in the 5 control samples and detectable in all tumor samples. Each cluster is enclosed by kernel density estimates of the coordinates of its cell members (black polygons and adjacent numbers). (B) Cluster membership and sample origin of single cells point to 3 distinct cluster phenotypes: normal, cycling and quiescent. (C) Expression of 598 genes involved in cell cycle progression (Reactome-term “Cell cycle”) was highest in cluster 9. The scale shows the GSVA enrichment score per cell. (D) Fraction of B-cell subsets (λ+/ κ +/ cycling), as estimated by scRNA-Seq (left) and flow cytometry (right). (E) Light chain restriction of “tumor” cluster groups in each sample show minimal contribution of nontumor cells, while the “normal” cluster group is heterogeneous.
Figure 4.
Figure 4.
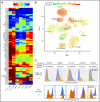
Differential expression analysis reveals gene transcripts recurrently enriched in either malignant or normal B cells from the same biopsy. (A) Genes with strong and recurrent patterns of enrichment are at the top and bottom of the heat map. The heat map is restricted to genes differentially expressed at ≥ 60% AUC power. (B) Overlay of class II MHC gene expression (HLA-DR) on the tSNE map shows strong differences between normal and malignant B cells for all samples, albeit in variable directions. (C) Tumor-specific expression of HLA-DR predicted from scRNA-Seq data (top) was confirmed by flow cytometry (bottom).
Figure 5.
Figure 5.
Multiple subclones coexist within FL tumor populations. (A) Malignant B cells in LPM011 segregate into 5 subclones (shown in tSNE space). (B) Relative proportions of tumor subclones is shown for LPM011 along with the 5 other FLs. Largest subclone dominates more than 50% of the tumor population in each analyzed FL. (C) ScRNA-Seq data recapitulates exome-Seq data: genes differentially expressed in largest subclone of each sample (clone 0) harbor somatic mutations with higher allele frequencies compared with the other genes. For each subclone and FL, the top 1 most differentially expressed, mutated gene was included in this comparison. (D) 21 canonical pathways had a strong differential activity across the subclones of at least 1 FL (analysis of variance: P < 1E-16). In 5 of 6 FLs, these pathways distinguish 1 or 2 smaller outlier subclones (red edges in dendrograms), with activity patterns diverging strongly from the corresponding sample’s other subclones, including the largest 1 (clone 0).
Figure 6.
Figure 6.
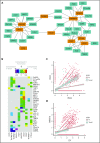
Immune checkpoint regulation network in tumor-resident and healthy CD4 Tregs. (A) Network of 10 known immune checkpoint genes (orange) and 31 coexpressed candidate genes (dark green). Edge width reflects average correlation coefficient of a given gene pair across 6 FL and 2 tonsil control specimens. (B) Heat map representation of the network shown in (A). Entries represent the average correlation coefficient across the 2 tonsil specimens subtracted from the average correlation measured across the 6 FL specimens. Entries close to zero indicate that the magnitude of coexpression is similar between FL and control specimens, whereas negative and positive entries indicate overrepresentation of the corresponding coexpressed pair in tonsil and FL specimens respectively. (C-D) Two examples are shown in this context: CEBPA is coexpressed with PDCD1 in tonsils but not in FL (C), whereas CD7 is coexpressed with TNFRSF18 in both FL and tonsils (D). (Network in panel A was visualized with Cytoscape. For panels C-D, least squares regression [line] is fitted on normalized and scaled unique molecule identifier counts for each gene pair [dots] and shown along with the standard error bounds.)

References

    1. Green MR, Gentles AJ, Nair RV, et al. . Hierarchy in somatic mutations arising during genomic evolution and progression of follicular lymphoma. Blood. 2013;121(9):1604-1611. - PMC - PubMed
    1. Pasqualucci L, Khiabanian H, Fangazio M, et al. . Genetics of follicular lymphoma transformation. Cell Reports. 2014;6(1):130-140. - PMC - PubMed
    1. Casulo C, Burack WR, Friedberg JW. Transformed follicular non-Hodgkin lymphoma. Blood. 2015;125(1):40-47. - PubMed
    1. Okosun J, Bödör C, Wang J, et al. . Integrated genomic analysis identifies recurrent mutations and evolution patterns driving the initiation and progression of follicular lymphoma. Nat Genet. 2014;46(2):176-181. - PMC - PubMed
    1. Zheng GX, Terry JM, Belgrader P, et al. . Massively parallel digital transcriptional profiling of single cells. Nat Commun. 2017;8:14049. - PMC - PubMed

Publication types

MeSH terms