. 2019 Mar 1;294(9):2997-3011.
doi: 10.1074/jbc.RA118.005524. Epub 2018 Dec 27.

Biosynthesis of O-N-acetylgalactosamine glycans in the human cell nucleus

Affiliations

Biosynthesis of O-N-acetylgalactosamine glycans in the human cell nucleus

Romina B Cejas et al. J Biol Chem. .

Erratum in

Abstract

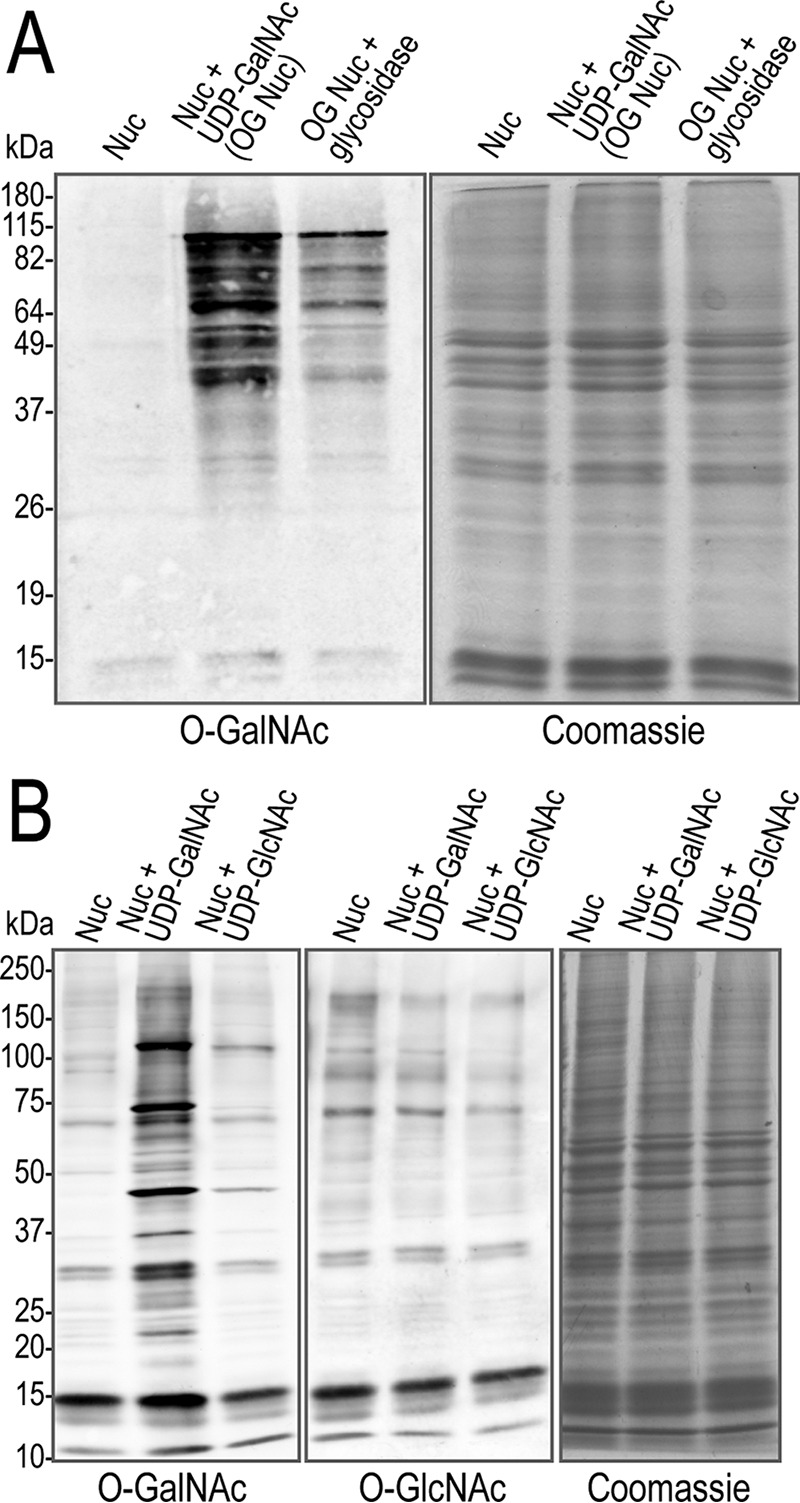
Biological functions of nuclear proteins are regulated by post-translational modifications (PTMs) that modulate gene expression and cellular physiology. However, the role of O-linked glycosylation (O-GalNAc) as a PTM of nuclear proteins in the human cell has not been previously reported. Here, we examined in detail the initiation of O-GalNAc glycan biosynthesis, representing a novel PTM of nuclear proteins in the nucleus of human cells, with an emphasis on HeLa cells. Using soluble nuclear fractions from purified nuclei, enzymatic assays, fluorescence microscopy, affinity chromatography, MS, and FRET analyses, we identified all factors required for biosynthesis of O-GalNAc glycans in nuclei: the donor substrate (UDP-GalNAc), nuclear polypeptide GalNAc -transferase activity, and a GalNAc transferase (polypeptide GalNAc-T3). Moreover, we identified O-GalNAc glycosylated proteins in the nucleus and present solid evidence for O-GalNAc glycan synthesis in this organelle. The demonstration of O-GalNAc glycosylation of nuclear proteins in mammalian cells reported here has important implications for cell and chemical biology.

Keywords: O-GalNAc glycans; biosynthesis; enzyme catalysis; epigenetics; glycobiology; glycoconjugate; glycoprotein biosynthesis; glycosylation; nucleus; polypeptide N-acetylgalactosaminyltransferase 3; post-translational modification; proteins; substrate specificity.


Conflict of interest statement

The authors declare that they have no conflicts of interest with the contents of this article

Figures

Figure 1.
Figure 1.
Purification of HeLa cell nuclei. A, whole cells (WC) and purified nuclei (Nuc) were analyzed by confocal fluorescence microscopy to assess nuclear purity following subcellular fractionation. Nuclei, Golgi, and ER were identified, respectively, by staining with PI (red), anti-Golgin 97 antibody (green), and anti-calreticulin (CR) antibody. B, whole cells, cytoplasm (Cyt), nuclei, and nucleoplasm (NP) samples were analyzed by WB, using anti-Golgin 97 (Golgi), anti-CR (ER), and anti-tubulin (cytosol) antibodies as cytoplasm markers, and anti-histone H3 (H3) antibody as nuclear marker.
Figure 2.
Figure 2.
α-Linked GalNAc glycosylation of nuclear proteins in HeLa cells. A, purified nuclei (Nuc), over-glycosylated nuclei obtained by preincubation of purified nuclei with 250 μm UDP-GalNAc (OG Nuc), and OG nuclei treated with αGalNAc glycosidase (OG Nuc + glycosidase) were analyzed by SDS-PAGE (15% acrylamide) using biotin–HPA for O-GalNAc residue detection on proteins by WB. OG nuclei incubated without αGalNAc glycosidase showed identical O-GalNAc profile to UDP-GalNAc line (data not shown). Loading controls (right): identical running gels stained with CBB. B, purified nuclei (Nuc), over-glycosylated nuclei obtained by incubation of purified nuclei with 250 μm UDP-GalNAc (Nuc + UDP-GalNAc), and purified nuclei incubated with 250 μm UDP-GlcNAc (Nuc + UDP-GlcNAc) were analyzed by SDS-PAGE (4–20% acrylamide gradient) and detected with biotin–VVL for O-GalNAc glycan detection (left) or with biotin–WGA for O-GlcNAc glycan detection by WB (middle). Loading controls as in A.
Figure 3.
Figure 3.
Biosynthesis of O-GalNAc glycans in HeLa cell nucleus. A, representative images from confocal fluorescence microscopy of purified nuclei (Nuc, top) and OG nuclei incubated with UDP-GalNAc (OG Nuc, bottom). O-GalNAc residues on proteins were detected with Alexa 488–streptavidin/biotin–VVL (green), and nuclei were stained with PI (red). Images of the nuclear plane are shown as individual channels and merge mode. Square, zoomed nuclear region, also shown in x, y and x, z orthogonal views, show detailed distribution of O-GalNAc glycans in the nucleus. Scale bar, 1 μm. B, representative confocal images (inverted gray pseudocolored) showing O-GalNAc glycosylation level (detected with Alexa 488–streptavidin/biotin–VVL) (top) in purified nuclei (Nuc) and purified OG nuclei (OG Nuc). Controls: Alexa 488–streptavidin without biotin–VVL. Nuclei were stained with PI (bottom). Scale bar, 1 μm. C, quantitative analysis of O-GalNAc glycosylation level under conditions as in B. Fluorescence of channel 1 (Alexa 488) (AU, arbitrary units) per nucleus was measured in 60 nuclei. Lines, mean arbitrary units. Means compared by unpaired t test indicate significant difference; *** (p < 0.001). See also Fig. S2.
Figure 4.
Figure 4.
Nuclear O-GalNAc glycosylation in CHO ldlD cells. A, representative images from confocal fluorescence microscopy of CHO ldlD cells grown in media without GalNAc (−GalNAc; top) or supplemented with GalNAc (+GalNAc; bottom). O-GalNAc residues on proteins were detected with Alexa 488–streptavidin/biotin–VVL (green) and nuclei stained with DAPI (blue). Images are shown as individual channels and merge mode. Scale bar, 10 μm. B, quantitative analysis of nuclear O-GalNAc glycosylation level under conditions as in A. Mean fluorescence in nuclear region per cell was measured in −GalNAc or +GalNAc growing conditions. Values are expressed as relative to the lower average fluorescence value. Lines, mean ± S.D. (n = 56–60 cells). Means compared by unpaired t test indicate significant difference; *** (p < 0.001). C, confocal Z-stack images of a representative CHO ldlD cell grown in media with GalNAc. Axial views (x, z) (bottom panel) along the yellow line displayed in the upper panel allows us to appreciate the distribution of O-GalNAc terminals (green) outside and inside of the nucleus (blue). Images are shown as individual channels and merge mode. Scale bar, 1 μm.
Figure 5.
Figure 5.
Localization of ppGalNAc-T3 (T3) in the nucleus of HeLa cells. A, representative images from confocal fluorescence microscopy of whole cells (WC; top) and purified nuclei (Nuc; bottom) showing T3 stained with anti-T3 antibody (green) and nuclei stained with PI (red). Scale bar, 10 μm. B, maximum intensity projection and corresponding axial views (x, z) of confocal Z-stack images of whole cells and purified nucleus with notations as in A. Images are shown as individual channels and merge mode. Scale bar, 1 μm.
Figure 6.
Figure 6.
Correlation study of LMNB1 and O-GalNAc glycosylation in HeLa cells. A, purified nuclei (Nuc) preincubated without or with UDP-GalNAc (OG Nuc) of cells expressing Cherry–LMNB1 (red) were fixed and stained with VVL for detection of O-GalNAc residues (green) and correlation analysis of O-GalNAc glycosylation (1st channel) and LMNB1 (2nd channel). Top panels, representative confocal fluorescence images of nuclei and OG nuclei as separated channels and merge mode. Yellow color, overlap of signals. Scale bar, 10 μm. Middle panel, fluorescence profiles of the two channels along the white line shown in the merge images. Stronger correlation is seen for OG nuclei between O-GalNAc glycosylation (green line) and LMNB1 (red line). Bottom panel, corresponding fluorograms between 1st and 2nd channels for nuclei and OG nuclei. B, quantification of Pearson's correlation coefficient between O-GalNAc glycosylation (detected with VVL) and Cherry–LMNB1 in nuclei and OG nuclei. C, quantification of Pearson's correlation coefficient between WGA (which detects O-GlcNAc termini; control) and LMNB1 in nuclei and OG nuclei. Data shown are mean Pearson's correlation coefficient ± S.E. (n = 5). Means compared by Mann-Whitney test indicate significant difference; * (p < 0.05) or ns (not significant).
Figure 7.
Figure 7.
O-GalNAc glycosylation of lamin-B1 (LMNB1) in nuclei of HeLa cells. A and B, nuclear O-GalNAc glycosylation of LMNB1 was analyzed by acceptor photobleaching FRET in purified nuclei expressing Cherry–LMNB1, preincubated without (Nuc) or with UDP-GalNAc (OG Nuc). O-Glycosylation was detected with Alexa 488–streptavidin/biotin–VVL (αGalNAc residues) or Alexa 488–streptavidin/biotin–WGA (βGlcNAc residues, control). A, representative images of VVL (O-GalNAc glycosylation) and LMNB1 (top) or WGA (control) and LMNB1 (bottom) FRET index map in purified nuclei and OG nuclei. Color-code bar indicates FRET index (0 to 1) for each pixel. For OG nuclei, FRET is between VVL and LMNB1, indicating that LMNB1 is O-GalNAc–glycosylated in the nucleus. Scale bar, 1 μm. C and D, statistical analysis of FRET index of LMNB1 and VVL (O-GalNAc terminals) (C), and LMNB1 and WGA (D), in purified nuclei preincubated without (Nuc) or with UDP-GalNAc (OG Nuc). Data shown are mean FRET index ± S.E. (n = 5). Means compared by Mann-Whitney test indicate significant difference; ** (p < 0.01) or ns (not significant).

References

    1. Skalska L., Beltran-Nebot M., Ule J., and Jenner R. G. (2017) Regulatory feedback from nascent RNA to chromatin and transcription. Nat. Rev. Mol. Cell Biol. 18, 331–337 10.1038/nrm.2017.12 - DOI - PubMed
    1. Drickamer K., and Taylor M. E. (2015) Recent insights into structures and functions of C-type lectins in the immune system. Curr. Opin. Struct. Biol. 34, 26–34 10.1016/j.sbi.2015.06.003 - DOI - PMC - PubMed
    1. Lloyd J. T., and Glass K. C. (2018) Biological function and histone recognition of family IV bromodomain-containing proteins. J. Cell. Physiol. 233, 1877–1886 10.1002/jcp.26010 - DOI - PMC - PubMed
    1. Hart G. W., Housley M. P., and Slawson C. (2007) Cycling of O-linked β-N-acetylglucosamine on nucleocytoplasmic proteins. Nature 446, 1017–1022 10.1038/nature05815 - DOI - PubMed
    1. Love D. C., Kochan J., Cathey R. L., Shin S. H., Hanover J. A., and Kochran J. (2003) Mitochondrial and nucleocytoplasmic targeting of O-linked GlcNAc transferase. J. Cell Sci. 116, 647–654 10.1242/jcs.00246 - DOI - PubMed

Publication types

MeSH terms