. 2019 Feb 22;294(8):2839-2853.
doi: 10.1074/jbc.RA118.006670. Epub 2018 Dec 27.

Low metformin causes a more oxidized mitochondrial NADH/NAD redox state in hepatocytes and inhibits gluconeogenesis by a redox-independent mechanism

Affiliations

Low metformin causes a more oxidized mitochondrial NADH/NAD redox state in hepatocytes and inhibits gluconeogenesis by a redox-independent mechanism

Ahmed Alshawi et al. J Biol Chem. .

Abstract

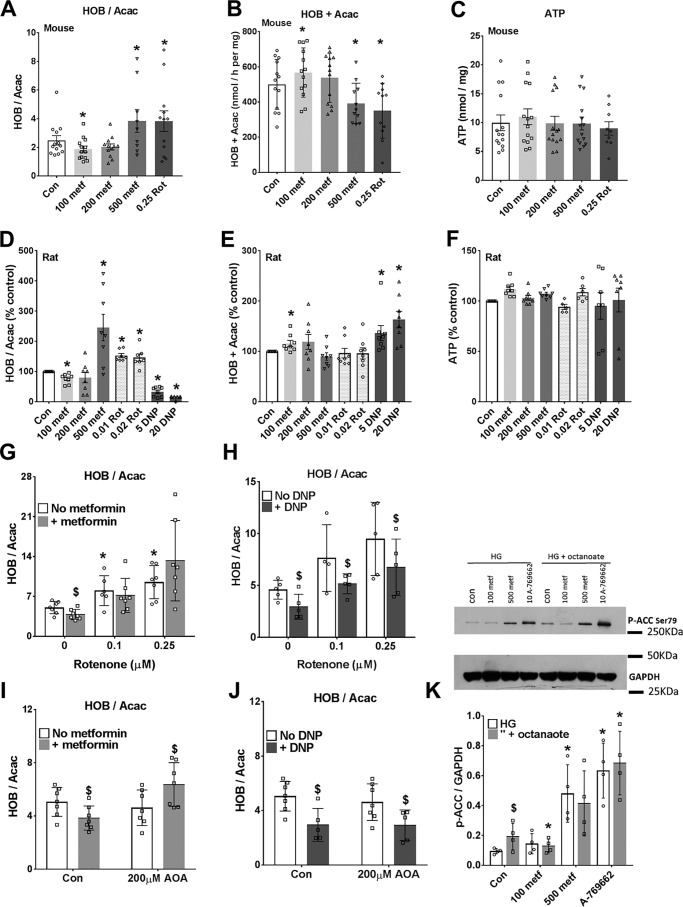
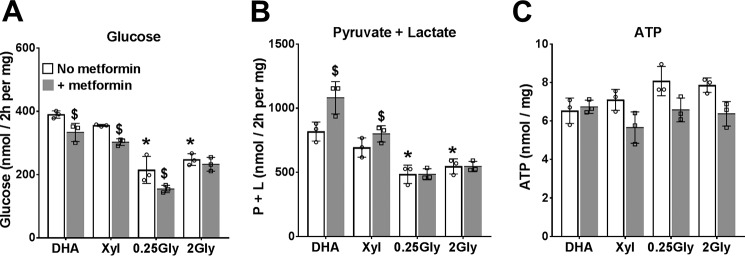
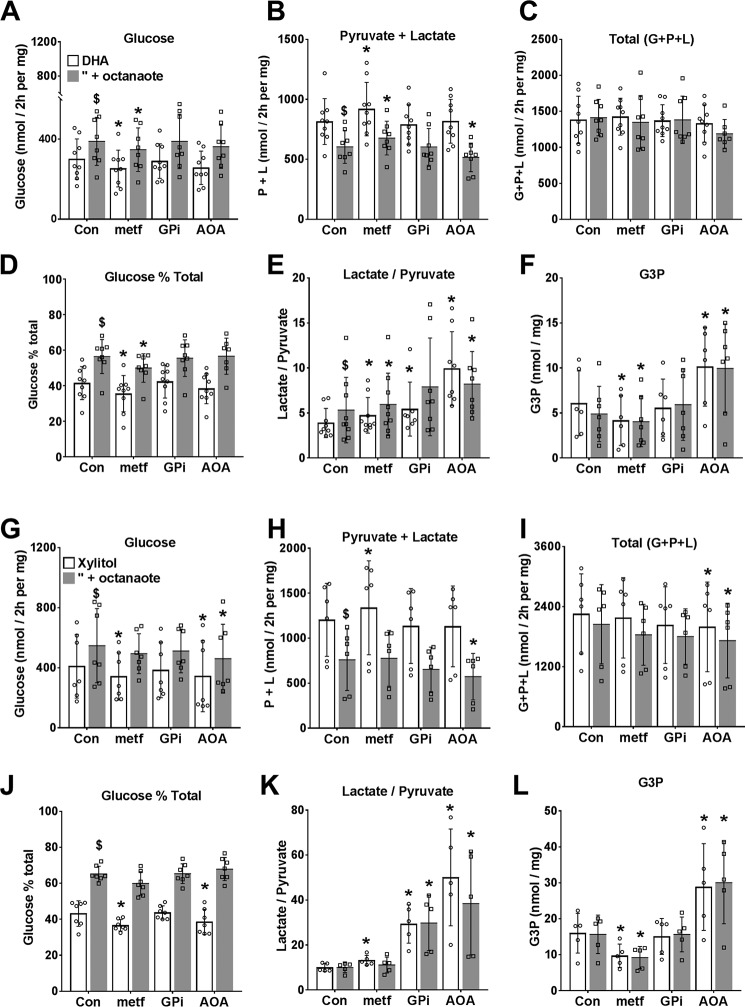
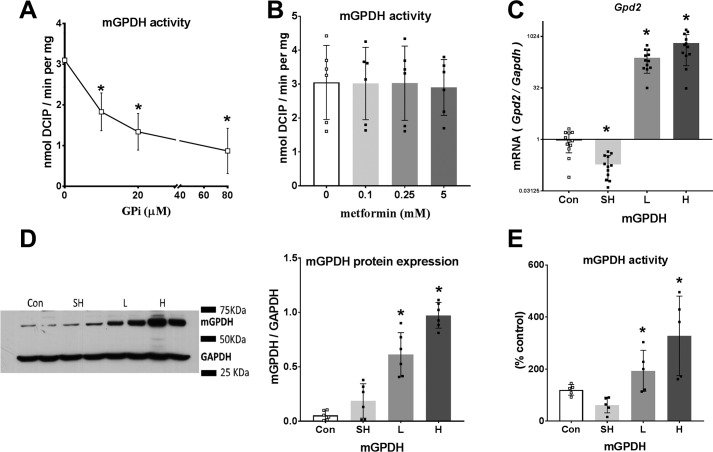
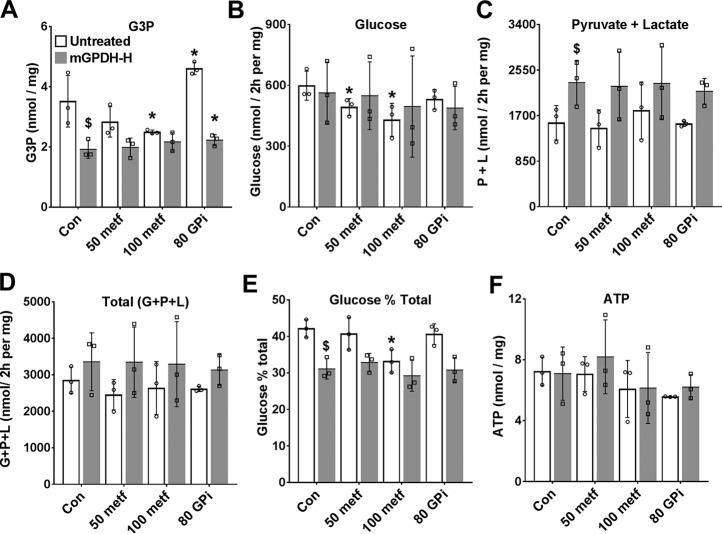
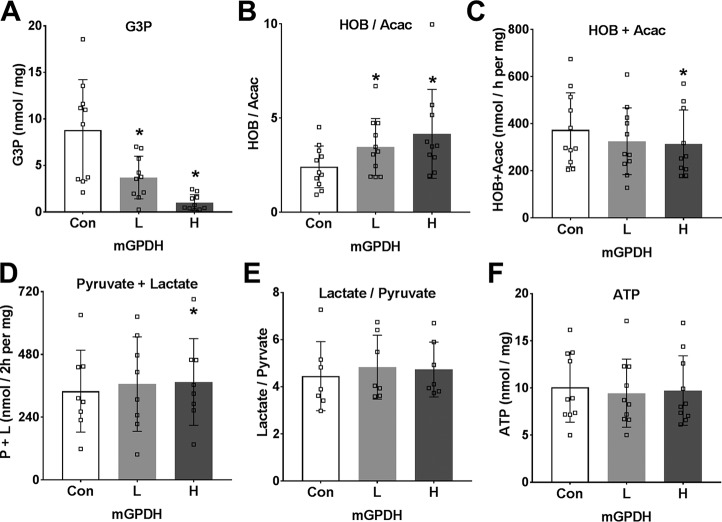
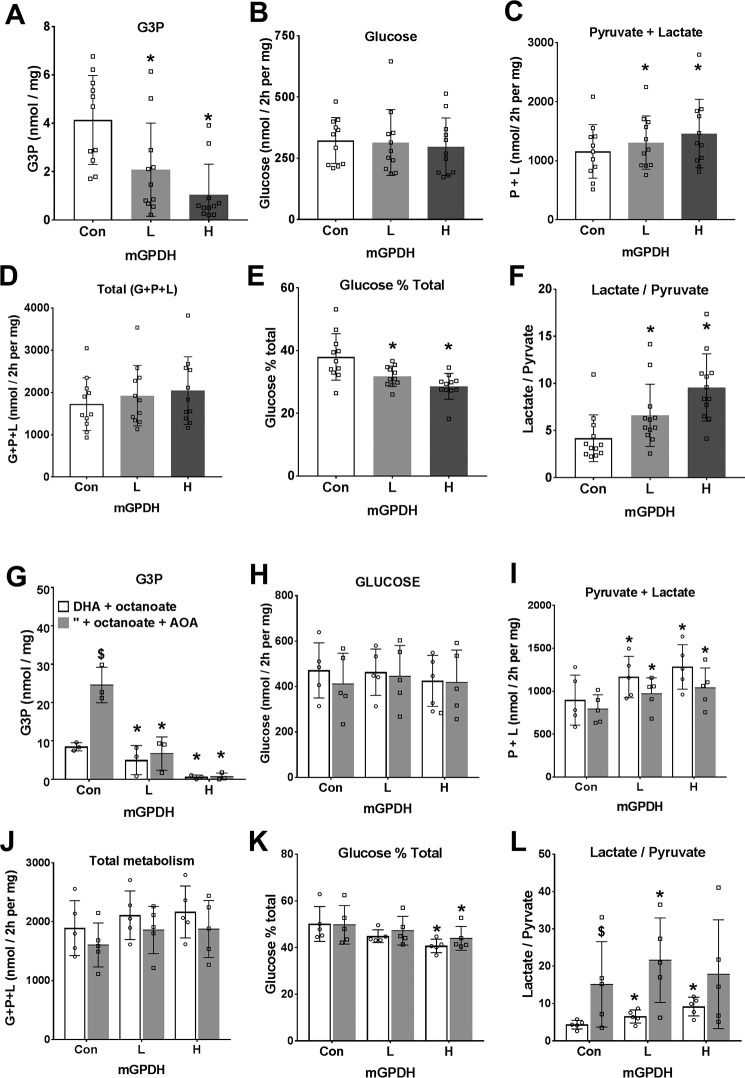
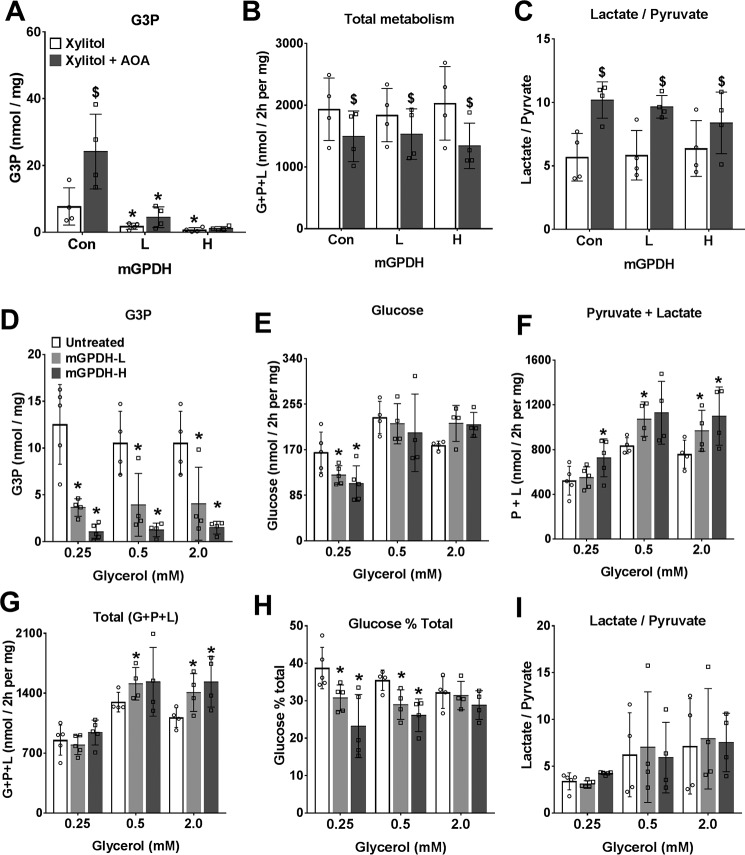
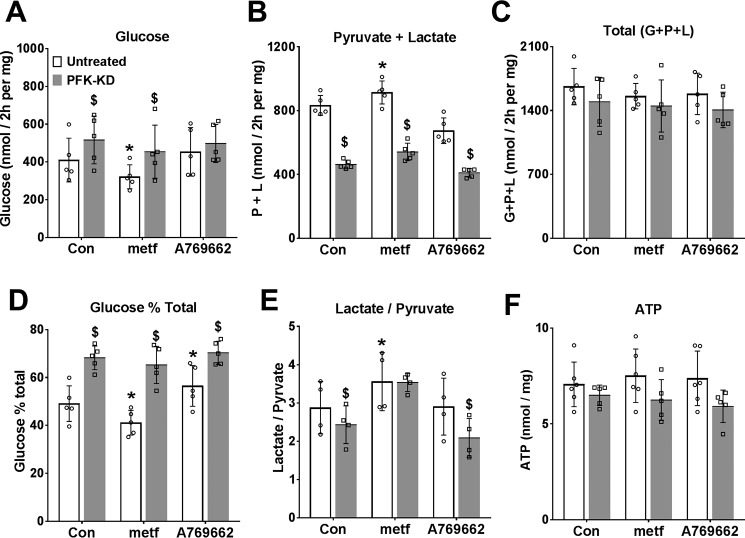
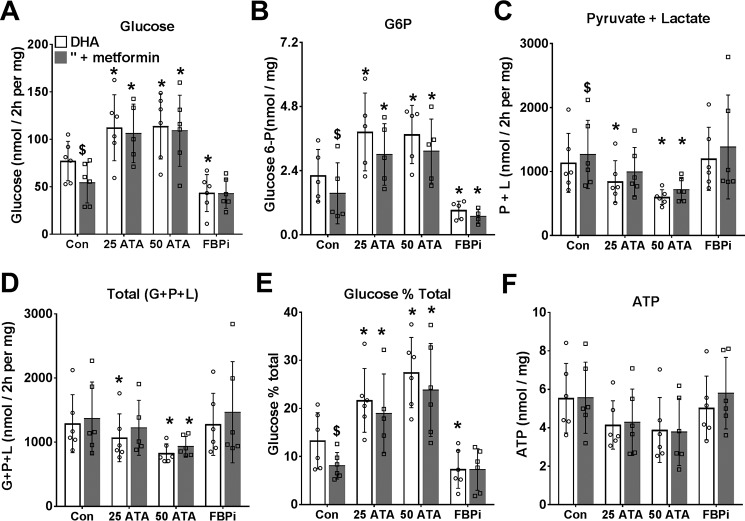
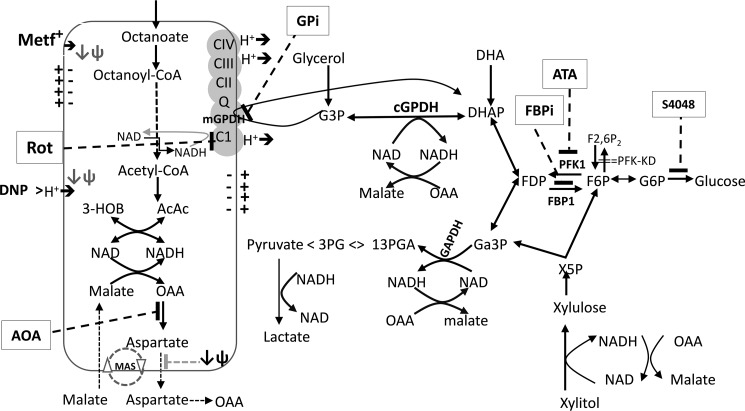
The mechanisms by which metformin (dimethylbiguanide) inhibits hepatic gluconeogenesis at concentrations relevant for type 2 diabetes therapy remain debated. Two proposed mechanisms are 1) inhibition of mitochondrial Complex 1 with consequent compromised ATP and AMP homeostasis or 2) inhibition of mitochondrial glycerophosphate dehydrogenase (mGPDH) and thereby attenuated transfer of reducing equivalents from the cytoplasm to mitochondria, resulting in a raised lactate/pyruvate ratio and redox-dependent inhibition of gluconeogenesis from reduced but not oxidized substrates. Here, we show that metformin has a biphasic effect on the mitochondrial NADH/NAD redox state in mouse hepatocytes. A low cell dose of metformin (therapeutic equivalent: <2 nmol/mg) caused a more oxidized mitochondrial NADH/NAD state and an increase in lactate/pyruvate ratio, whereas a higher metformin dose (≥5 nmol/mg) caused a more reduced mitochondrial NADH/NAD state similar to Complex 1 inhibition by rotenone. The low metformin dose inhibited gluconeogenesis from both oxidized (dihydroxyacetone) and reduced (xylitol) substrates by preferential partitioning of substrate toward glycolysis by a redox-independent mechanism that is best explained by allosteric regulation at phosphofructokinase-1 (PFK1) and/or fructose 1,6-bisphosphatase (FBP1) in association with a decrease in cell glycerol 3-phosphate, an inhibitor of PFK1, rather than by inhibition of transfer of reducing equivalents. We conclude that at a low pharmacological load, the metformin effects on the lactate/pyruvate ratio and glucose production are explained by attenuation of transmitochondrial electrogenic transport mechanisms with consequent compromised malate-aspartate shuttle and changes in allosteric effectors of PFK1 and FBP1.

Keywords: metformin; metabolic regulation; metabolic disease; gluconeogenesis; redox regulation; dimethylbiguanide; mitochondrial glycerophosphate dehydrogenase; phosphofructokinase-1.


Conflict of interest statement

The authors declare that they have no conflicts of interest with the contents of this article.

Figures

Figure 1.
Figure 1.
Biphasic effect of metformin on the mitochondrial redox state: more oxidized at low metformin. Mouse hepatocytes (A–C) and rat hepatocytes (D–F) were precultured for 24 h and then incubated for 2 h in MEM with the metformin concentrations (100–500 μm) indicated. The medium was then replaced with fresh MEM containing 25 mm glucose, 0.25 mm octanoate, and the additions shown, and incubations were for 1 h. The medium was collected for analysis of acetoacetate (Acac) and d-3-hydroxybutyrate (HOB), and the cells were snap-frozen for ATP analysis. A and D, ratio of 3-hydroxybutyrate/acetoacetate; B and E, total production of acetoacetate + 3-hydroxybutyrate; C and F, cell ATP. Mouse data are expressed per mg of protein, and rat data are expressed as a percentage of control. Shown are means ± S.D. (error bars) for n = 8–14 hepatocyte preparations; *, p < 0.05 relative to control. G–J, mouse hepatocytes cultured for 3 h after cell plating and then incubated for 2 h without (open) or with (shaded) 100 μm metformin (G and I) and then for 1 h in fresh MEM containing 25 mm glucose + 0.125 mm octanoate and the additions indicated. G and H, effects of metformin (100 μm) or DNP (20 μm) with/without rotenone (0.1 or 0.25 μm); I and J, with/without AOA (200 μm). Results are means ± S.D.; n = 5–7. *, p < 0.05 relative to respective control; $, metformin or DNP effect. K, immunoblot for phospho-ACC for mouse hepatocytes incubated with/without metformin (100 or 500 μm) and A-769662 (10 μm) for 3 h in MEM with 25 mm glucose (HG) with/without 0.125 mm octanoate for the last hour. Shown are representative immunoblotting and densitometry for n = 4 mouse hepatocyte preparations. *, p < 0.05 relative to respective control; $, p < 0.05 octanoate effect.
Figure 2.
Figure 2.
Effects of metformin on glucose production from oxidized and reduced substrates. After overnight culture, mouse hepatocytes were preincubated for 2 h in glucose-free DMEM without or with 100 μm metformin. The medium was then replaced by fresh glucose-free DMEM containing either 5 mm DHA, 2 mm xylitol (Xyl), or glycerol at 0.25 mm or 2 mm. After 2 h, the medium was collected for determination of glucose (A), pyruvate and lactate (B), and cell ATP (C). Results are means ± S.D. (error bars) for triplicate plates from one hepatocyte isolation. *, p < 0.05 relative to DHA; $, metformin effect.
Figure 3.
Figure 3.
Dihydroxyacetone and xylitol metabolism to glucose, pyruvate, and lactate: effects of metformin and NADH shuttle inhibitors. Mouse hepatocytes were preincubated for 2 h in glucose-free DMEM. The medium was then replaced by fresh medium containing either 5 mm DHA (A–F) or 2 mm xylitol (G–L) either without (open bars) or with (shaded bars) 0.125 mm octanoate and other additions as shown, and incubation was for 2 h. Metformin (100 μm) and GPi (20 μm) were present during both preincubation and final incubation, and AOA (200 μm) was present only in the final incubation. A and G, glucose production; B and H, pyruvate + lactate production; C and I, total production of glucose + pyruvate + lactate, expressed as C3 units; D and J, glucose percentage of total metabolism; E and K, lactate/pyruvate ratio; F and L, cell G3P. Results are means ± S.D. (error bars) for n = 6–9 (A–F) or 5–7 (G–L) hepatocyte preparations. *, p < 0.05 relative to respective control; $, p < 0.05 octanoate effect.
Figure 4.
Figure 4.
Endogenous mGPDH activity and effects of GPi and metformin. A and B, activity of endogenous mGPDH assayed in permeabilized hepatocytes with the concentrations of GPi (A) or metformin (B) indicated. C–E, hepatocytes were either untreated (Con) or treated with 8 × 10⁸ pfu/ml Adv-SH-mGpd2 (SH) for Gpd2 knockdown or with Adv-mGpd2 at 1.6 (L) or 4.8 (H) × 107 pfu/ml for mGPDH overexpression. C, Gpd2/Gapdh mRNA expressed relative to untreated control. D, immunoactivity of mGPDH/GAPDH. E, mGPDH enzyme activity. Results are means ± S.D. (error bars) for n = 6–12 (A and B) or 5–6 (C–E) experiments. *, p < 0.05 relative to control.
Figure 5.
Figure 5.
The mGPDH inhibitor raises cell G3P but does not mimic metformin. Mouse hepatocytes were either untreated or treated with Adv-mGpd2 at 4.8 × 10⁷ pfu/ml (mGPDH-H) for overexpression of mGPDH as in Fig. 4. After overnight culture, they were incubated for 2 h in glucose-free DMEM with 50 or 100 μm metformin or with 80 μm GPi (STK017597), as indicated. They were then incubated in fresh medium containing 5 mm DHA and the same metformin and GPi concentrations for determination of glucose, pyruvate, and lactate production. A, cell G3P; B, glucose production; C, pyruvate + lactate production; D, total production of glucose, pyruvate, and lactate (C3 units); E, glucose percentage of total metabolism; F, cell ATP. Results are means ± S.D. (error bars) for three hepatocyte preparations. *, p < 0.05 relative to respective control; $, < 0.05 effect of mGPDH overexpression.
Figure 6.
Figure 6.
Overexpression of mGPDH in hepatocytes promotes lower G3P, a reduced mitochondrial NADH/NAD redox state, and increased glycolysis. Mouse hepatocytes were either untreated (Con) or treated with low (L) and high (H) titers of Adv-Gpd2 for overexpression of mGPDH as in Fig. 4. After a 20-h culture to allow protein overexpression, they were incubated for 1 h in MEM containing 25 mm glucose and 0.125 mm octanoate. A, G3P; B and C, 3-hydroxybutyrate/acetoacetate ratio and total 3-hydroxybutyrate + acetoacetate production; D and E, pyruvate and lactate production and lactate/pyruvate ratio; F, cell ATP. Results are means ± S.D. (error bars) for n = 7–11. *, p < 0.05 relative to untreated control.
Figure 7.
Figure 7.
Overexpression of mGPDH favors metabolism of dihydroxyacetone to pyruvate and lactate rather than glucose. Mouse hepatocytes were either untreated or treated for overexpression of mGPDH (L and H) as in Figs. 4 and 5. After a 20-h culture, they were incubated for 2 h in glucose-free DMEM containing either 5 mm DHA (A–F) or 5 mm DHA and 0.125 mm octanoate (G–L) without (open bar) or with (shaded bar) 200 μm AOA. A and G, cell G3P; B and H, glucose production; C and I, pyruvate + lactate; D and J, total production of glucose + pyruvate + lactate expressed as C3 units; E and K, glucose percentage of total metabolism; F and L, lactate/pyruvate ratio. Results are means ± S.D. (error bars) for n = 11–12 (A–F) or n = 3–5 (G–L). *, p < 0.05, effect of mGPDH overexpression; $, p < 0.05, effect of AOA.
Figure 8.
Figure 8.
Overexpression of mGPDH favors increased glycerol but not xylitol metabolism. Mouse hepatocytes were either untreated or treated for overexpression of mGPDH (L and H) as in Fig. 4 and cultured for 20 h, followed by a 2-h incubation in glucose-free DMEM. A–C, medium contained 2 mm xylitol without (open bars) or with (shaded bars) 200 μm AOA. A, cell G3P; B, total production of glucose + pyruvate + lactate expressed as C3 units; C, lactate/pyruvate ratio. D–I, medium contained glycerol at either 0.25, 0.5, or 2 mm. D, cell G3P; E, glucose production; F, pyruvate + lactate; G, total production of glucose + pyruvate + lactate (C3 units); H, glucose percentage of total metabolism; I, lactate/pyruvate ratio. Results are means ± S.D. (error bars) for n = 4–5; *, p < 0.05, effect of mGPDH overexpression (A–I); $, p < 0.05, effect of AOA (A–C).
Figure 9.
Figure 9.
Comparison of metformin and an AMPK activator on DHA metabolism in cells depleted of fructose 2,6-P2. Mouse hepatocytes were either untreated (open bars) or treated (filled bars) with an adenoviral vector for expression of PFK-KD to deplete cell fructose 2,6-P2 (38). After a 20-h culture, they were preincubated for 2 h in glucose-free medium with 100 μm metformin or 10 μm A-769662. They were then incubated for 2 h in fresh medium containing 5 mm DHA. A, glucose production; B, pyruvate + lactate production; C, total production of glucose + pyruvate + lactate (C3 units); D, glucose percentage of total metabolism; E, lactate/pyruvate ratio; F, cell ATP. Results are means ± S.D. (error bars) for n = 4–6; *, p < 0.05, relative to respective control; $, effect of PFK-KD.
Figure 10.
Figure 10.
Metformin inhibition of gluconeogenesis from DHA is abolished by inhibitors of PFK1 or FBP1. Mouse hepatocytes were incubated for 2 h in glucose-free DMEM without (open bars) or with (shaded bars) 100 μm metformin and then for 2 h in fresh medium containing 5 mm DHA + 200 nm S4048 and other additions as indicated: ATA at 25 or 50 μm and FBPi at 5 μm. A, glucose production; B, cell glucose 6-P; C, pyruvate + lactate production; D, total production of glucose + pyruvate + lactate, as C3 units; E, glucose percentage of total metabolism; F, cell ATP. Results are means ± S.D. (error bars) for n = 5–6. *, p < 0.05 relative to respective control; $, p < 0.05 metformin effect.
Figure 11.
Figure 11.
Substrate and inhibitor effects on the NADH/NAD redox state. Octanoate is metabolized in mitochondria by β-oxidation, generating NADH and FADH, which are oxidized in the electron transport chain, and the final end products: Acac and HOB. The ratio of HOB/Acac reflects the mitochondrial NADH/NAD redox state. It is increased by high metformin and rotenone (Complex I inhibitor) and decreased by low metformin and uncoupler, DNP (Fig. 1). It is increased by overexpression of mGPDH, which catalyzes oxidation of G3P with transfer of electrons to the respiratory chain (Fig. 6). DHA is metabolized to either glucose or pyruvate. The latter results in production of NADH (at GAPDH), which is coupled to either formation of lactate by lactate dehydrogenase or malate, which is oxidized in mitochondria by the malate–aspartate shuttle (MAS) (Figs. 3 and 7). Xylitol metabolism generates NADH during oxidation to xylulose and at GAPDH during formation of pyruvate (Figs. 3 and 8). Glycerol metabolism generates G3P, which is converted to DHAP (dihydroxyacetone phosphate) by either mGPDH, with transfer of electrons to the respiratory chain, or by cGPDH (cytoplasmic glycerol-3-phosphate dehydrogenase), generating NADH in the cytoplasm, which reoxidized via the MA-shuttle (Fig. 8). AOA inhibits the MA-shuttle at the transaminase reaction, increases the lactate/pyruvate ratio and G3P, and inhibits total xylitol metabolism (Figs. 3, 7, and 8). The MA-shuttle is also inhibited at the aspartate transport step by mitochondrial depolarization (↓ψ). GPi (80 μm, mGPDH inhibitor) increases G3P (Fig. 5). mGPDH overexpression lowers G3P, increases total glycerol metabolism, and favors DHA metabolism to pyruvate and lactate relative to glucose (Figs. 6–8). Octanoate, ATA (PFK1 inhibitor), and fructose 2,6-P2 depletion promote DHA metabolism to glucose relative to pyruvate and lactate (Figs. 9 and 10). Metformin (100 μm or <2 nmol/mg of cell protein) promotes decreased DHA metabolism to glucose relative to pyruvate plus lactate and moderately increases the lactate/pyruvate ratio and decreases cell G3P (Figs. 3, 5, 9, and 10). It lowers G6P in conditions of restrained G6P entry into the endoplasmic reticulum with a transport inhibitor, S4048 (Fig. 10).

References

    1. Bailey C. J. (2017) Metformin: historical overview. Diabetologia 60, 1566–1576 10.1007/s00125-017-4318-z - DOI - PubMed
    1. Natali A., and Ferrannini E. (2006) Effects of metformin and thiazolidinediones on suppression of hepatic glucose production and stimulation of glucose uptake in type 2 diabetes: a systematic review. Diabetologia 49, 434–441 10.1007/s00125-006-0141-7 - DOI - PubMed
    1. Heishi M., Ichihara J., Teramoto R., Itakura Y., Hayashi K., Ishikawa H., Gomi H., Sakai J., Kanaoka M., Taiji M., and Kimura T. (2006) Global gene expression analysis in liver of obese diabetic db/db mice treated with metformin. Diabetologia. 49, 1647–1655 10.1007/s00125-006-0271-y - DOI - PubMed
    1. Cao J., Meng S., Chang E., Beckwith-Fickas K., Xiong L., Cole R. N., Radovick S., Wondisford F. E., and He L. (2014) Low concentrations of metformin suppress glucose production in hepatocytes through AMP-activated protein kinase (AMPK). J. Biol. Chem. 289, 20435–20446 10.1074/jbc.M114.567271 - DOI - PMC - PubMed
    1. He L., and Wondisford F. E. (2015) Metformin action: concentrations matter. Cell Metab. 21, 159–162 10.1016/j.cmet.2015.01.003 - DOI - PubMed

Publication types

MeSH terms