. 2018 Dec 26;10(12):4213-4223.
doi: 10.18632/aging.101724.

Caloric restriction is associated with preservation of muscle strength in experimental cancer cachexia

Affiliations

Caloric restriction is associated with preservation of muscle strength in experimental cancer cachexia

Stef Levolger et al. Aging (Albany NY). .

Abstract

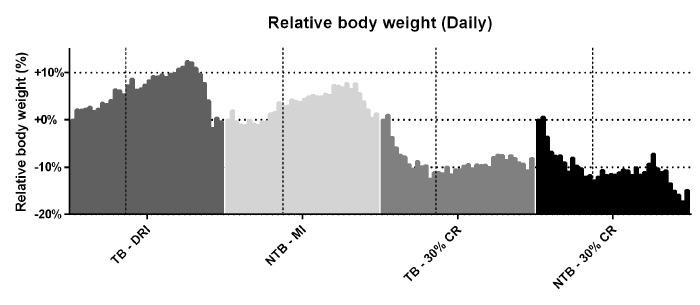
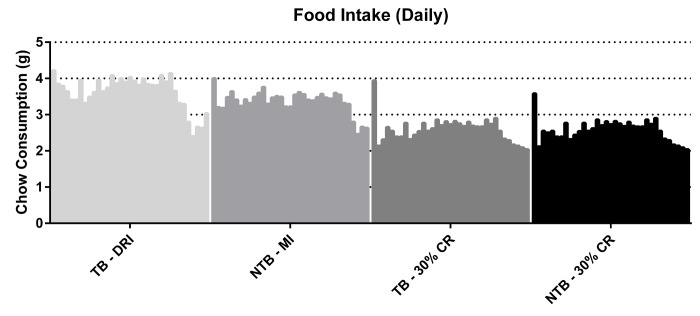
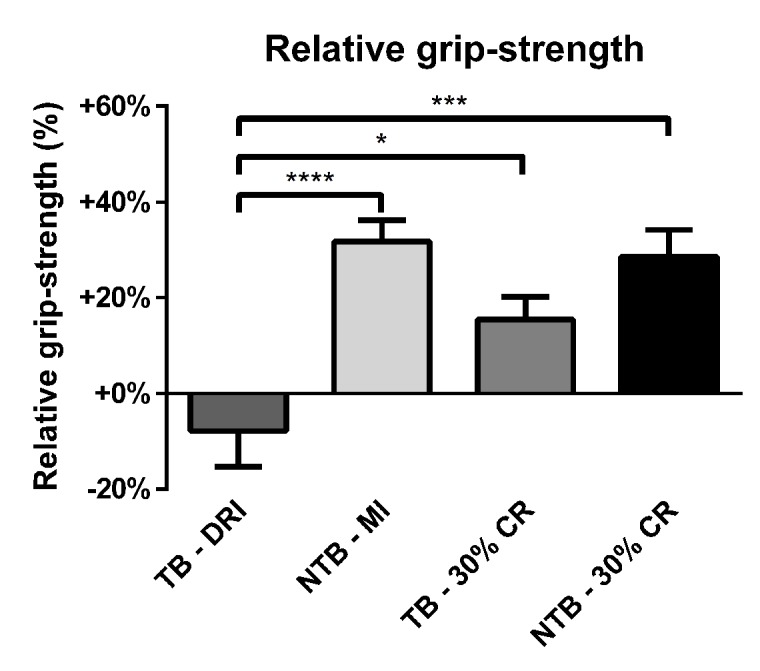
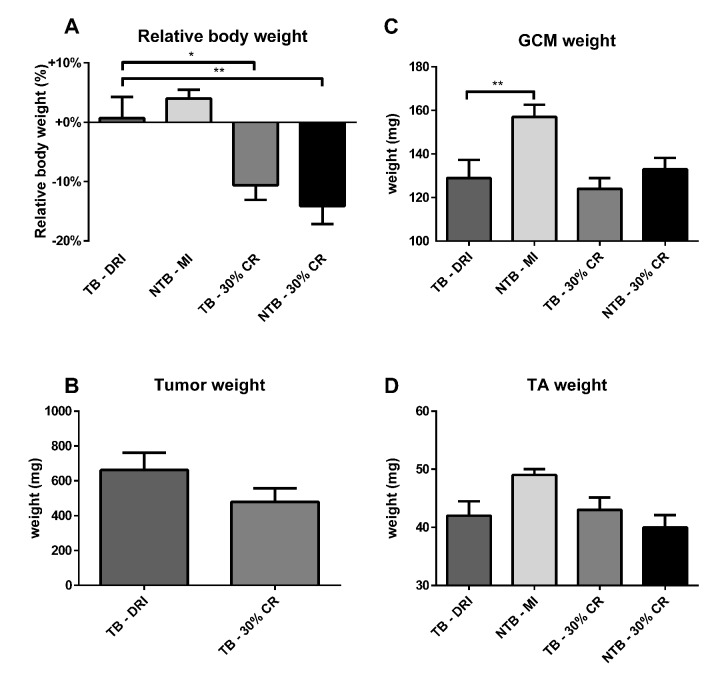
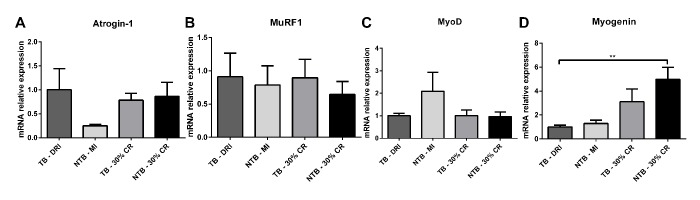
Caloric restriction increases lifespan and healthspan, and limits age-associated muscle wasting. In this study, we investigate the impact of 30% caloric restriction (CR) in a murine cancer cachexia model. Forty CD2F1 mice were allocated as C26 tumor-bearing (TB) + ad libitum food intake (dietary reference intake [DRI]), TB CR, non-TB (NTB) CR, or NTB matched intake (MI). TB groups were inoculated subcutaneously with 0.5x10⁶ C26 cells 14 days after initiating CR. Bodyweight, food intake, and grip-strength were recorded periodically. Gastrocnemius (GCM) and tibialis anterior (TA) muscles were resected and weighed 3 weeks after tumor inoculation. mRNA expression of MuRF1, Atrogin-1, myogenin, and MyoD was determined. At tumor inoculation, the mean body weight of TB CR was 88.6% of initial body weight and remained stable until sacrifice. TB DRI showed wasting before sacrifice. TB groups experienced muscle wasting compared with NTB MI. Grip-strength change was less severe in TB CR. Expression of MuRF1, Atrogin-1, and MyoD was similar between TB DRI and both CR groups. Expression of myogenin was increased in CR groups. In conclusion, caloric restriction limits loss of muscle strength but has no impact on muscle mass despite significant loss of body weight in an experimental cancer-associated cachexia model.

Keywords: cachexia; caloric restriction; cancer; muscle wasting.


Conflict of interest statement

CONFLICTS OF INTEREST: The authors have no conflicts of interest to declare.

Figures

Figure 1
Figure 1
Daily body weight throughout the experiment. Grouped histograms depicting the mean daily bodyweights per group in C26 tumor-bearing (TB) male CD2F1 mice with ad libitum access to chow (dietary reference intake [DRI], n = 10); C26 TB mice on a 30% caloric restriction (CR, n = 10) diet; non-tumor bearing (NTB) mice with matched intake (MI, n = 10); NTB mice on a 30% caloric restriction (n = 10). The vertical dashed lines indicate the timepoint in the experiment in which tumor inoculation was performed in tumor-bearing groups. The vertical bars indicate daily measurements of body weight, ranging from day 0 to 35, for each specified group. Bodyweight was normalized to each animal’s body weight on day 0 and is expressed as the percental difference. Following initiation of 30% CR a rapid decline in body weight was observed prior to tumor inoculation, -10.5% for C26 TB 30% CR mice and -10.6% for NTB 30% CR mice (p < 0.001 for both groups compared to C26 TB DRI). Following tumor inoculation, C26 TB DRI mice experienced a 10.6% drop in bodyweight preceding sacrifice (p = 0.01, paired-sample t-test), whereas C26 TB 30% CR mice had a steady bodyweight in this phase of the experiment. NTB MI mice experienced a 6.4% drop in body weight (p = 0.002, paired-sample t-test) and NTB 30% CR mice experienced a 7.6% drop in body weight (p = 0.004, paired-sample t-test) preceding sacrifice.
Figure 2
Figure 2
Daily food intake throughout the experiment. Grouped histograms depicting the mean daily food intake per group in C26 tumor-bearing (TB) male CD2F1 mice with ad libitum access to chow (dietary reference intake [DRI], n = 10); C26 TB mice on a 30% caloric restriction (CR, n = 10) diet; non-tumor bearing (NTB) mice with matched intake (MI, n= 10); NTB mice on a 30% caloric restriction (n = 10). The vertical bars indicate daily measurements of food intake, ranging from day 0 to 35, for each specified group. Food intake is expressed as grams (g). Food intake of C26 TB DRI mice decreased in the final days preceding sacrifice from 3.8 g to 2.9 g (p = 0.0002, paired-sample t-test). Consequently, food intake decreased in the other groups accordingly.
Figure 3
Figure 3
Relative grip-strength at the end of the experiment. Bar graphs depicting the mean ± SEM for final grip-strength normalized to starting grip-strength in C26 tumor-bearing (TB) male CD2F1 mice with ad libitum access to chow (dietary reference intake [DRI], n = 10); C26 TB mice on a 30% caloric restriction (CR, n = 10) diet; non-tumor bearing (NTB) mice with matched intake (MI, n = 10); NTB mice on a 30% caloric restriction (n = 10). Multiple group comparisons were done by one-way ANOVA with a Bonferroni’s post hoc test. All groups were compared against TB – DRI mice. Asterisk brackets are displayed for significant results only. * p < 0.05 ** p < 0.01 *** p < 0.001.
Figure 4
Figure 4
Body weight, muscle weight and tumor mass at sacrifice. Bar graphs depicting the mean ± SEM for (A) final bodyweight normalized to starting bodyweight, (B) tumor weight, (C) gastrocnemius muscle weight and (D) tibialis anterior muscle weight in C26 tumor-bearing (TB) male CD2F1 mice with ad libitum access to chow (dietary reference intake [DRI], n = 10); C26 TB mice on a 30% caloric restriction (CR, n = 10) diet; non-tumor bearing (NTB) mice with matched intake (MI, n = 10); NTB mice on a 30% caloric restriction (n = 10). Multiple group comparisons were done by one-way ANOVA with a Bonferroni’s post hoc test. All groups were compared against TB – DRI mice. Asterisk brackets are displayed for significant results only. * p < 0.05 ** p < 0.01 *** p < 0.001. Statistical comparison between TB DRI and TB 30% CR mice in tumor weight was done by Student’s t-test (p = 0.17).
Figure 5
Figure 5
mRNA expression levels in cachectic muscle. Bar graphs depicting the mean ± SEM mRNA expression levels in gastrocnemius muscle of (A) Atrogin-1, (B) MuRF1, (C) MyoD and (D) Myogenin in C26 tumor-bearing (TB) male CD2F1 mice with ad libitum access to chow (dietary reference intake [DRI], n = 10); C26 TB mice on a 30% caloric restriction (CR, n = 10) diet; non-tumor bearing (NTB) mice with matched intake (MI, n = 10); NTB mice on a 30% caloric restriction (n = 10). Multiple group comparisons were done by one-way ANOVA with a Bonferroni’s post hoc test. All groups were compared against TB – DRI mice. Asterisk brackets are displayed for significant results only. * p < 0.05 ** p < 0.01 *** p < 0.001.

References

    1. Fearon K, Strasser F, Anker SD, Bosaeus I, Bruera E, Fainsinger RL, Jatoi A, Loprinzi C, MacDonald N, Mantovani G, Davis M, Muscaritoli M, Ottery F, et al.. Definition and classification of cancer cachexia: an international consensus. Lancet Oncol. 2011; 12:489–95. 10.1016/S1470-2045(10)70218-7 - DOI - PubMed
    1. Moses AW, Slater C, Preston T, Barber MD, Fearon KC. Reduced total energy expenditure and physical activity in cachectic patients with pancreatic cancer can be modulated by an energy and protein dense oral supplement enriched with n-3 fatty acids. Br J Cancer. 2004; 90:996–1002. 10.1038/sj.bjc.6601620 - DOI - PMC - PubMed
    1. Tan BH, Fearon KC. Cachexia: prevalence and impact in medicine. Curr Opin Clin Nutr Metab Care. 2008; 11:400–07. 10.1097/MCO.0b013e328300ecc1 - DOI - PubMed
    1. Tisdale MJ. Mechanisms of cancer cachexia. Physiol Rev. 2009; 89:381–410. 10.1152/physrev.00016.2008 - DOI - PubMed
    1. Warren S. The immediate causes of death in cancer. Am J Med Sci. 1932; 184:610–15. 10.1097/00000441-193211000-00002 - DOI

LinkOut - more resources