. 2018 Dec 27;24(1):89.
doi: 10.3390/molecules24010089.

Microstructure Optimization of Mg-Alloys by the ECAP Process Including Numerical Simulation, SPD Treatments, Characterization, and Hydrogen Sorption Properties

Affiliations

Microstructure Optimization of Mg-Alloys by the ECAP Process Including Numerical Simulation, SPD Treatments, Characterization, and Hydrogen Sorption Properties

Nataliya Skryabina et al. Molecules. .

Abstract

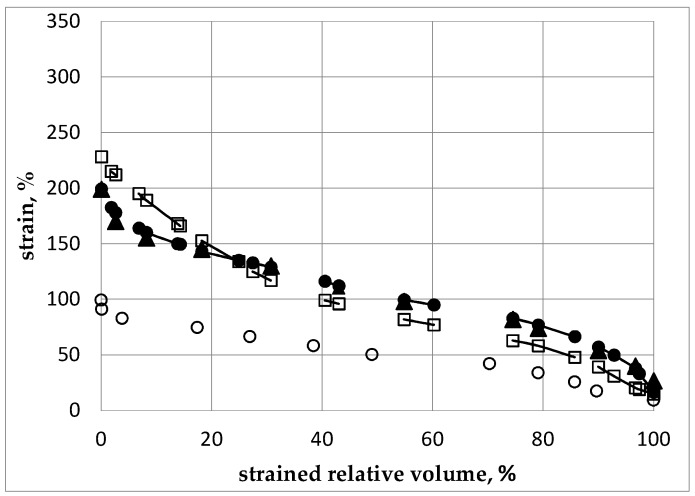
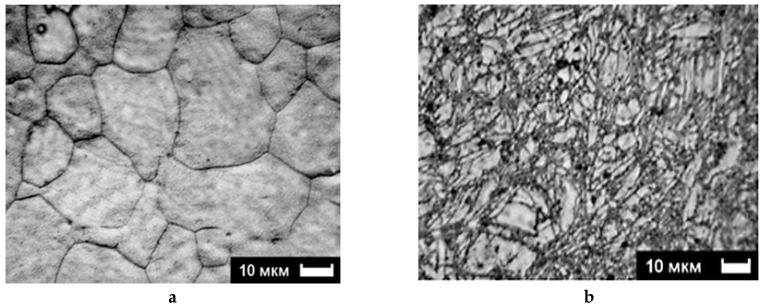
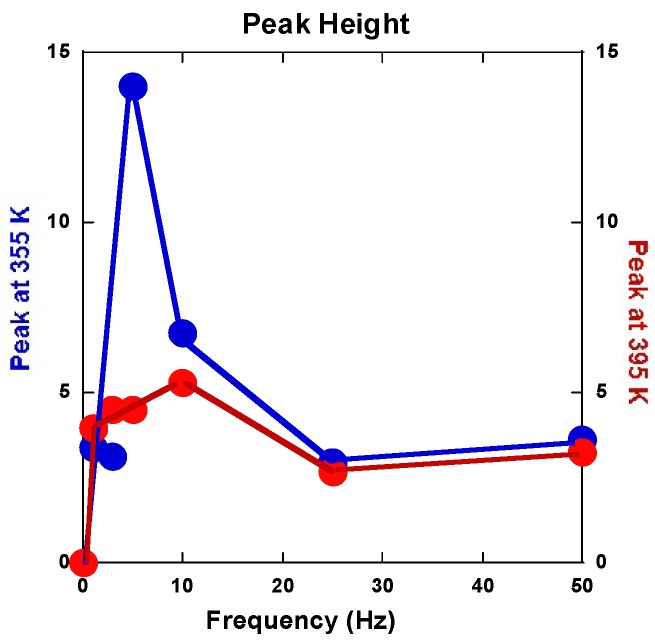
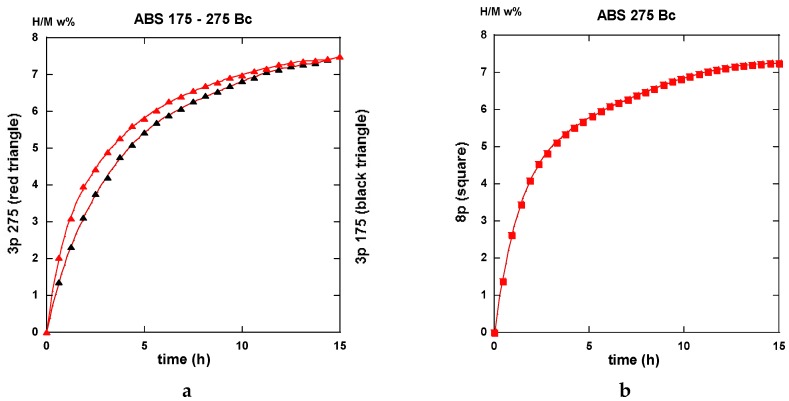
Both numerical simulation and hardness measurements were used to determine the mechanical and microstructural behavior of AZ31 bulk samples when submitted to the Equal Channel Angular Pressing (ECAP) technique. Billets of this representative of Mg-rich alloys were submitted to different numbers of passes for various ECAP modes (anisotropic A, isotropic BC). The strain distribution, the grain size refinement, and the micro-hardness were used as indicators to quantify the effectiveness of the different processing routes. Structural characterizations at different scales were achieved using Scanning Electron Microscopy (SEM), micro-analysis, metallography, Small Angle Neutron Scattering SANS, X-Ray Diffraction (XRD), and texture determination. The grain and crystallite size distribution and orientation as well as defect impacts were determined. Anelastic Spectroscopy (AS) on mechanically deformed samples have shown that the temperature of ECAP differentiate the fragile to ductile regime. MgH₂ consolidated powders were checked for using AS to detect potential hydrogen motions and interaction with host metal atoms. After further optimization, the different mechanically-treated samples were submitted to hydrogenation/dehydrogenation (H/D) cycles, which shows that, for a few passes, the BC mode is better than the A one, as supported by theoretical and experimental microstructure analyses. Accordingly, the hydrogen uptake and (H/D) reactions were correlated with the optimized microstructure peculiarities and interpreted in terms of Johnson-Avrami- Mehl-Kolmogorov (JAMK) and Jander models, successively.

Keywords: ECAP process; anelastic spectroscopy; grain and crystallite size; hydrogen uptake and kinetics sorption; magnesium alloys; numerical simulation; severe plastic deformation; texture.


Conflict of interest statement

The authors declare no conflict of interest.

Figures

Figure 1
Figure 1
A picture of ECAP processed billet shows transformation of a reference square array drawn on the four 50 × 10 mm faces at the initial state.
Figure 2
Figure 2
Simulated distribution of strain intensities: (a) at 1/3 pass, (b) at 3/4 pass of the 1st ECAP pass (relative scales: blue = minimum strain, green = intermediate strain, red = maximum strain).
Figure 3
Figure 3
Microstructure of a pure Mg sample after 1 ECAP pass at RT. The white bar scale is for 20 µm.
Figure 4
Figure 4
Strain intensity distribution after 2 ECAP passes done: (a)—along mode A, (b)—along mode BC, after 3 ECAP passes done: (c)—along mode A, (d)—along mode BC. The relative scale is between minimum strain = blue, intermediate strain = green and maximum strain = red without any physical meaning.
Figure 5
Figure 5
Strain level (%) versus the strained relative volume of sample (%) after different ECAP processes—open circles (O): after a 1st pass, open squares (): after a 2nd pass, billet is not rotated reference to the 1st pass, black circles (): after a 2nd pass, with a rotation of φ = 90° reference to the 1st pass, black triangles (▲): after a 2nd pass, with a rotation of φ = 180°.
Figure 6
Figure 6
Strain level (%) versus the strained relative volume of sample (%) after the 3rd pass with different rotations relative to the 2nd pass. Black dots (): optimal ECAP process (Figure 5) with rotation of φ = 90° relative to the 1st pass (ВС mode). Open squares (): billet was not rotated relative to the 2nd pass. Black diamonds (♦): rotation is φ = 90° relative to the 2nd pass. Open triangles (∆) rotation is φ = 180° relative to the 2nd pass.
Figure 7
Figure 7
Impact of the number of ECAP passes on the grain size in a AZ31 billet as processed at 200 °C. It is worth it to note that, after 3 passes, a minimum grain size of 3 µm was achieved and then stabilized.
Figure 8
Figure 8
AZ31 microstructure: (a)—initial state, (b)—after 2 BC passes at 200 °C.
Figure 9
Figure 9
Microhardness of the AZ31 alloy vs the increasing number of ECAP passes at 200 °C.
Figure 10
Figure 10
Dependence of the stress/strain response during ECAP compression of the AZ31 samples at RT: 1, as-cast (); 2, after 1st ECAP pass (); 3, after 2nd ECAP pass ().
Figure 11
Figure 11
Strain level (%) versus the strained relative volume of the sample (%) versus the ECAP passes: diamonds (♦): 1st pass, triangles (▲): 2nd pass at φ = 90°, being the optimal combination, mode BC. Black squares (■): 2nd pass at φ = 180°, mode A, black circles (): 3rd pass at φ = 90° relative to the 2nd pass at φ = 90°, mode BC.
Figure 12
Figure 12
Microstructure versus temperature of AZ31 billets after 2 BC ECAP passes: (a)—as received, (b)—150 °C, (c)—200 °C, (d)—250 °C, (e)—300 °C.
Figure 13
Figure 13
Microstructure versus the number of BC ECAP passes of AZ31 billets after ECAP BC passes at 250 °C: (a)—2 passes, (b)—4 passes, (c)—5 passes, (d)—8 passes, (e)—9 passes.
Figure 14
Figure 14
Microstructure and twinning: (a): ZK60 for 1 pass A mode at 150° C: various fields of twins affecting large and well oriented grains, (b): AZ31 for 2 passes BC mode at 150 °C where zones can be seen as twin orientations along the 2 successive passes directions of (1) and (2) and (3) perpendicular bi-twinned grains.
Figure 15
Figure 15
Williamson-Hall [44] plots allow for the study of the impact of temperature processing AZ31 billets submitted to A-type ECAP passes: (a)—marked strained material with a mean small size of crystallites of 300-400 nm for 1 pass at RT, (b)—2 passes at 250 K, which revealed almost no strain in spite of a marked anisotropic distribution and a minimum mean size of crystallites (<100 nm).
Figure 16
Figure 16
Williamson-Hall [44] plots allow for the determination of the crystallite size and the level of stresses leading modulation of the linewidth of XDR patterns versus the Bragg angle (scattering vector s) for ECAP-treated AZ31 billets at 250 °C: (a)—mode A - 9 passes, red: (dots and squares: see text), 9 passes + 1 pass at RT (blue), (b)—mode BC - 9 passes (red), 9 passes + 1 pass at RT (blue).
Figure 17
Figure 17
Stereographic projections of pole figures for the planes: (002), (100), (101), and (110).
Figure 18
Figure 18
Pole figure of the (002) plane obtained after 2 passes mode BC.
Figure 19
Figure 19
Texture integrated and normalized intensities of the four main crystallographic planes. (a)—after 1 pass (~A), (b)—after 9 passes BC. Colors are for: blue (002), red (100), black (101), and green (110) lines.
Figure 20
Figure 20
Small angle neutron scattering records (halo) of 1 pass AZ31 at RT for (a)—39 and (b)—8 m as distances sample to detector.
Figure 21
Figure 21
Anelastic spectroscopy traces recorded under 5 Hz excitation, of the elastic energy dissipation factor Q−1 (dots) and Young modulus E (open circles) versus temperature (heating = black, cooling down = red) shown e.g., for (a) (left) Mg#1 sample (225 °C, BC ECAP treated) and (b) (right) for Mg#2 sample (175 °C, BC ECAP treated).
Figure 22
Figure 22
Relative height of the two peaks found on cooling down branch Mg#2 4 BC-175 °C. Lines are guides for the eyes (origin dots have no physical meaning).
Figure 23
Figure 23
Hydrogen absorption rate (H/M w%) versus time for the samples treated in mode A at 175 °C (black): (a)—for 3 passes, (b)—for 8 passes.
Figure 24
Figure 24
Hydrogen absorption rate (H/M w%) versus time at 275 °C (red) for 3 passes (triangles).
Figure 25
Figure 25
Hydrogen desorption rate (H/M w%) versus time of samples: (a)—for 3 passes (triangles) and for 8 passes (squares) as treated at 175 °C (black).; (b)—for 8 passes as treated at 275 °C (red).
Figure 26
Figure 26
Hydrogen absorption rate (H/M w%) for BC ECAP- treated billets: (a)—3 passes at 175 °C (black) and 3 passes at 275 °C (red). (b)—for 8 passes at 275 °C (red). Relative gains (kinetics and uptake) from three to 8 passes is less than for the A mode as shown in Figure 24 because of a more homogeneous micro-structure in the billet.
Figure 27
Figure 27
Hydrogen desorption rate (H/M w%) of samples ECAP-treated at 175 °C—2 passes (triangles) and 8 passes (squares).
Figure 28
Figure 28
Hydrogen desorption rate (H/M w%) for: (a)—A-mode ECAP treated at 275 °C for 3 passes (b)—BC- and A-mode ECAP-treated for 8 passes at 275 °C.
Figure 29
Figure 29
Comparison of the traces in terms of the 1st and 2nd absorption rates (H/M w%) of 8 passes ECAP-treated samples at 275 °C: (a)—mode A, (b)—mode BC.
Figure 30
Figure 30
Second absorption rate traces (H/M w%) of: (a)—3 passes ECAP treated in BC route at 175° and 275 °C: (b)—difference between traces A-BC routes for 8 passes at 275 °C and for 3 passes BC between 175 & 275 °C for similar results whatever the treatments are.
Figure 31
Figure 31
Comparison of the 2nd desorption rate traces (H/M w%) of: (a)—three passes BC route ECAP treated at 175 and 275 °C. (b)—Eight passes ECAP-treated at 275 °C for A and BC routes.
Figure 32
Figure 32
Numerical fits using Equation (1) at the beginning absorption for (2) and (3) at the end of absorption: (a)—for eight passes A mode treated at 275°C, the 1st cycle absorption, (b)—for three passes BC mode treated at 175 °C, the 2nd cycle absorption.
Figure 33
Figure 33
Limit value ξL (%) of the change in kinetic process vs. log(DF). Blue dots are for ECAP mode A, red dots are for ECAP mode BC. (a): for the 1st hydrogenation (b): for the 2nd hydrogenation.
Figure 34
Figure 34
ECAP tool used for SPD treatments to Mg alloys, as developed by POINSARD Design and Tool SAS (Besançon, France). Up and left: the open channeling die, down-left: tools forming different angle channels, ΦE = 95°, 105°, 115°, 125°, and 135°, right: ECAP system (die, punch) [36].

References

    1. Zehetbauer M.J., Valiev R.Z. Nanomaterials by Severe Plastic Deformation. Wiley-VCH GmbH; Weinheim, Germany: 2004. p. 850. - DOI
    1. Kim H.S., Estrin Y. Microstructural modelling of equal channel angular pressing for producing ultrafine grained materials. J. Mater. Process. Technol. 2005;410–411:285–289. doi: 10.1016/j.msea.2005.08.047. - DOI
    1. Figueiredo R., Langdon T. Grain refinement and mechanical behavior of a magnesium alloy processed by ECAP. J. Mater. Sci. 2010;45:4827–4836. doi: 10.1007/s10853-010-4589-y. - DOI
    1. Young J.P., Askari H., Hovanski Y., Heiden M.J., Field D.P. Microstructural stability after severe plastic deformation of AZ31 Magnesium. Mater. Charact. 2015;101:9–19. doi: 10.1016/j.matchar.2014.12.026. - DOI
    1. Yurchenkoa N.Y., Stepanova N.D., Salishcheva G.A., Rokhlinb L.L., Rokhlinb S.V. Effect of multiaxial forging on microstructure and mechanical properties of Mg-0.8Ca alloy. IOP Conf. Ser. Mater. Sci. Eng. 2014;63:012075. doi: 10.1088/1757-899X/63/1/012075. - DOI