

Copula directional dependence for inference and statistical analysis of whole-brain connectivity from fMRI data
- PMID: 30592175
- PMCID: PMC6346668
- DOI: 10.1002/brb3.1191
Copula directional dependence for inference and statistical analysis of whole-brain connectivity from fMRI data
Abstract
Introduction: Inferring connectivity between brain regions has been raising a lot of attention in recent decades. Copula directional dependence (CDD) is a statistical measure of directed connectivity, which does not require strict assumptions on probability distributions and linearity.
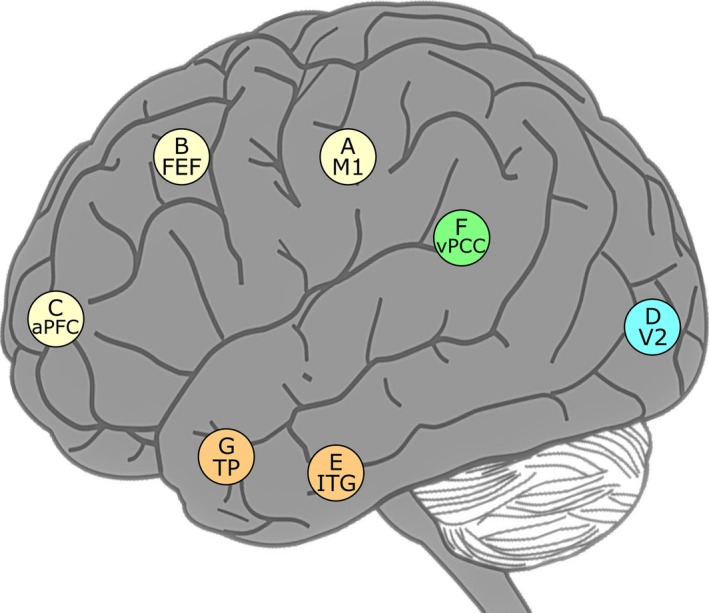
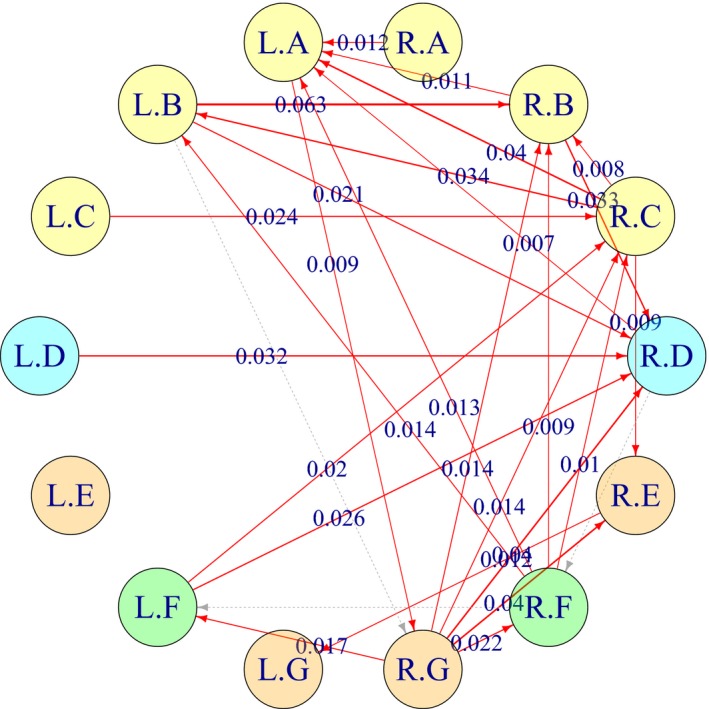
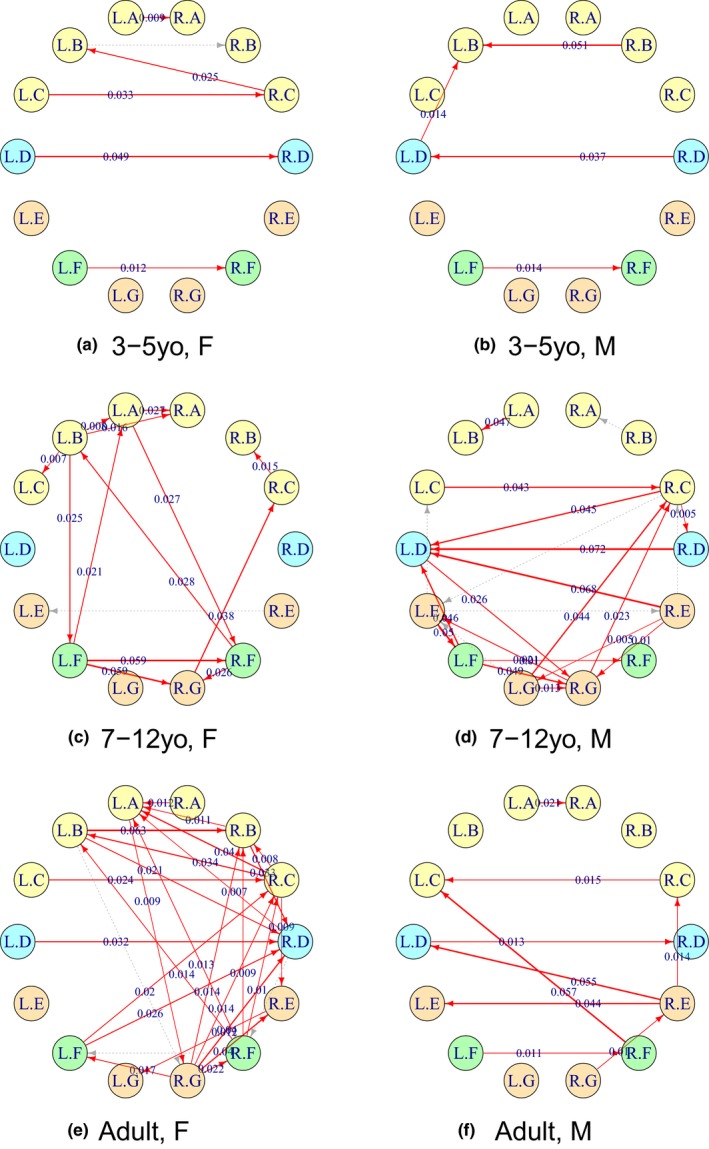
Methods: In this work, CDDs between pairs of local brain areas were estimated based on the fMRI responses of human participants watching a Pixar animation movie. A directed connectivity map of fourteen predefined local areas was obtained for each participant, where the network structure was determined by the strengths of the CDDs. A resampling technique was further applied to determine the statistical significance of the connectivity directions in the networks. In order to demonstrate the effectiveness of the suggested method using CDDs, statistical group analysis was conducted based on graph theoretic measures of the inferred directed networks and CDD intensities. When the 129 fMRI participants were grouped by their age (3-5 year-old, 7-12 year-old, adult) and gender (F, M), nonparametric two-way analysis of variance (ANOVA) results could identify which cortical regions and connectivity structures correlated with the two physiological factors.
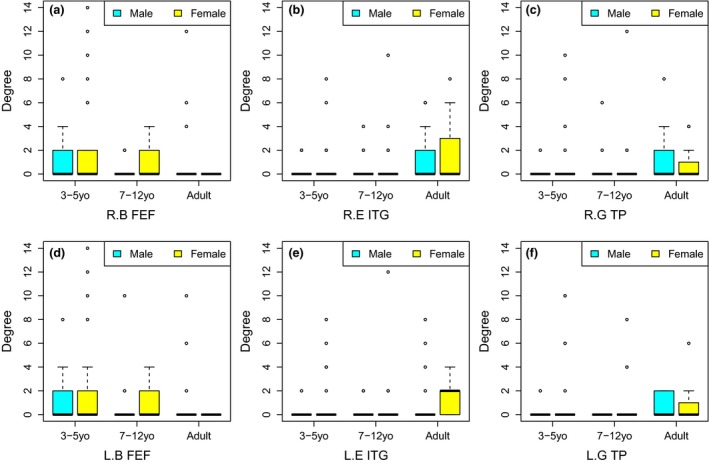
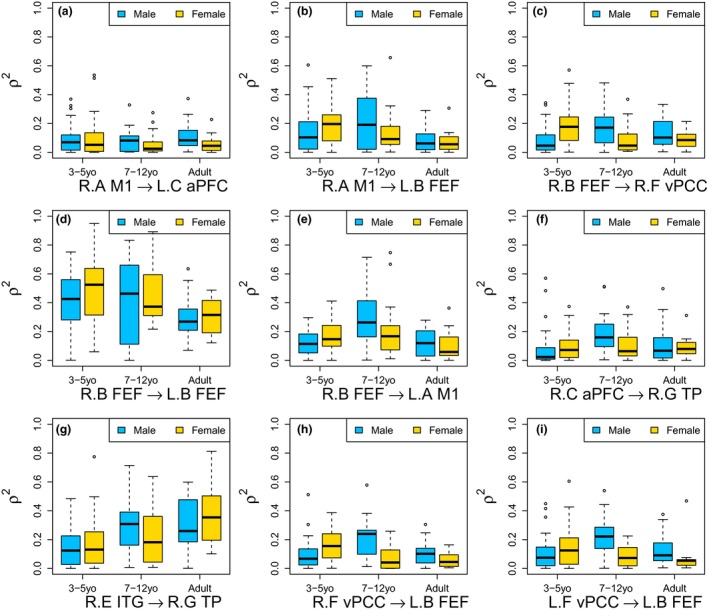
Results: Especially, we could identify that (a) graph centrality measures of the frontal eye fields (FEF), the inferior temporal gyrus (ITG), and the temporopolar area (TP) were significantly affected by aging, (b) CDD intensities between FEF and the primary motor cortex (M1) and between ITG and TP were highly significantly affected by aging, and (c) CDDs between M1 and the anterior prefrontal cortex (aPFC) were highly significantly affected by gender.
Software: The R source code for fMRI data preprocessing, estimation of directional dependences, network visualization, and statistical analyses are available at https://github.com/namgillee/CDDforFMRI.
Keywords: Brodmann area; connectivity; cortex; directional dependence; functional magnetic resonance imaging (fMRI); group analysis.
© 2018 The Authors. Brain and Behavior published by Wiley Periodicals, Inc.
Figures
Similar articles
-
Granger causality analysis in combination with directed network measures for classification of MS patients and healthy controls using task-related fMRI.Comput Biol Med. 2019 Dec;115:103495. doi: 10.1016/j.compbiomed.2019.103495. Epub 2019 Oct 13. Comput Biol Med. 2019. PMID: 31698238
-
Dynamic functional connectivity analysis based on time-varying partial correlation with a copula-DCC-GARCH model.Neurosci Res. 2021 Aug;169:27-39. doi: 10.1016/j.neures.2020.06.006. Epub 2020 Jul 3. Neurosci Res. 2021. PMID: 32628970
-
Dynamic functional connectivity analysis of functional MRI based on copula time-varying correlation.J Neurosci Methods. 2019 Jul 15;323:32-47. doi: 10.1016/j.jneumeth.2019.05.004. Epub 2019 May 14. J Neurosci Methods. 2019. PMID: 31100293
-
Altered functional connectivity architecture of the brain in medication overuse headache using resting state fMRI.J Headache Pain. 2017 Dec;18(1):25. doi: 10.1186/s10194-017-0735-0. Epub 2017 Feb 20. J Headache Pain. 2017. PMID: 28220377 Free PMC article.
-
Deconvoluting human Brodmann area 8 based on its unique structural and functional connectivity.Front Neuroanat. 2023 Jun 22;17:1127143. doi: 10.3389/fnana.2023.1127143. eCollection 2023. Front Neuroanat. 2023. PMID: 37426900 Free PMC article. Review.
Cited by
-
Detecting heterogeneity in the causal direction of dependence: A model-based recursive partitioning approach.Behav Res Methods. 2024 Apr;56(4):2711-2730. doi: 10.3758/s13428-023-02253-8. Epub 2023 Oct 19. Behav Res Methods. 2024. PMID: 37858004
References
-
- Ashburner, J. , Barnes, G. , Chen, C.‐C. , Daunizeau, J. , Flandin, G. , Friston, K. , & Stephen, K. E. (2017). SPM12 manual. 12 Queen Square, London WC1N 3BG, UK. Retrieved from www.fil.ion.ucl.ac.uk/spm/
-
- Blöbaum, P. , Janzing, D. , Washio, T. , Shimizu, S. , & Schölkopf, B. (2018). Cause‐effect inference by comparing regression errors. In Proceedings of the 21st International Conference on Artificial Intelligence and Statistics (AISTATS), pages 900–909.
-
- Brodmann, K. (1909). Vergleichende lokalisationslehre der grosshirnrinde: In ihren prinzipien dargestellt auf grund des zellenbaues. Leipzig: Barth.
-
- Brodmann, K. (2006). Brodmann's ‘localisation in the cerebral cortex’, 3rd edn Berlin, Germany: Springer; (Translated by L. J. Garey).
Publication types
MeSH terms
LinkOut - more resources
Full Text Sources
Medical
