. 2018 Dec 28;14(12):e1007859.
doi: 10.1371/journal.pgen.1007859. eCollection 2018 Dec.

On the unfounded enthusiasm for soft selective sweeps II: Examining recent evidence from humans, flies, and viruses

Affiliations

On the unfounded enthusiasm for soft selective sweeps II: Examining recent evidence from humans, flies, and viruses

Rebecca B Harris et al. PLoS Genet. .

Abstract

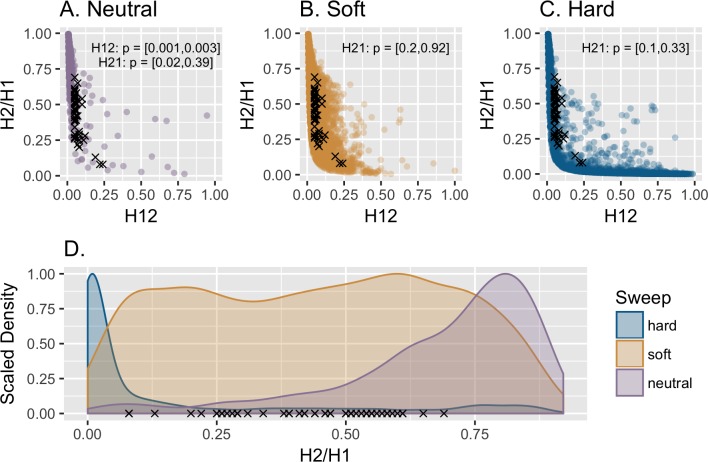
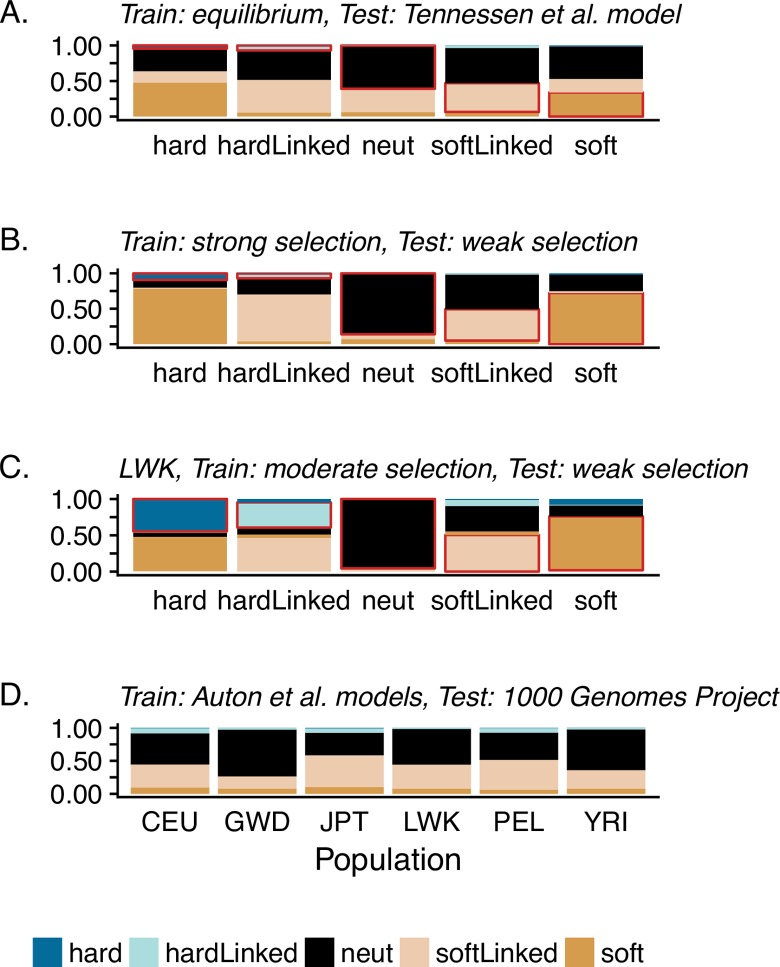
Since the initial description of the genomic patterns expected under models of positive selection acting on standing genetic variation and on multiple beneficial mutations-so-called soft selective sweeps-researchers have sought to identify these patterns in natural population data. Indeed, over the past two years, large-scale data analyses have argued that soft sweeps are pervasive across organisms of very different effective population size and mutation rate-humans, Drosophila, and HIV. Yet, others have evaluated the relevance of these models to natural populations, as well as the identifiability of the models relative to other known population-level processes, arguing that soft sweeps are likely to be rare. Here, we look to reconcile these opposing results by carefully evaluating three recent studies and their underlying methodologies. Using population genetic theory, as well as extensive simulation, we find that all three examples are prone to extremely high false-positive rates, incorrectly identifying soft sweeps under both hard sweep and neutral models. Furthermore, we demonstrate that well-fit demographic histories combined with rare hard sweeps serve as the more parsimonious explanation. These findings represent a necessary response to the growing tendency of invoking parameter-heavy, assumption-laden models of pervasive positive selection, and neglecting best practices regarding the construction of proper demographic null models.


Conflict of interest statement

The authors have declared that no competing interests exist.

Figures

Fig 1
Fig 1. The performance of the H-statistics.
Distribution of H12 and H2/H1 values estimated under the 95% credibility interval of the DGRP admixture model of Duchen et al. [15] for (a) neutrality, (b) soft sweeps, and (c) hard sweeps. Simulations were conducted using 10 kb regions. All panels show the top 50 H12 outliers (black x's) from the empirical Drosophila data set that Garud et al. [10] concluded were soft sweeps. (d) Following their proposed practice, simulations generating the top 2.5% H12 values were ascertained from each set, and the scaled density of the corresponding H2/H1 values are plotted for these H12 outliers. All top 50 empirical outliers fall within the tail of the neutral demographic distribution, as well as within the soft and hard sweep H2/H1 distributions.
Fig 2
Fig 2. The performance of S/HIC.
Stacked bar plots depict the probabilities of model classification by S/HIC. Each vertical bar represents 1000 simulated datasets of each category (where the true models are given on the x-axis in panels a-c (i.e., hard, hard-linked, neutral, soft-linked, and soft)). Within each bar, colors represent the proportion that were assigned to each category by S/HIC, and the red outline indicates the correct classifications (i.e., true positives). (a) The plotted results of S10 Fig of Schrider and Kern [12], examining classification performance under the Tennessen et al. [16] African human demographic model, when the training data assumes an equilibrium model. (b) Results when the strength of selection is mis-specified—both test and training data were simulated under an equilibrium demographic model, where the true dataset is drawn from a moderate selection model (2Ns ~ U[25, 250]) and the training dataset from a strong selection model (2Ns ~ U[250, 2500]). (c) Performance when the simulated LWK population experiences weaker selection (2Ns ~ U[10, 1000]) than the training set (2Ns ~ U[166, 3333]). (d) The classification ratios of the empirical 1000 Genomes project data presented by Schrider and Kern [11] (also depicted in their Fig 2), which they trained upon a history of population size change as interpreted from PSMC by Auton et al. [17]. From left to right on the x-axis, the populations presented are from individuals sampled in North America of Northern and Western European ancestry (CEU), Gambia (GWD), Japan (JPT), Kenya (LWK), Peru (PEL), and Nigeria (YRI).
Fig 3
Fig 3. Interpreting differing levels of sequence variation in patients.
Following Fig 3 of Feder et al. [13], the number of ambiguous sites under different models (their proxy for diversity) are plotted. The y-axis gives the number of ambiguous sites or the percent of ambiguous sites remaining relative to zero drug-resistant mutations (DRMs), and the x-axis the number of drug-resistant mutations DRMs. In panel (a), s = 0.05 and the severity of the treatment induced bottleneck varies, with each colored line giving the census size to which the population was reduced prior to recovery. In panel (b), a non-equilibrium model is shown (a bottleneck size of 103) in which the strength of selection on each DRM is varied, with the colored lines giving the corresponding selection coefficients. Overlaid in black lines are the HIV data presented in Feder et al. [13], with the long dashed line corresponding to two categories of less effective treatments, and the two short dashed lines corresponding to two categories of more effective treatments. As shown, both a simple bottleneck model in which the severity of size reduction is related to the efficacy of the treatment (i.e., less effective treatments have less severe bottlenecks) and a hard sweep model in which the selection coefficient is related to the efficacy of treatment (i.e., more effective treatments are associated with larger selection coefficients), span the observed levels of variation and make it unnecessary to invoke soft selective sweeps.

References

    1. Maynard Smith J, Haigh J. The hitch-hiking effect of a favourable gene. Genet Res. 1974;23: 23 - PubMed
    1. Crisci JL, Poh Y-P, Mahajan S, Jensen JD. The impact of equilibrium assumptions on tests of selection. Front Genet. 2013;4. - PMC - PubMed
    1. Hermisson J, Pennings PS. Soft sweeps: molecular population genetics of adaptation from standing genetic variation. Genetics. 2005;169: 2335–2352. 10.1534/genetics.104.036947 - DOI - PMC - PubMed
    1. Pennings PS, Hermisson J. Soft sweeps III: the signature of positive selection from recurrent mutation. PLoS Genet. 2006;2: e186 10.1371/journal.pgen.0020186 - DOI - PMC - PubMed
    1. Hernandez RD, Kelley JL, Elyashiv E, Melton SC, Auton A, McVean G, et al. Classic selective sweeps were rare in recent human evolution. Science. 2011;331: 920–924. 10.1126/science.1198878 - DOI - PMC - PubMed

Publication types

LinkOut - more resources