

Comparison of automated and retrospectively calculated estimated glomerular filtration rate in electronic health record data
- PMID: 30593275
- PMCID: PMC6311049
- DOI: 10.1186/s12882-018-1179-8
Comparison of automated and retrospectively calculated estimated glomerular filtration rate in electronic health record data
Abstract
Background: Estimated glomerular filtration rate (eGFR) is the clinical standard for assessing kidney function and staging chronic kidney disease. Automated reporting of eGFR using the Modification of Diet in Renal Disease (MDRD) study equation was first implemented within the Department of Veterans Affairs (VA) in 2007 with staggered adoption across laboratories. When automated eGFR are not used or unavailable, values are retrospectively calculated using clinical and demographic data that are currently available in the electronic health record (EHR). Due to the dynamic nature of EHRs, current data may not always match past data. Whether and to what extent the practice of re-calculating eGFR on retrospective data differs from using the automated values is unknown.
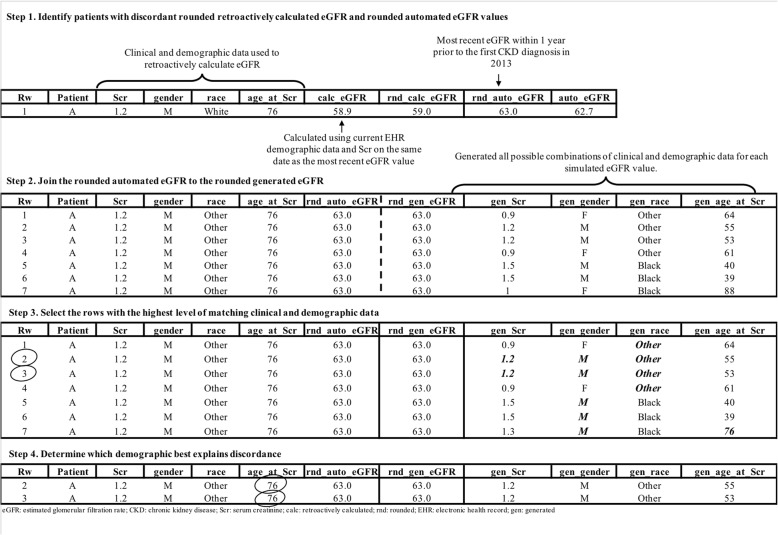
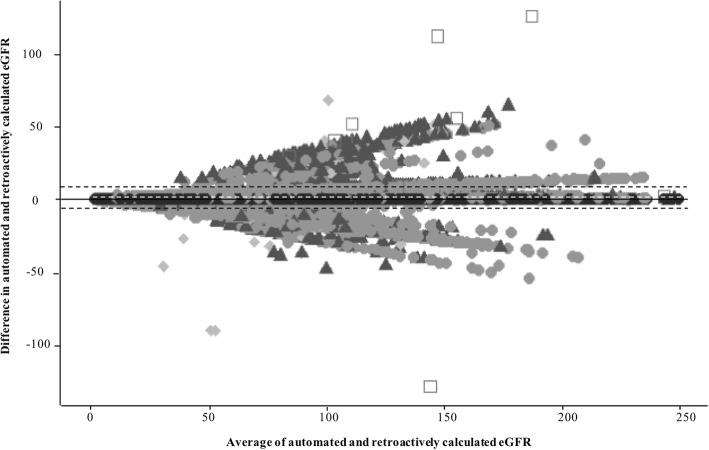
Methods: We assessed clinical data for patients enrolled in VA who had their first automated eGFR lab in 2013.We extracted the eGFR value, the corresponding serum creatinine value, and patient race, gender, and date of birth from the EHR. The MDRD equation was applied to retrospectively calculate eGFR. Stage of chronic kidney disease (CKD) was defined using both eGFR values. We used Bland-Altman plots and percent agreement to assess the difference between the automated and calculated values. We developed an algorithm to select the most parsimonious parameter set to explain the difference in values and used chart review on a small subsample of patients to determine if one approach more accurately describes the patient at the time of eGFR measurement.
Results: We evaluated eGFR data pairs from 266,084 patients. Approximately 33.0% (n = 86,747) of eGFR values differed between automated and retrospectively calculated methods. The majority of discordant pairs were classified as the same CKD stage (n = 74,542, 85.93%). The Bland-Altman plot showed differences in the data pairs were centered near zero (mean difference: 0.8 mL/min/1.73m2) with 95% limits of agreement between - 6.4 and 8.0. A change in recorded age explained 95.6% (n = 78,903) of discordant values and 85.02% (n = 9371) of the discordant stages.
Conclusions: Values of retrospectively calculated eGFR can differ from automated values, but do not always result in a significant classification change. In very large datasets these small differences could become significant.
Conflict of interest statement
Ethics approval and consent to participate
This work was conducted under the approval of the University of Utah’s Institutional Review Board, Salt Lake City, UT (Assurance FWA00003745, IRB_00092652) and was performed with an approved Waiver of Consent.
Consent for publication
Not applicable.
Competing interests
The authors declare that they have no competing interests.
Publisher’s Note
Springer Nature remains neutral with regard to jurisdictional claims in published maps and institutional affiliations.
Figures
Similar articles
-
Comparison Between CKD-EPI Creatinine and MDRD Equations to Estimate Glomerular Filtration Rate in Kidney Transplant Patients.Transplant Proc. 2016 Mar;48(2):625-30. doi: 10.1016/j.transproceed.2016.02.023. Transplant Proc. 2016. PMID: 27110017
-
Evaluation of various equations for estimating renal function in elderly Chinese patients with type 2 diabetes mellitus.Clin Interv Aging. 2017 Oct 9;12:1661-1672. doi: 10.2147/CIA.S140289. eCollection 2017. Clin Interv Aging. 2017. PMID: 29070944 Free PMC article.
-
Recognition of CKD after the introduction of automated reporting of estimated GFR in the Veterans Health Administration.Clin J Am Soc Nephrol. 2014 Jan;9(1):29-36. doi: 10.2215/CJN.02490213. Epub 2013 Oct 31. Clin J Am Soc Nephrol. 2014. PMID: 24178979 Free PMC article.
-
Estimated Glomerular Filtration Rate; Laboratory Implementation and Current Global Status.Adv Chronic Kidney Dis. 2018 Jan;25(1):7-13. doi: 10.1053/j.ackd.2017.09.013. Adv Chronic Kidney Dis. 2018. PMID: 29499890 Review.
-
Uncertainty in measurement: A review of the procedures for determining uncertainty in measurement and its use in deriving the biological variation of the estimated glomerular filtration rate.Pract Lab Med. 2018 Apr 5;12:e00097. doi: 10.1016/j.PLABM.2018.e00097. eCollection 2018 Nov. Pract Lab Med. 2018. PMID: 30050968 Free PMC article. Review.
Cited by
-
Comparative Effectiveness of Allopurinol and Febuxostat in Gout Management.NEJM Evid. 2022 Mar;1(3):10.1056/evidoa2100028. doi: 10.1056/evidoa2100028. Epub 2022 Feb 3. NEJM Evid. 2022. PMID: 35434725 Free PMC article.
References
-
- Levey AS, Coresh J, Bolton K, Culleton B, Harvey KS, Ikizler TA, et al. K/DOQI clinical practice guidelines for chronic kidney disease: evaluation, classification, and stratification. Am J Kidney Dis. 2002;39(2 Suppl 1):S1. - PubMed
-
- Myers GL, Miller WG, Coresh J, Fleming J, Greenberg N, Greene T, et al. Recommendations for improving serum creatinine measurement: a report from the laboratory working Group of the National Kidney Disease Education Program. Clin Chem. 2006;52(1):5–18. doi: 10.1373/clinchem.2005.0525144. - DOI - PubMed
-
- Eknoyan G, Hostetter T, Bakris GL, Hebert L, Levey AS, Parving H-H, et al. Proteinuria and other markers of chronic kidney disease: a position statement of the national kidney foundation (NKF) and the national institute of diabetes and digestive and kidney diseases (NIDDK) Am J Kidney Dis. 2003;42(4):617–622. doi: 10.1016/S0272-6386(03)00826-6. - DOI - PubMed
Publication types
MeSH terms
Substances
LinkOut - more resources
Full Text Sources
Medical
Research Materials
Miscellaneous
