

MPEXS-DNA, a new GPU-based Monte Carlo simulator for track structures and radiation chemistry at subcellular scale
- PMID: 30593679
- PMCID: PMC6850505
- DOI: 10.1002/mp.13370
MPEXS-DNA, a new GPU-based Monte Carlo simulator for track structures and radiation chemistry at subcellular scale
Abstract
Purpose: Track structure simulation codes can accurately reproduce the stochastic nature of particle-matter interactions in order to evaluate quantitatively radiation damage in biological cells such as DNA strand breaks and base damage. Such simulations handle large numbers of secondary charged particles and molecular species created in the irradiated medium. Every particle and molecular species are tracked step-by-step using a Monte Carlo method to calculate energy loss patterns and spatial distributions of molecular species inside a cell nucleus with high spatial accuracy. The Geant4-DNA extension of the Geant4 general-purpose Monte Carlo simulation toolkit allows for such track structure simulations and can be run on CPUs. However, long execution times have been observed for the simulation of DNA damage in cells. We present in this work an improvement of the computing performance of such simulations using ultraparallel processing on a graphical processing unit (GPU).
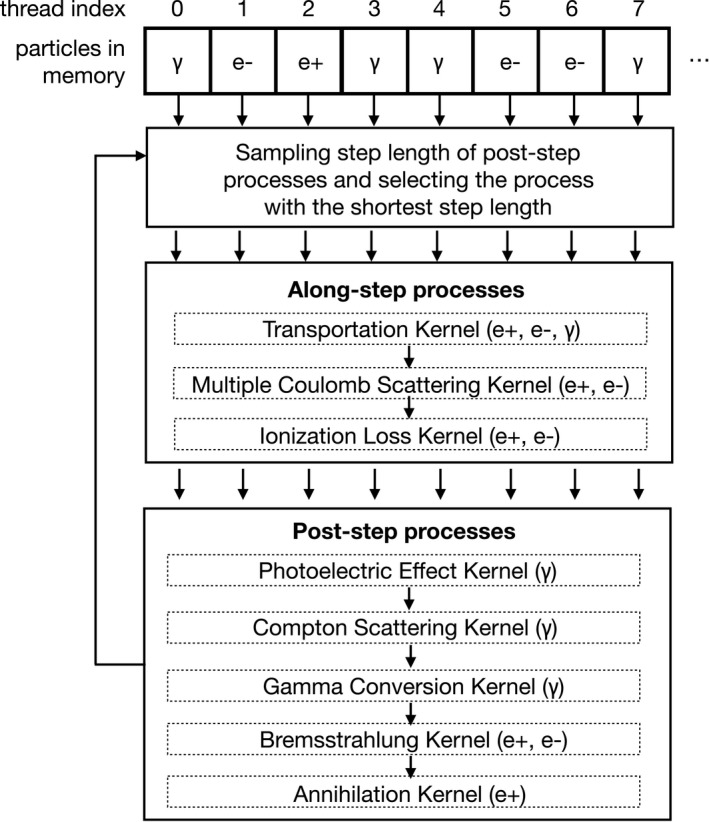
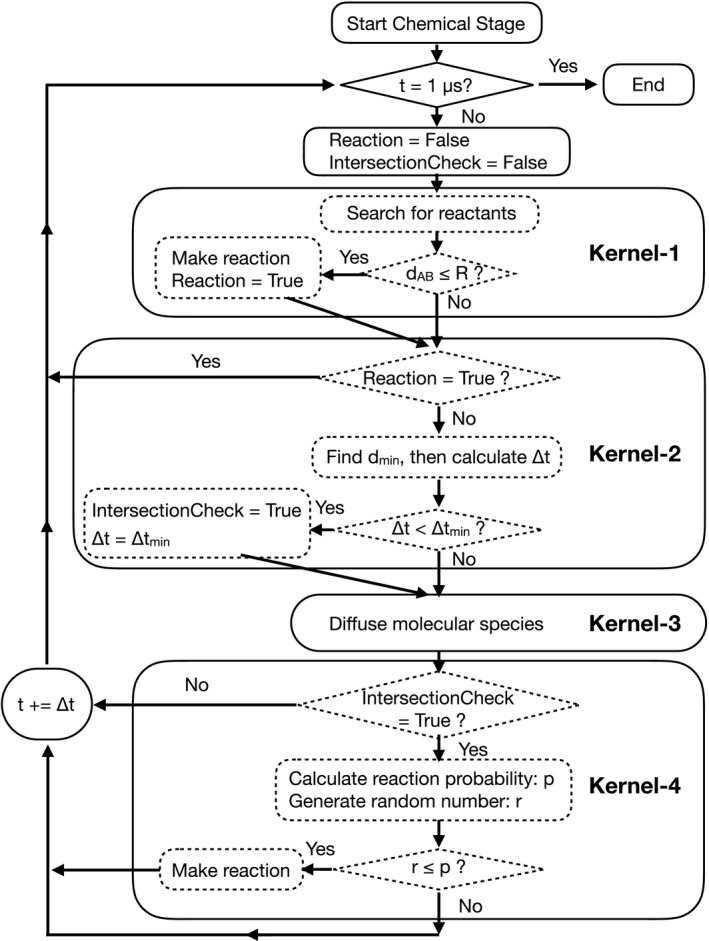
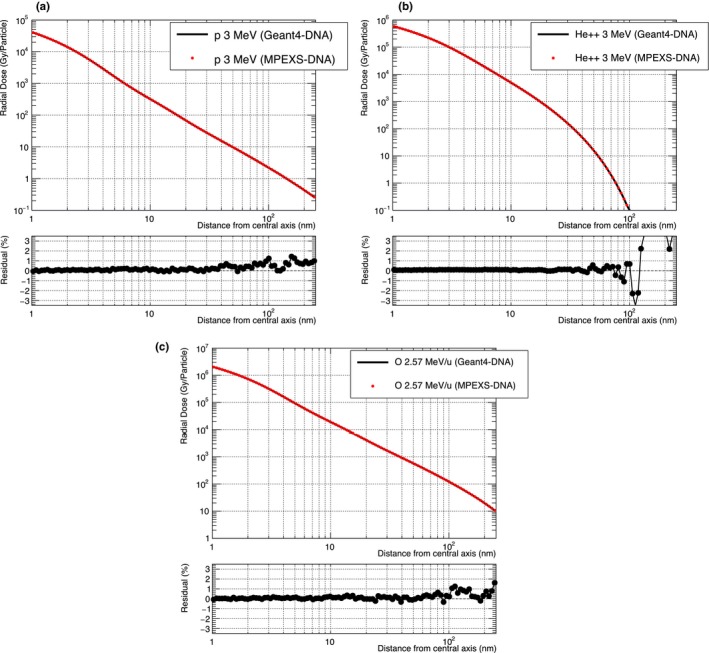
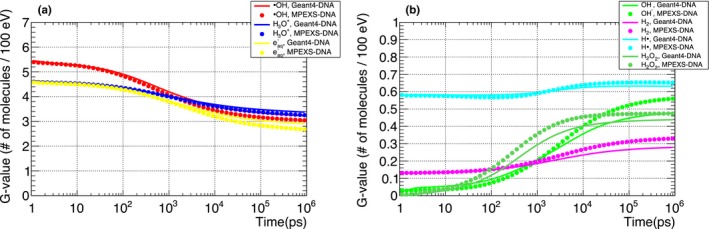
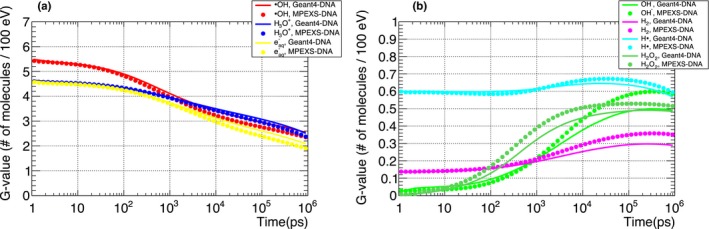
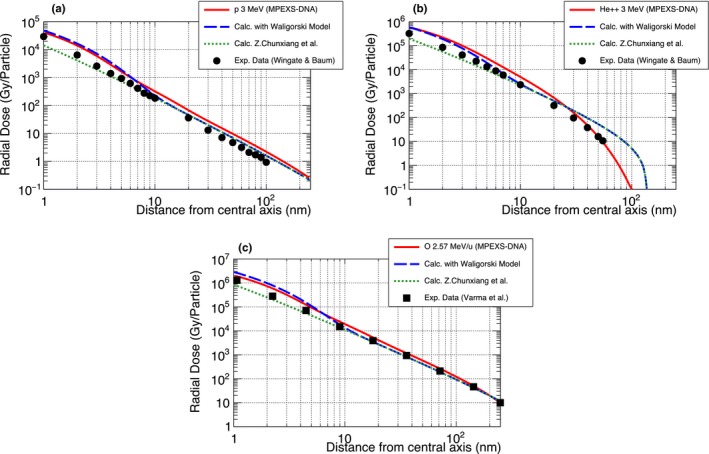
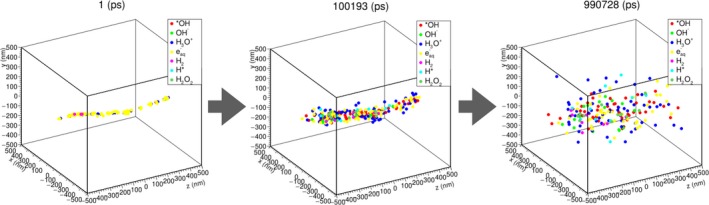
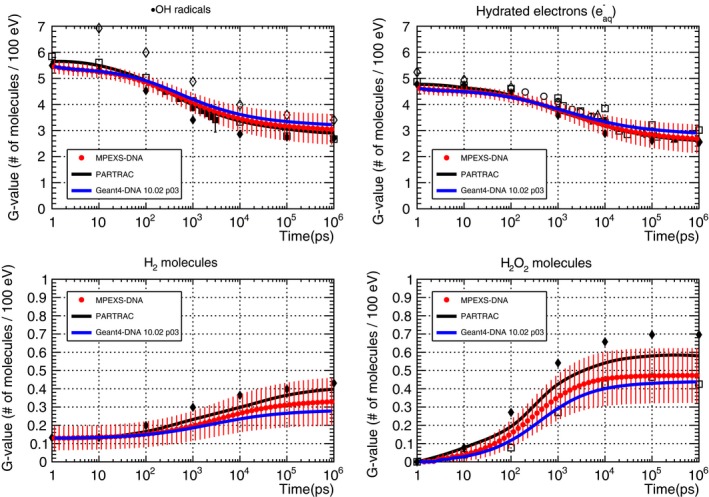
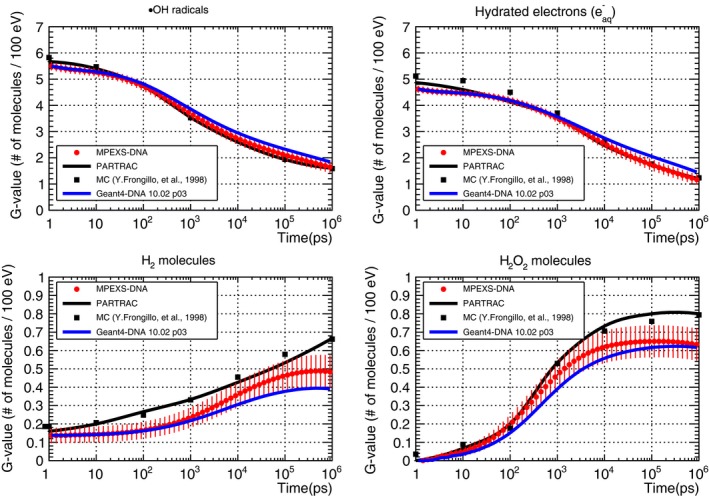
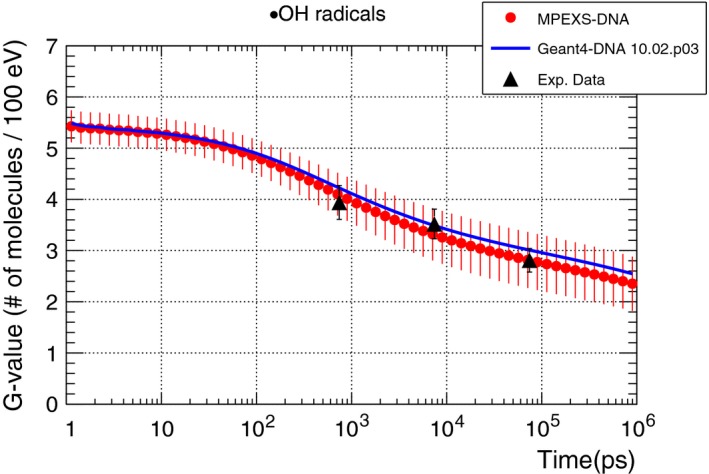
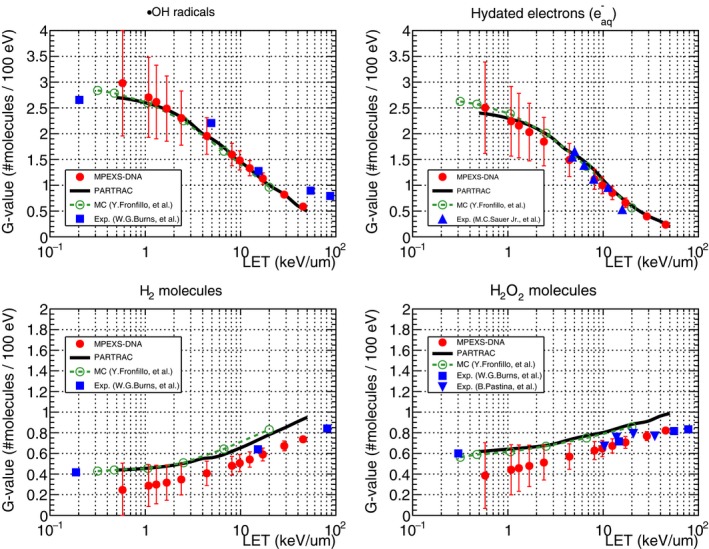
Methods: A new Monte Carlo simulator named MPEXS-DNA, allowing high computing performance by using a GPU, has been developed for track structure and radiolysis simulations at the subcellular scale. MPEXS-DNA physics and chemical processes are based on Geant4-DNA processes available in Geant4 version 10.02 p03. We have reimplemented the Geant4-DNA process codes of the physics stage (electromagnetic processes of charged particles) and the chemical stage (diffusion and chemical reactions for molecular species) for microdosimetry simulation by using the CUDA language. MPEXS-DNA can calculate a distribution of energy loss in the irradiated medium caused by charged particles and also simulate production, diffusion, and chemical interactions of molecular species from water radiolysis to quantitatively assess initial damage to DNA. The validation of MPEXS-DNA physics and chemical simulations was performed by comparing various types of distributions, namely the radial dose distributions for the physics stage, and the G-value profiles for each chemical product and their linear energy transfer dependency for the chemical stage, to existing experimental data and simulation results obtained by other simulation codes, including PARTRAC.
Results: For physics validation, radial dose distributions calculated by MPEXS-DNA are consistent with experimental data and numerical simulations. For chemistry validation, MPEXS-DNA can also reproduce G-value profiles for each molecular species with the same tendency as existing experimental data. MPEXS-DNA also agrees with simulations by PARTRAC reasonably well. However, we have confirmed that there are slight discrepancies in G-value profiles calculated by MPEXS-DNA for molecular species such as H2 and H2 O2 when compared to experimental data and PARTRAC simulations. The differences in G-value profiles between MPEXS-DNA and PARTRAC are caused by the different chemical reactions considered. MPEXS-DNA can drastically boost the computing performance of track structure and radiolysis simulations. By using NVIDIA's GPU devices adopting the Volta architecture, MPEXS-DNA has achieved speedup factors up to 2900 against Geant4-DNA simulations with a single CPU core.
Conclusion: The MPEXS-DNA Monte Carlo simulation achieves similar accuracy to Monte Carlo simulations performed using other codes such as Geant4-DNA and PARTRAC, and its predictions are consistent with experimental data. Notably, MPEXS-DNA allows calculations that are, at maximum, 2900 times faster than conventional simulations using a CPU.
Keywords: CUDA; GPGPU; Geant4-DNA; Monte Carlo simulation; microdosimetry.
© 2018 The Authors Medical Physics published by Wiley Periodicals, Inc. on behalf of American Association of Physicists in Medicine.
Conflict of interest statement
The authors have no relevant conflicts of interest to disclose.
Figures
References
-
- Incerti S, Douglass M, Penfold S, Guatelli S, Bezak E. Review of Geant4‐DNA applications for micro and nanoscale simulations. Phys Med. 2016;32:1187–1200. - PubMed
-
- Agostinelli S, Allison J, Amako K, et al. Geant4 – a simulation toolkit. Nucl Instrum Methods Phys Res A. 2003;506:250–303.
-
- Allison J, Amako K, Apostolakis J, et al. Geant4 developments and applications. IEEE Trans Nucl Sci. 2006;53:270–278.
-
- Allison J, Amako K, Apostolakis J, et al. Recent developments in Geant4. Nucl Instrum Methods Phys Res, Sect A. 2016;835:186–225.
-
- Bernal MA, Bordage MC, Brown JMC, et al. Track structure modeling in liquid water: a review of the Geant4‐DNA very low energy extension of the Geant4 Monte Carlo simulation toolkit. Phys Med. 2015;31:861–874. - PubMed
MeSH terms
Substances
Grants and funding
LinkOut - more resources
Full Text Sources
