

Genomics of body fat percentage may contribute to sex bias in anorexia nervosa
- PMID: 30593698
- PMCID: PMC6751355
- DOI: 10.1002/ajmg.b.32709
Genomics of body fat percentage may contribute to sex bias in anorexia nervosa
Abstract
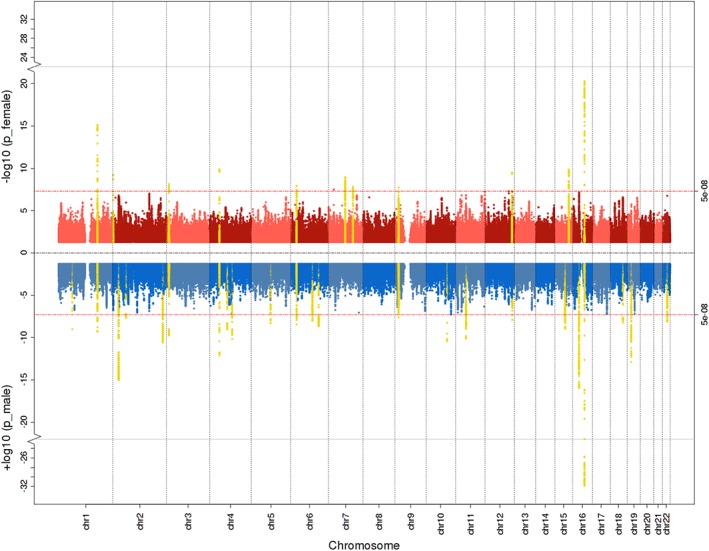
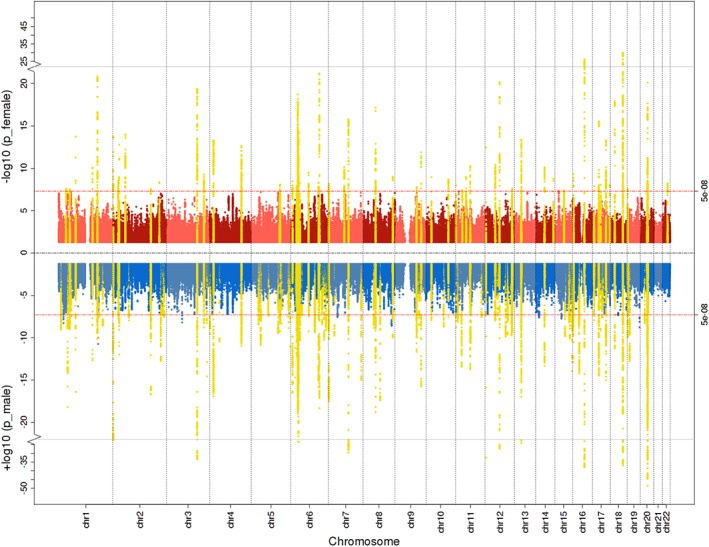
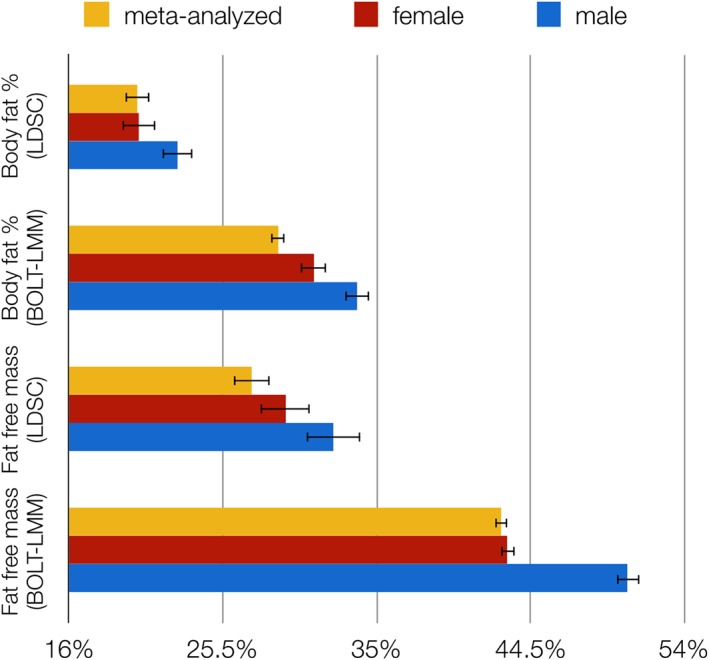
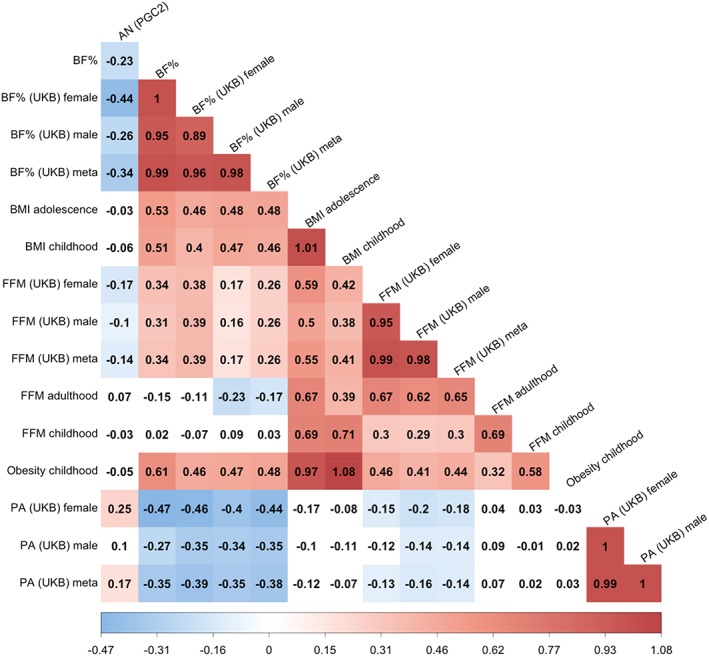
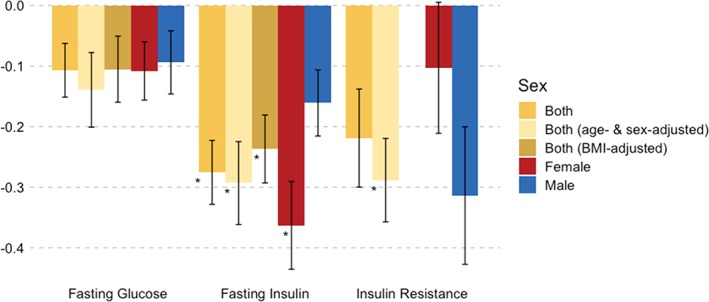
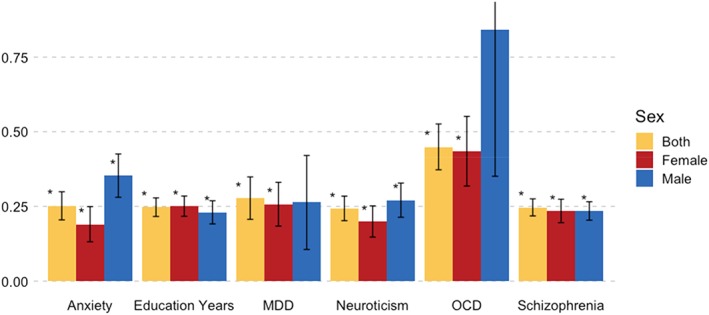
Anorexia nervosa (AN) occurs nine times more often in females than in males. Although environmental factors likely play a role, the reasons for this imbalanced sex ratio remain unresolved. AN displays high genetic correlations with anthropometric and metabolic traits. Given sex differences in body composition, we investigated the possible metabolic underpinnings of female propensity for AN. We conducted sex-specific GWAS in a healthy and medication-free subsample of the UK Biobank (n = 155,961), identifying 77 genome-wide significant loci associated with body fat percentage (BF%) and 174 with fat-free mass (FFM). Partitioned heritability analysis showed an enrichment for central nervous tissue-associated genes for BF%, which was more prominent in females than males. Genetic correlations of BF% and FFM with the largest GWAS of AN by the Psychiatric Genomics Consortium were estimated to explore shared genomics. The genetic correlations of BF%male and BF%female with AN differed significantly from each other (p < .0001, δ = -0.17), suggesting that the female preponderance in AN may, in part, be explained by sex-specific anthropometric and metabolic genetic factors increasing liability to AN.
Keywords: GWAS; eating disorder; fat-free mass; female; genetic correlation; shared genetics.
© 2018 The Authors. American Journal of Medical Genetics Part B: Neuropsychiatric Genetics published by Wiley Periodicals, Inc.
Figures
References
-
- Achamrah, N. , Coëffier, M. , & Déchelotte, P. (2016). Physical activity in patients with anorexia nervosa. Nutrition Reviews, 74(5), 301–311. - PubMed
-
- Allen, N. E. , Sudlow, C. , Peakman, T. , Collins, R. , & UK Biobank . (2014). UK Biobank data: Come and get it. Science Translational Medicine, 6(224), 224ed4. - PubMed
-
- American Psychiatric Association . (2013). Diagnostic and statistical manual of mental disorders (5th ed). Washington, DC: American Psychiatric Association.
-
- Bakalar, J. L. , Shank, L. M. , Vannucci, A. , Radin, R. M. , & Tanofsky‐Kraff, M. (2015). Recent advances in developmental and risk factor research on eating disorders. Current Psychiatry Reports, 17(6), 42. - PubMed
Publication types
MeSH terms
Grants and funding
- TR130505/Maudsley Charity/International
- U01 MH109532/MH/NIMH NIH HHS/United States
- 109863/Z/15/Z/WT_/Wellcome Trust/United Kingdom
- MR/N015746/1/MRC_/Medical Research Council/United Kingdom
- Klarman Family Foundation/International
- MC_QA137853/MRC_/Medical Research Council/United Kingdom
- MR/N015746/1/UK Medical Research Council/International
- R01 MH085801/MH/NIMH NIH HHS/United States
- U01 MH109536/MH/NIMH NIH HHS/United States
- Eunice Kennedy Shriver National Institute of Child Health and Human Development/International
- U01 MH109514/MH/NIMH NIH HHS/United States
- WT_/Wellcome Trust/United Kingdom
- R01 HD057194/HD/NICHD NIH HHS/United States
- 109863/Z/15/Z/WT_/Wellcome Trust/United Kingdom
- MC_PC_17228/MRC_/Medical Research Council/United Kingdom
- National Institute for Health Research/International
- Swedish Research Council/International
- P2C HD050924/HD/NICHD NIH HHS/United States
- South London and Maudsley NHS Foundation Trust/International
- Dnr: 538-2013-8864/Vetenskapsrådet/International
- U01 MH109528/MH/NIMH NIH HHS/United States
- 980/Maudsley Charity/International
- R21 MH115397/MH/NIMH NIH HHS/United States
LinkOut - more resources
Full Text Sources
Other Literature Sources
Miscellaneous
