. 2019 Mar;189(3):648-664.
doi: 10.1016/j.ajpath.2018.11.019. Epub 2018 Dec 26.

Peroxisome Proliferator-Activated Receptor-γ Knockdown Impairs Bone Morphogenetic Protein-2-Induced Critical-Size Bone Defect Repair

Affiliations

Peroxisome Proliferator-Activated Receptor-γ Knockdown Impairs Bone Morphogenetic Protein-2-Induced Critical-Size Bone Defect Repair

Chenchao Wang et al. Am J Pathol. 2019 Mar.

Abstract

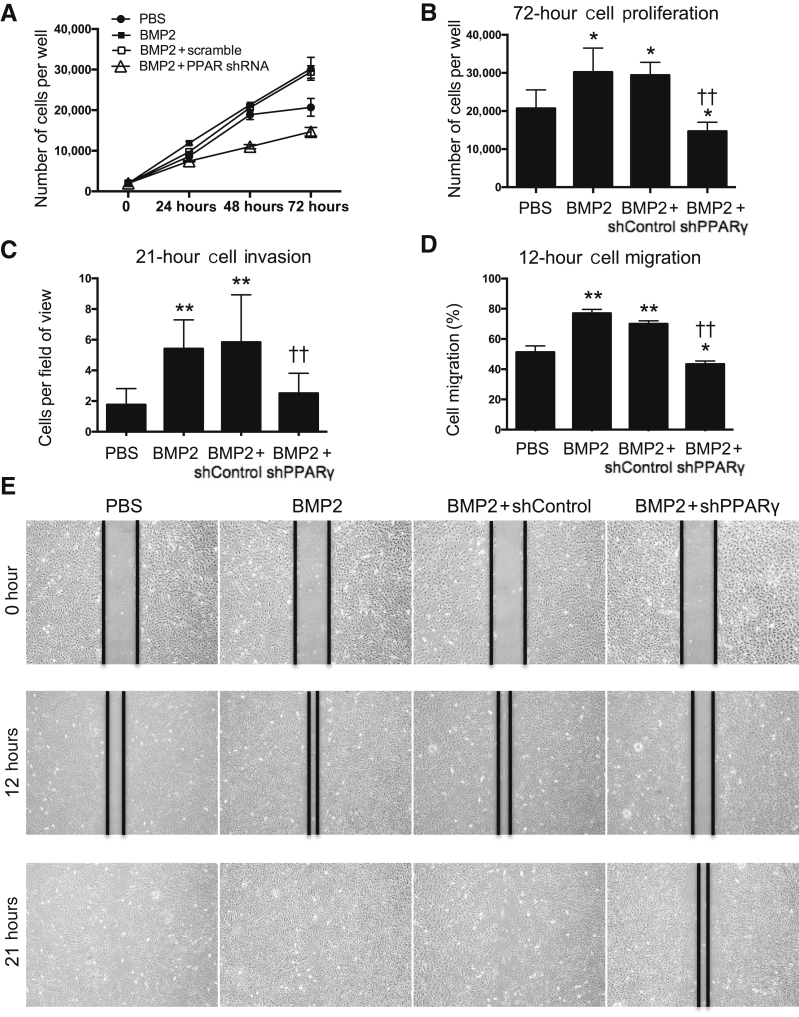
The Food and Drug Administration-approved clinical dose (1.5 mg/mL) of bone morphogenetic protein-2 (BMP2) has been reported to induce significant adverse effects, including cyst-like adipose-infiltrated abnormal bone formation. These undesirable complications occur because of increased adipogenesis, at the expense of osteogenesis, through BMP2-mediated increases in the master regulatory gene for adipogenesis, peroxisome proliferator-activated receptor-γ (PPARγ). Inhibiting PPARγ during osteogenesis has been suggested to drive the differentiation of bone marrow stromal/stem cells toward an osteogenic, rather than an adipogenic, lineage. We demonstrate that knocking down PPARγ while concurrently administering BMP2 can reduce adipogenesis, but we found that it also impairs BMP2-induced osteogenesis and leads to bone nonunion in a mouse femoral segmental defect model. In addition, in vitro studies using the mouse bone marrow stromal cell line M2-10B4 and mouse primary bone marrow stromal cells confirmed that PPARγ knockdown inhibits BMP2-induced adipogenesis; attenuates BMP2-induced cell proliferation, migration, invasion, and osteogenesis; and escalates BMP2-induced cell apoptosis. More important, BMP receptor 2 and 1B expression was also significantly inhibited by the combined BMP2 and PPARγ knockdown treatment. These findings indicate that PPARγ is critical for BMP2-mediated osteogenesis during bone repair. Thus, uncoupling BMP2-mediated osteogenesis and adipogenesis using PPARγ inhibition to combat BMP2's adverse effects may not be feasible.


Figures

Figure 1
Figure 1
Large doses of BMP2 induce cystic bone formation in mouse femoral segmental defects (FSDs) 8 weeks after surgery. A: Schematic of the FSD surgical procedure. B: Intraoperative image of the FSD procedure with polyether ether ketone plate and cylindrical poly(lactic-co-glycolic acid) scaffold placement. C: Microcomputed tomography (microCT) and biomechanical evaluation. From top to bottom, two-dimensional (2D) radiography, sagittal sectioning, axial sectioning, density distribution [color indicates bone mineral density value, ranging from 0.217 (yellow) to 1.282 (blue) g/cm3], and three-dimensional (3D) reconstructed microCT images. The treatment groups were PBS, BMP2, BMP2 + shControl, and BMP2 + shPPARγ. Green boxed areas indicate the region of interest selected for 3D microCT reconstruction. Red boxed areas indicate the region of interest selected for microCT quantification in D. D: MicroCT quantification of bone volume/tissue volume (BV/TV) and trabecular number (Tb.N). Data are expressed as means ± SD. ∗∗∗P < 0.005 versus the PBS group; P < 0.05, †††P < 0.005 versus the BMP2 + shControl group. Scale bar = 5 mm (C).
Figure 2
Figure 2
Histologic evaluation of BMP2 + shPPARγ cotreated femoral segmental defect femurs reveals decreased osteogenesis and adipogenesis 8 weeks after surgery. A: Hematoxylin and eosin (H&E) staining reveals bone union and the cystic bone formation (a large extension of bone that extends beyond the original defect margins surrounded by thin cortical bone) induced by large doses of BMP2. BMP2 + shPPARγ cotreated samples experience bone nonunion, with newly formed bone confined to the defect sites, defect margins that remodeled to form square caps, and unabsorbed poly(lactic-co-glycolic acid) scaffolds that were located between the two caps. Insets show regions at lower magnification. B: Masson's trichrome staining reveals fibrous tissue (light blue) in the control samples, abundant adipocytes (large white droplets) in the BMP2 samples, and osteoid matrix (dark blue) ossifying into mature trabecular bone (red) in the BMP2 + shPPARγ cotreated samples. C: Osteocalcin (OCN) immunohistochemical (IHC) analysis. Arrows indicate positive OCN staining. D: PPARγ IHC analysis. E: Histomorphometric analyses are based on H&E staining. Bone volume/tissue volume (BV/TV) and trabecular number (Tb.N) are shown. F and G: Quantification of OCN (F) and PPARγ (G) IHC analysis. All fold-changes are reported relative to the PBS control group. Data are expressed as means ± SD. ∗∗∗P < 0.005 versus the PBS group; †††P < 0.005 versus the BMP2 + shControl group. Scale bars: 5 mm (A); 1 mm (B); 0.1 mm (C and D). Def, boundaries and extent of the defect area.
Figure 3
Figure 3
PPARγ deletion leads to decreased osteogenesis. A: Immunohistochemical (IHC) staining of an early osteoblastic marker (Runx2). B: Real-time PCR analysis of runt related transcription factor (Runx) 2, alkaline phosphatase (ALP), osteocalcin (OCN), and PPARγ expression in M2 cell line cells treated with PBS, 300 ng/mL BMP2, BMP2 + shPPARγ (using a stable transfected M2 cell line that had a 90% knockdown of PPARγ, which was selected from PPARγ shRNA transfected colonies), or BMP2 + shControl (using a stable M2 cell line selected from control shRNA transfected colonies) for 3, 6, and 9 days. All fold-changes are reported relative to the PBS control group. C: Alizarin Red staining to determine mineralization in M2 cells treated with PBS, 300 ng/mL BMP2, BMP2 + shPPARγ, or BMP2 + shControl for 21 days. Insets show representative images of Alizarin Red staining of a whole well at lower magnification. D: Quantification of Runx2 IHC analysis. E: Quantification of Alizarin Red staining intensity. F: Real-time PCR analysis of Runx2 and PPARγ expression in mouse primary bone marrow stromal cells treated with PBS, BMP2, BMP2 + shPPARγ, or BMP2 + shControl for 3 days. All fold-changes are reported relative to the PBS control group. Data are expressed as means ± SD. P < 0.05, ∗∗P < 0.01, and ∗∗∗P < 0.005 versus the PBS group; P < 0.05, ††P < 0.01, and †††P < 0.005 versus the BMP2 + shControl group. Scale bars: 0.1 mm (A); 0.2 mm (C).
Figure 4
Figure 4
PPARγ repression results in reduced bone marrow stromal cell proliferation, migration, and differentiation that are typically induced by BMP2. A: MTT assay of M2 cells treated with PBS, 300 ng/mL BMP2, BMP2 + shPPARγ (using a stable transfected M2 cell line that had a 90% knockdown of PPARγ, which was selected from PPARγ shRNA transfected colonies), or BMP2 + shControl (using a stable M2 cell line selected from control shRNA transfected colonies). B: Quantification of viable cells after 72 hours. C: Transwell invasion assay of M2 cells conducted after 21 hours. D: M2 cell wound-healing assay after 12 hours. E: Migration was quantified by measuring the average wound gap between the wound edges before and after treatment. The black lines were drawn along the edges of the wounds at indicated time points. The percentage of cells that migrated at 12 hours was calculated as follows: Cell Migration (%) = [(Gap0h – Gap12h)/Gap0h] × 100. Data are expressed as means ± SD. P < 0.05, ∗∗P < 0.01 versus the PBS group; ††P < 0.01 versus the BMP2 + shControl group. Original magnification, ×4 (E).
Figure 5
Figure 5
PPARγ knockdown escalates BMP2-induced cell apoptosis. A: Flow cytometry analysis of M2 cell apoptosis. M2 cells treated with PBS, 300 ng/mL BMP2, or BMP2 + shPPARγ (using a stable transfected M2 cell line that had a 90% knockdown of PPARγ, which was selected from PPARγ shRNA transfected colonies), or BMP2 + shControl (using a stable M2 cell line selected from control shRNA transfected colonies) for 3 days and subjected to flow cytometry testing. B: Quantification of apoptotic cells. All fold-changes are reported relative to the PBS group. Data are expressed as means ± SD. ∗∗∗P < 0.005 versus the PBS group; †††P < 0.005 versus the BMP2 + shControl group. FITC, fluorescein isothiocyanate; PI-A, propidium iodide–active; Q, quadrant.
Figure 6
Figure 6
PPARγ inhibition leads to reduced BMP receptor 2 (BMPR2) expression. A: Immunohistochemical (IHC) staining of BMPR2. B: Quantification of IHC analysis of BMPR2. C: Real-time PCR analysis of BMPR2 mRNA expression in M2 cells treated with PBS, 300 ng/mL BMP2, BMP2 + shPPARγ (using a stable transfected M2 cell line that had a 90% knockdown of PPARγ, which was selected from PPARγ shRNA transfected colonies), or BMP2 + shControl (using a stable M2 cell line selected from control shRNA transfected colonies) for 3, 6, and 9 days. D: Real-time PCR analysis of BMPR2 mRNA expression in mouse primary bone marrow stromal cells (BMSCs) treated with PBS, BMP2, BMP2 + shPPARγ, or BMP2 + shControl for 3 days. E: Flow cytometry analysis of BMPR2 expression on mouse primary BMSCs. PBS, 600 μg/mL BMP2, BMP2 + PPARγ shRNA (1 × 107 plaque-forming units/mL; multiplicity of infection = 10), or BMP2 + shControl treatments were injected into Axin2+/− mouse femur cavities. BMSCs were isolated and subjected to flow cytometry test on day 3 after injection. F: Quantification of flow cytometry analysis of BMPR2-expressing mouse primary BMSCs among different treatment groups. All fold-changes are reported relative to the PBS group. Data are expressed as means ± SD. n = 6 per group (E). P < 0.05, ∗∗P < 0.01, and ∗∗∗P < 0.005 versus the PBS group; P < 0.05, ††P < 0.01 versus the BMP2 + shControl group. Scale bar = 0.1 mm (A). P2, negative area.

References

    1. Giannoudis P.V., Dinopoulos H., Tsiridis E. Bone substitutes: an update. Injury. 2005;36 Suppl 3:S20–S27. - PubMed
    1. Yelin E.H., Trupin L.S., Sebesta D.S. Transitions in employment, morbidity, and disability among persons ages 51-61 with musculoskeletal and non-musculoskeletal conditions in the US, 1992-1994. Arthritis Rheum. 1999;42:769–779. - PubMed
    1. Alt V., Borgman B., Eicher A., Heiss C., Kanakaris N.K., Giannoudis P.V., Song F. Effects of recombinant human bone morphogenetic protein-2 (rhBMP-2) in grade III open tibia fractures treated with unreamed nails: a clinical and health-economic analysis. Injury. 2015;46:2267–2272. - PubMed
    1. Garrison K.R., Donell S., Ryder J., Shemilt I., Mugford M., Harvey I., Song F. Clinical effectiveness and cost-effectiveness of bone morphogenetic proteins in the non-healing of fractures and spinal fusion: a systematic review. Health Technol Assess. 2007;11:1–150. iii-iv. - PubMed
    1. Mendoza M.C., Sonn K.A., Kannan A.S., Bellary S.S., Mitchell S.M., Singh G., Park C., Yun C., Stock S.R., Hsu E.L., Hsu W.K. The effect of vancomycin powder on bone healing in a rat spinal rhBMP-2 model. J Neurosurg Spine. 2016;25:147–153. - PubMed

Publication types

MeSH terms