

Maximising BOLD sensitivity through automated EPI protocol optimisation
- PMID: 30593904
- PMCID: PMC6435104
- DOI: 10.1016/j.neuroimage.2018.12.052
Maximising BOLD sensitivity through automated EPI protocol optimisation
Abstract
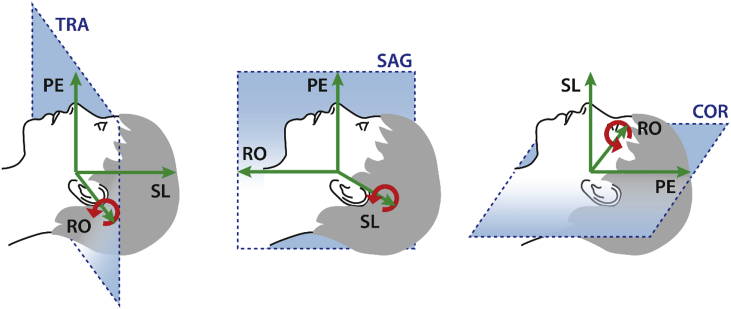
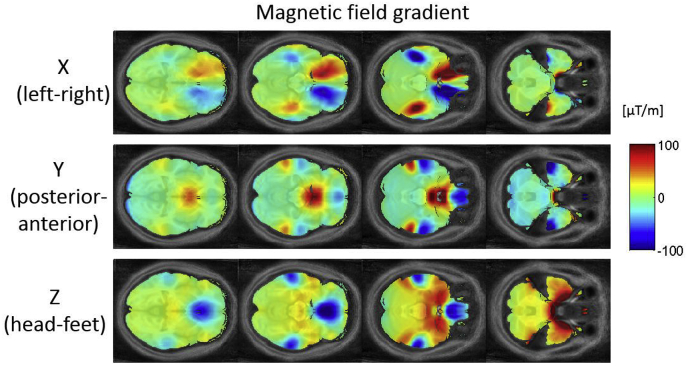
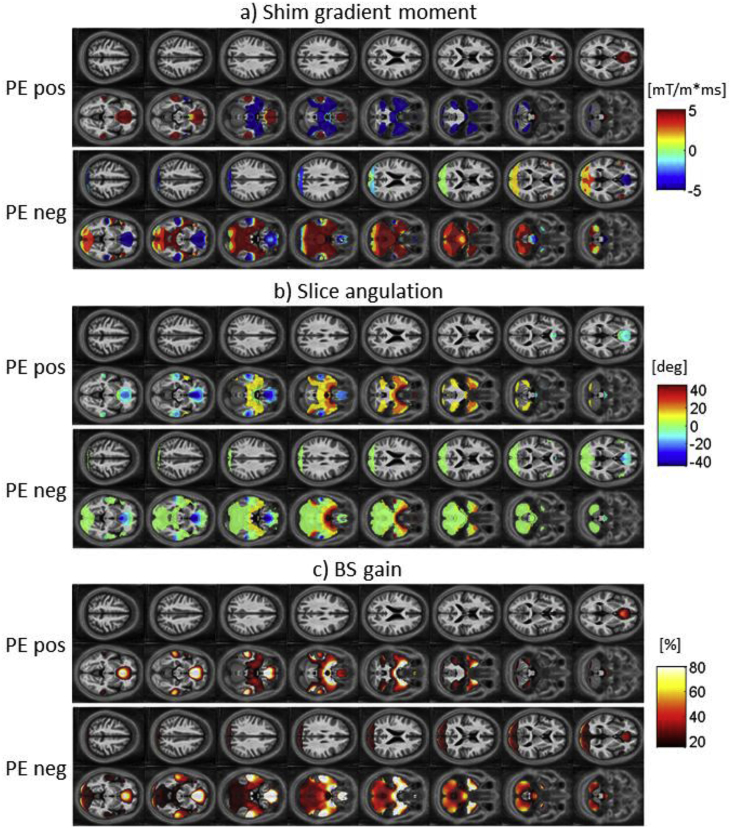
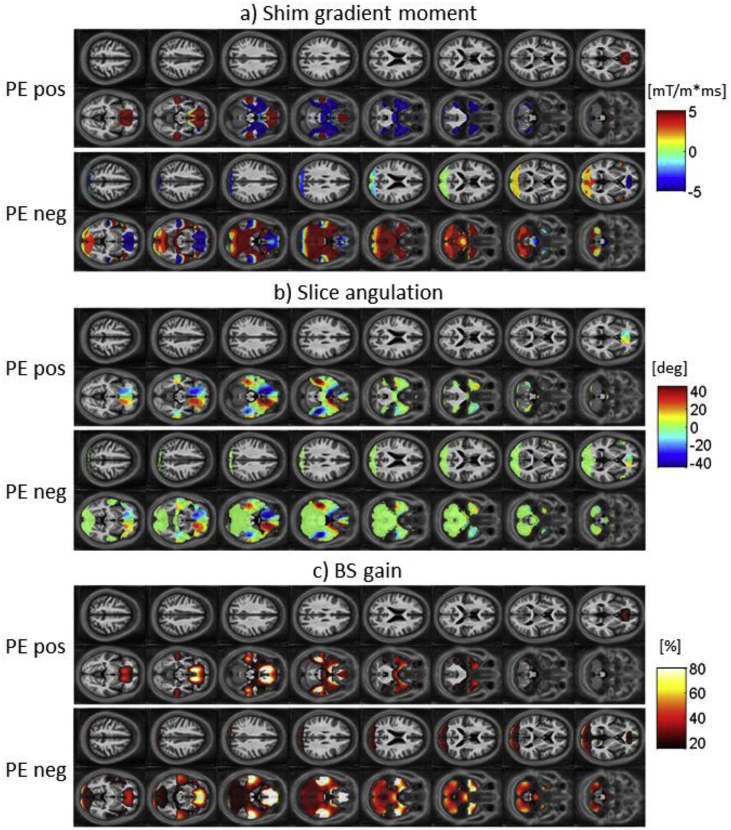
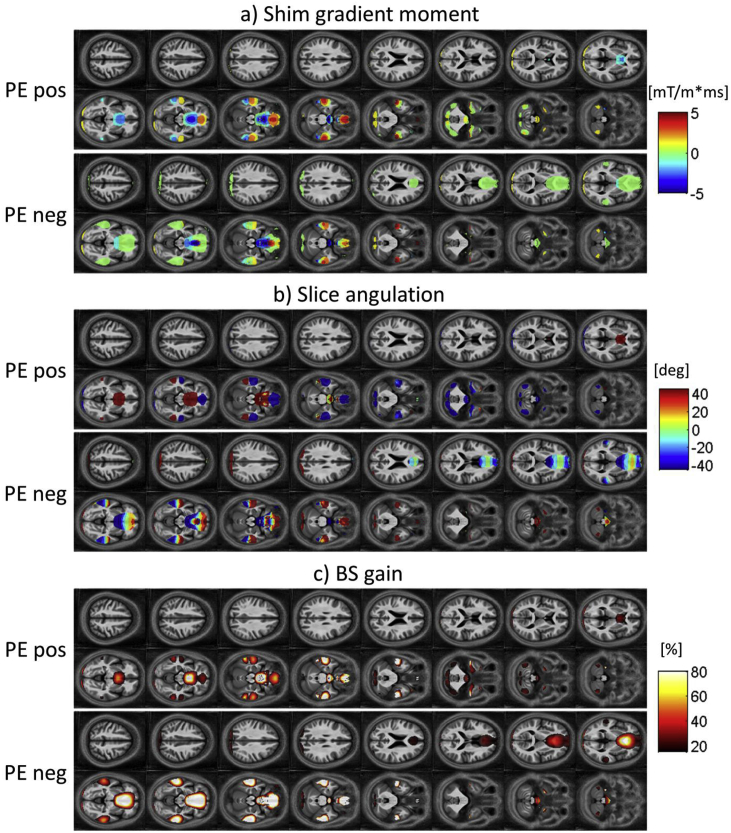
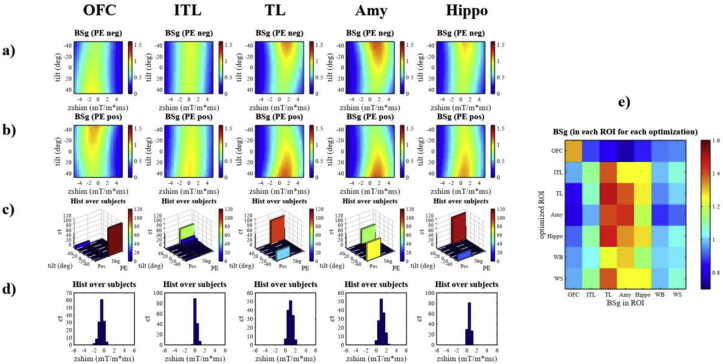
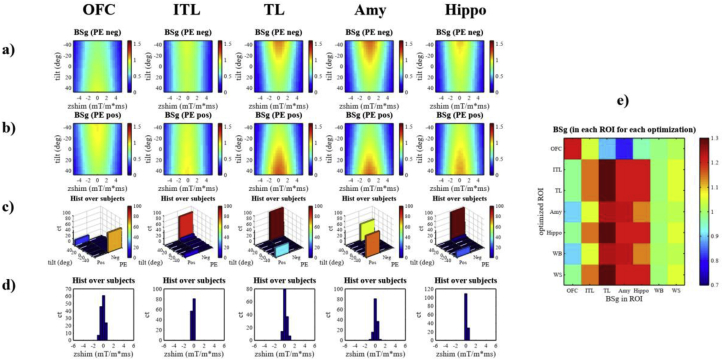
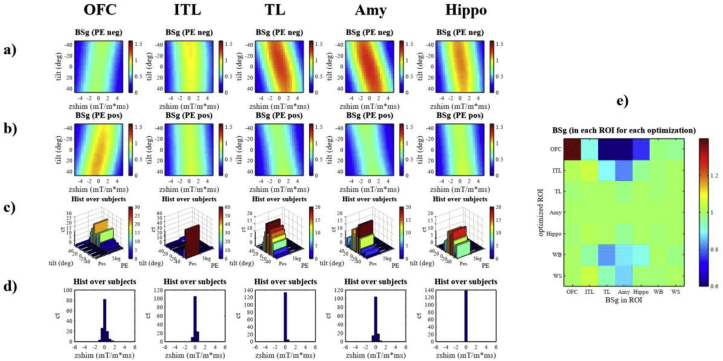
Gradient echo echo-planar imaging (GE EPI) is used for most fMRI studies but can suffer substantially from image distortions and BOLD sensitivity (BS) loss due to susceptibility-induced magnetic field inhomogeneities. While there are various post-processing methods for correcting image distortions, signal dropouts cannot be recovered and therefore need to be addressed at the data acquisition stage. Common approaches for reducing susceptibility-related BS loss in selected brain areas are: z-shimming, inverting the phase encoding (PE) gradient polarity, optimizing the slice tilt and increasing spatial resolution. The optimization of these parameters can be based on atlases derived from multiple echo-planar imaging (EPI) acquisitions. However, this requires resource and time, which imposes a practical limitation on the range over which parameters can be optimised meaning that the chosen settings may still be sub-optimal. To address this issue, we have developed an automated method that can be used to optimize across a large parameter space. It is based on numerical signal simulations of the BS loss predicted by physical models informed by a large database of magnetic field (B0) maps acquired on a broad cohort of participants. The advantage of our simulation-based approach compared to previous methods is that it saves time and expensive measurements and allows for optimizing EPI protocols by incorporating a broad range of factors, including different resolutions, echo times or slice orientations. To verify the numerical optimisation, results are compared to those from an earlier study and to experimental BS measurements carried out in six healthy volunteers.
Copyright © 2019 The Authors. Published by Elsevier Inc. All rights reserved.
Figures
Similar articles
-
Optimal EPI parameters for reduction of susceptibility-induced BOLD sensitivity losses: a whole-brain analysis at 3 T and 1.5 T.Neuroimage. 2006 Nov 1;33(2):493-504. doi: 10.1016/j.neuroimage.2006.07.029. Epub 2006 Sep 7. Neuroimage. 2006. PMID: 16959495
-
Dynamic multi-coil technique (DYNAMITE) shimming for echo-planar imaging of the human brain at 7 Tesla.Neuroimage. 2015 Jan 15;105:462-72. doi: 10.1016/j.neuroimage.2014.11.011. Epub 2014 Nov 8. Neuroimage. 2015. PMID: 25462795 Free PMC article.
-
Application of an integrated radio-frequency/shim coil technology for signal recovery in fMRI.Magn Reson Med. 2021 Dec;86(6):3067-3081. doi: 10.1002/mrm.28925. Epub 2021 Jul 20. Magn Reson Med. 2021. PMID: 34288086 Free PMC article.
-
Variable slice thickness (VAST) EPI for the reduction of susceptibility artifacts in whole-brain GE-EPI at 7 Tesla.MAGMA. 2017 Dec;30(6):591-607. doi: 10.1007/s10334-017-0641-0. Epub 2017 Jul 10. MAGMA. 2017. PMID: 28695398
-
Real-time feedback optimization of z-shim gradient for automatic compensation of susceptibility-induced signal loss in EPI.Neuroimage. 2011 Apr 15;55(4):1587-92. doi: 10.1016/j.neuroimage.2011.01.045. Epub 2011 Jan 20. Neuroimage. 2011. PMID: 21256230
Cited by
-
Automated slice-specific z-shimming for functional magnetic resonance imaging of the human spinal cord.Hum Brain Mapp. 2022 Dec 15;43(18):5389-5407. doi: 10.1002/hbm.26018. Epub 2022 Aug 8. Hum Brain Mapp. 2022. PMID: 35938527 Free PMC article.
-
Adaptive slice-specific z-shimming for 2D spoiled gradient-echo sequences.Magn Reson Med. 2021 Feb;85(2):818-830. doi: 10.1002/mrm.28468. Epub 2020 Sep 10. Magn Reson Med. 2021. PMID: 32909334 Free PMC article.
-
Forming cognitive maps for abstract spaces: the roles of the human hippocampus and orbitofrontal cortex.Commun Biol. 2024 May 1;7(1):517. doi: 10.1038/s42003-024-06214-5. Commun Biol. 2024. PMID: 38693344 Free PMC article.
-
Mitigating susceptibility-induced distortions in high-resolution 3DEPI fMRI at 7T.Neuroimage. 2023 Oct 1;279:120294. doi: 10.1016/j.neuroimage.2023.120294. Epub 2023 Jul 29. Neuroimage. 2023. PMID: 37517572 Free PMC article.
-
Frequency dependent emotion differentiation and directional coupling in amygdala, orbitofrontal and medial prefrontal cortex network with intracranial recordings.Mol Psychiatry. 2023 Apr;28(4):1636-1646. doi: 10.1038/s41380-022-01883-2. Epub 2022 Dec 2. Mol Psychiatry. 2023. PMID: 36460724 Free PMC article.
References
Publication types
MeSH terms
Grants and funding
LinkOut - more resources
Full Text Sources
