. 2019 Jan 10;176(1-2):348-360.e12.
doi: 10.1016/j.cell.2018.11.045. Epub 2018 Dec 27.

Gene Regulatory Programs Conferring Phenotypic Identities to Human NK Cells

Affiliations

Gene Regulatory Programs Conferring Phenotypic Identities to Human NK Cells

Patrick L Collins et al. Cell. .

Abstract

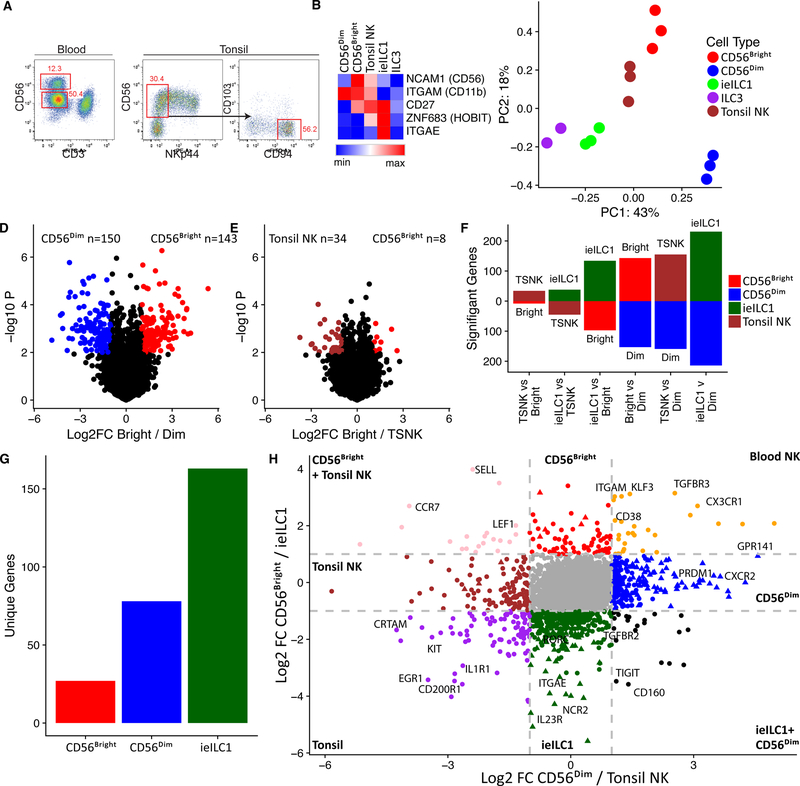
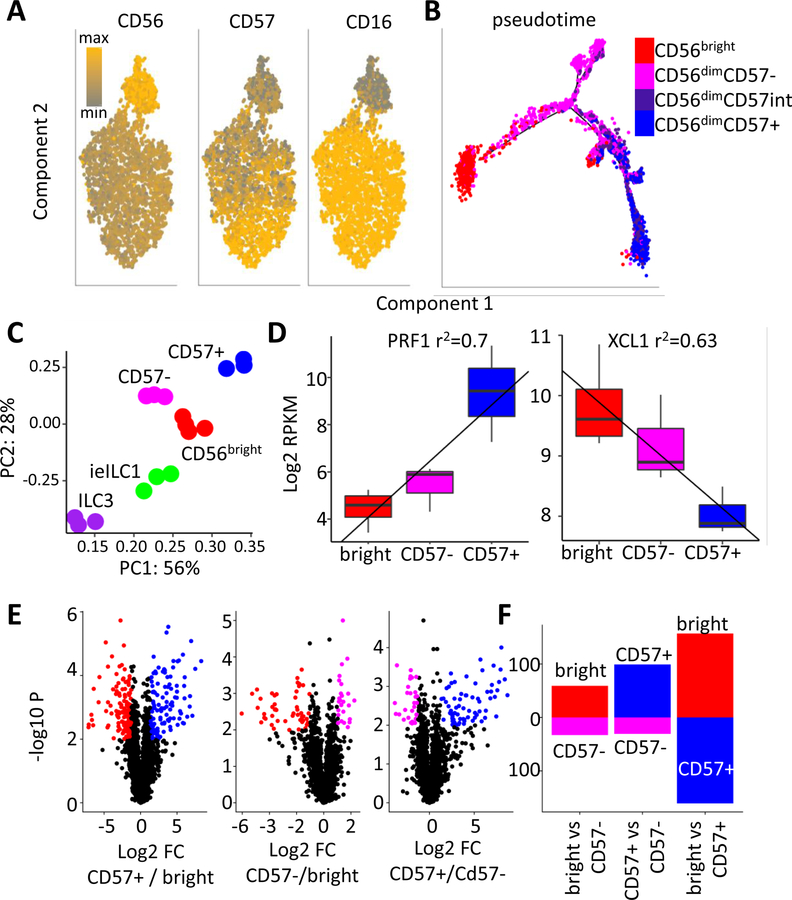
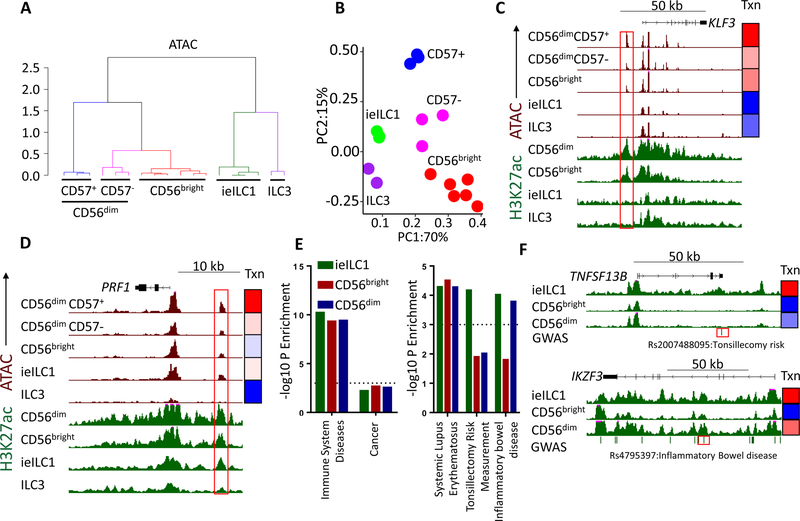
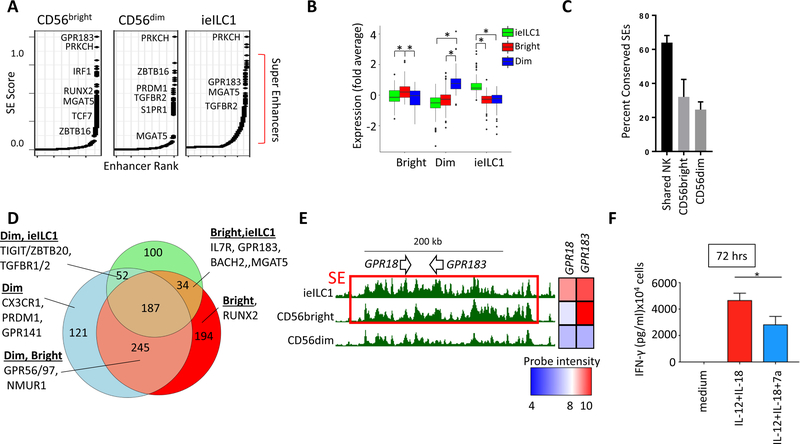
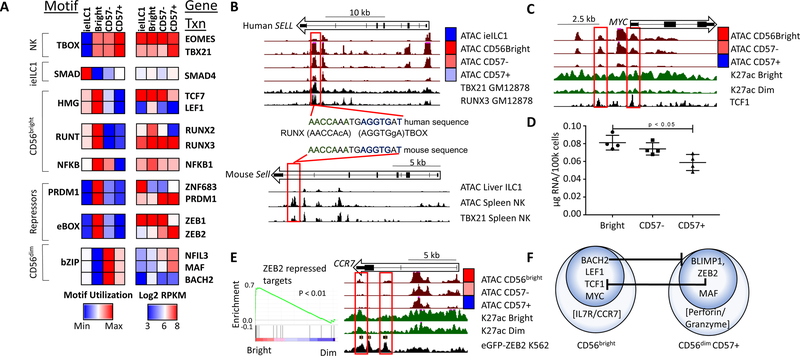
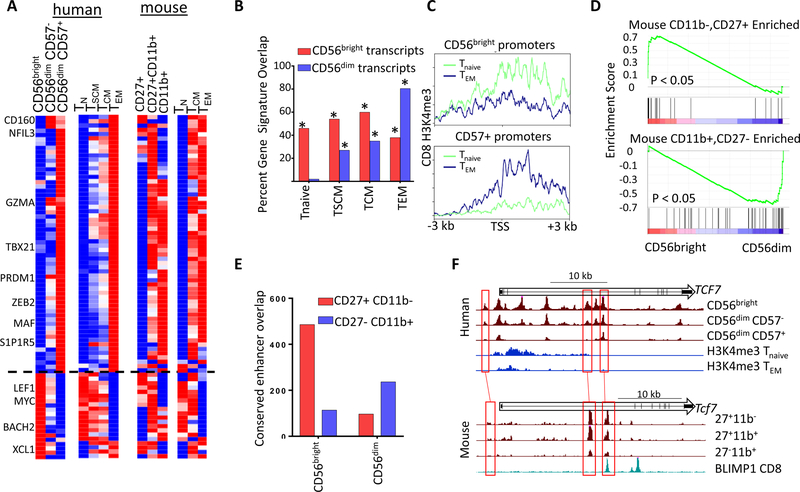
Natural killer (NK) cells develop from common progenitors but diverge into distinct subsets, which differ in cytokine production, cytotoxicity, homing, and memory traits. Given their promise in adoptive cell therapies for cancer, a deeper understanding of regulatory modules controlling clinically beneficial NK phenotypes is of high priority. We report integrated "-omics" analysis of human NK subsets, which revealed super-enhancers associated with gene cohorts that may coordinate NK functions and localization. A transcription factor-based regulatory scheme also emerged, which is evolutionarily conserved and shared by innate and adaptive lymphocytes. For both NK and T lineages, a TCF1-LEF1-MYC axis dominated the regulatory landscape of long-lived, proliferative subsets that traffic to lymph nodes. In contrast, effector populations circulating between blood and peripheral tissues shared a PRDM1-dominant landscape. This resource defines transcriptional modules, regulated by feedback loops, which may be leveraged to enhance phenotypes for NK cell-based therapies.


Figures

Figure 1.
Figure 1.. Transcriptional landscape of NK/ieILC1s.
A) Strategy for CD56bright vs CD56dim (left) and tonsil NK (Ts-NK) sorting (right). B) Heat map highlighting differential expression of signature genes for NK/ieILC1 subsets. C) PCA of genes with variable expression among CD56bright, CD56dim, tonsil NK, ieILC1 and ILC3. D) Volcano plots showing significance and magnitude of expression changes between CD56bright (red) and CD56dim (blue) or E) between CD56bright (red) and Ts-NK (brown). Colored genes highlight > two-fold differences that are statistically significant (p < 0.01, T-test) F) Number of transcripts differentially regulated when comparing two cell types (≥ two-fold change and p < 0.01, T-test). G) Total number of transcripts unique to CD56bright, CD56dim and ieILC1 (> two-fold difference compared with other cell types). H) Fold change plot comparing gene expression in NK/ieILC21 populations. Colored circles represent transcripts expressed at least two-fold higher in one subset versus another. Triangles represent transcripts expressed at least two-fold higher in a single subset compared with all other three subsets.
Figure 2.
Figure 2.. Characterization of blood NK populations
A) Analysis of peripheral NK cells by a 41 antibody CyTOF panel. Relative levels of CD56, CD16 and CD57 are indicated (grey: min, orange: max). B) Pseudotime projection (Monocle) of CyTOF analysis. Cells were defined as CD56bright: Red, CD56dimCD57-: magenta, CD56dimCD57int: purple, or CD56dimCD57+: blue. C) PCA of genes with variable expression among CD56bright, CD57, CD57+, ieILC1 and ILC3. D) Bulk RNA-seq expression values (RPKM) of XCL1 and PRF1. r2 regression values are indicated above. Boxes represent interquartile ranges (IQR) and whiskers represent values within 1.5xIQR. E) Volcano plots showing significance and magnitude of expression changes between CD56bright (red), CD57+ (blue) or CD57 (magenta) subsets. Colored genes highlight > two-fold differences that are statistically significant (p < 0.01, T-test). G) Number of transcripts differentially regulated when comparing two cell types (≥ two-fold change and p < 0.01, T-test).
Figure 3.
Figure 3.. Chromatin landscape of ieILC1, ILC3 and blood NK cells.
A) Clustering analysis of ATAC values for enhancers in CD56bright, CD57, CD57+, ieILC1, and ILC3 subsets. Colors represent unique clusters (K-means). B) PCA of ATAC enhancer values. Red: CD56bright, Blue: CD57+, Magenta: CD57, Green: ieILC1, Purple: ILC3. C-D) UCSC screenshots showing C) KLF43 and D) PRF1 loci. Green tracks represent H3K27ac (0–35 RPKM) and brown tracks show ATAC-seq (0–100 RPKM). Gene location, coding regions and directionality are indicated on top. Red boxes indicate selected enhancers. Heatmaps on the right represent relative gene expression (Txn: blue: gene minimum to red: gene max RPKM). E) SNP enrichment for enhancers differentially active in the given cell types. Shown are the degrees of significance (- log10P values, binomial test) for SNPs classified as immune disorders or cancer (left), or individual GWAS traits (right). F) UCSC screenshot of TNFSF13B (top) or IKZF3 (bottom) loci. Dashes under the screenshots represent GWAS SNPs, and red boxes highlight selected SNPs.
Figure 4.
Figure 4.. Super-enhancers in NK and ieILC1
A) Rank order of increasing H3K27ac enrichment at enhancer loci for each NK/ieILC1 subset. Gene names are indicated next to SE rankings. B) Average expression for genes that are most proximal (< 30 kb) to cell type-specific SEs: ieILC1 (green), CD56dim (blue), and CD56bright (red). Boxes represent interquartile ranges (IQR) and whiskers represent values within 1.5xIQR (* P < 0.05, Student’s T test). C) Percent of human NK SEs that overlap conserved and active mouse NK SEs. Human NK enhancers are classified as shared NK, CD56bright- or CD56dim-specific. D) Venn diagram showing unique or shared SEs in human NK and ieILC1s. A subset of genes for different SE activity profiles is highlighted. E) UCSC screenshot showing GPR183 and GPR18 locus (see Figure change and p < legend). Red boxes specify SEs. F) FACS sorted CD56bright NK cells were cultured for 72 hours in IL-12 and IL-18 in presence or absence of 7α,25-dihydroxycholesterol. IFNγ levels from culture supernatants were determined by CBA. Data are represented as mean + SD. * p < 0.05, Student’s T test.
Figure 5.
Figure 5.. Enriched TF motifs in NK and ieILC1 regulomes.
A) Motif utilization for differentially regulated enhancers based on ATAC data. Motif utilization is represented as relative levels ranging from low (blue) to high (red) and is pre-filtered for significance (p < 0.001, binomial test). Motifs were assigned to a TF family using HOMER and hocomoco databases. The right panel shows expression of selected genes in the corresponding TF family (blue: 23 intensity, red: 28 RPKM). B) UCSC screenshots of the human (top) and mouse SELL locus (bottom) showing ATAC data from indicated cell types. The bottom tracks in each panel show ChIP-seq data for TBX21 or RUNX3 in either a human B cell line (GM12878) or mouse splenic NK cells. The middle panel shows a conserved RUNX-TBOX composite motif for one of the enhancers. C) UCSC screenshot of the MYC locus. The black track (bottom) represents TCF7 ChIP-seq from K562 cells (ENCODE). D) Total RNA per cell for each NK subset. E) GSEA enrichment of ZEB2 repressed genes from Claudia X. et al, 2015, showing relative levels in CD56bright and CD56dim NK transcriptomes. E) UCSC screenshot of the CCR7 locus with the bottom track showing ChIP-seq data for eGFP-ZEB2 from the K562 cell line (ENCODE). F) A representation of CD56bright and CD56dim NK transcription factor regulatory circuits, as predicted from combined expression and motif analysis. Also included are key effector genes of both subsets.
Figure 6.
Figure 6.. Evolutionarily conserved signatures of NK and CD8 cells.
A) Transcripts differentially regulated in peripheral human NK and CD8 subsets (left), and expression of orthologous genes from mouse cells (right). Heatmaps show relative probe intensity (human CD8 data) or RPKM values of transcripts across replicates. B) Percentage of CD56bright or CD57+ specific genes overlapping CD8 Tnaive, TSCM, TCM and TEM gene sets. * p < 0.01 Binomial enrichment. C) Average Tnaive and TEM H3K4me3 density across promoters specifically accessible in CD56bright or CD57+ cells. D) GSEA enrichment of genes selectively expressed in CD27+CD11b- (left) or CD27-CD11b+ (right) cells from Robinette M. L. et al, 2015 showing relative levels in CD56bright and CD56dim NK transcriptomes. E) Overlap between conserved CD56bright and CD56dim cell- type selective enhancers with either CD27+CD11b- or CD27-CD11b+ ATAC peaks. F) UCSC screenshots of the human (top) and mouse (bottom) TCF7 locus showing ATAC or H3K4me3 data from indicated cell type. The bottom track for mouse data shows ChIP-seq data for BLIMP1 from mouse CD8 cells.

References

    1. Allan DSJ, Cerdeira AS, Ranjan A, Kirkham CL, Aguilar OA, Tanaka M, Childs RW, Dunbar CE, Strominger JL, Kopcow HD, et al. (2017). Transcriptome analysis reveals similarities between human blood CD3− CD56bright cells and mouse CD127+ innate lymphoid cells. Sci. Rep 7, 3501. - PMC - PubMed
    1. Baggio L, Laureano ÁM, Silla LM da R., and Lee DA (2017). Natural killer cell adoptive immunotherapy: Coming of age. Clin. Immunol 177, 3–11. - PubMed
    1. Berrien-Elliott MM, Wagner JA, and Fehniger TA (2015). Human Cytokine-Induced Memory-Like Natural Killer Cells. J. Innate Immun 7, 563–571. - PMC - PubMed
    1. Best JA, Blair DA, Knell J, Yang E, Mayya V, Doedens A, Dustin ML, Goldrath AW, Consortium TIGP, Monach P, et al. (2013). Transcriptional insights into the CD8+ T cell response to infection and memory T cell formation. Nat. Immunol 14, 404–412. - PMC - PubMed
    1. Blanc M, Hsieh WY, Robertson KA, Kropp KA, Forster T, Shui G, Lacaze P, Watterson S, Griffiths SJ, Spann NJ, et al. (2013). The transcription factor STAT-1 couples macrophage synthesis of 25-hydroxycholesterol to the interferon antiviral response. Immunity 38, 106–118. - PMC - PubMed

Publication types

MeSH terms