. 2019 Feb 5;29(2):457-474.e5.
doi: 10.1016/j.cmet.2018.12.003. Epub 2018 Dec 27.

Expansion of Islet-Resident Macrophages Leads to Inflammation Affecting β Cell Proliferation and Function in Obesity

Affiliations

Expansion of Islet-Resident Macrophages Leads to Inflammation Affecting β Cell Proliferation and Function in Obesity

Wei Ying et al. Cell Metab. .

Abstract

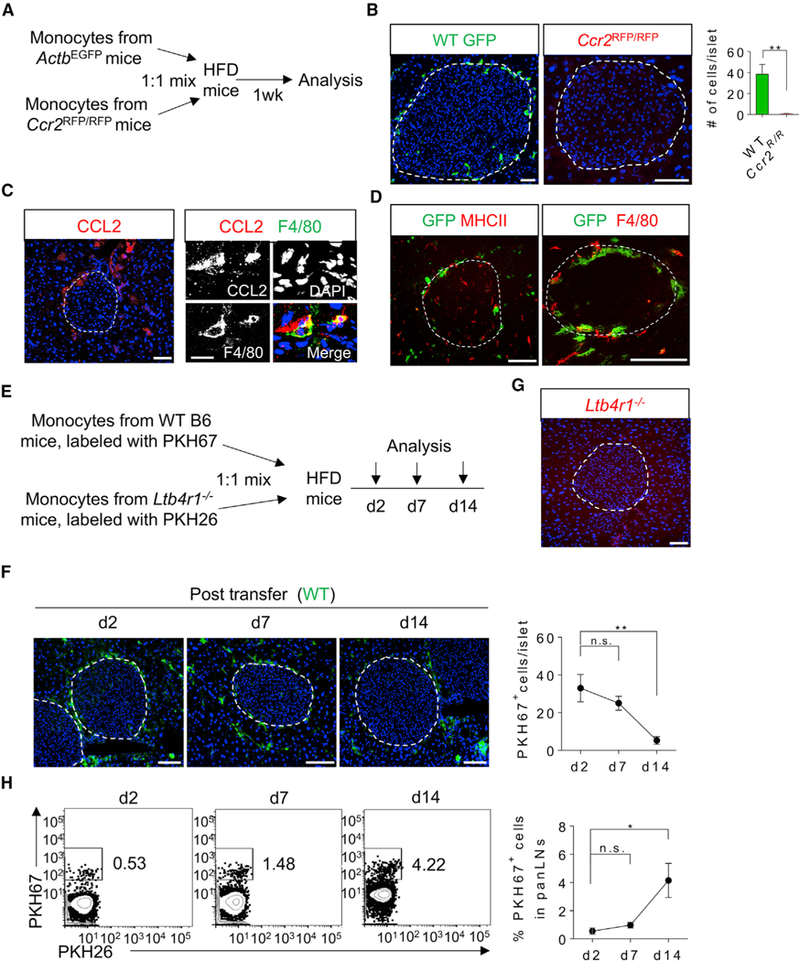
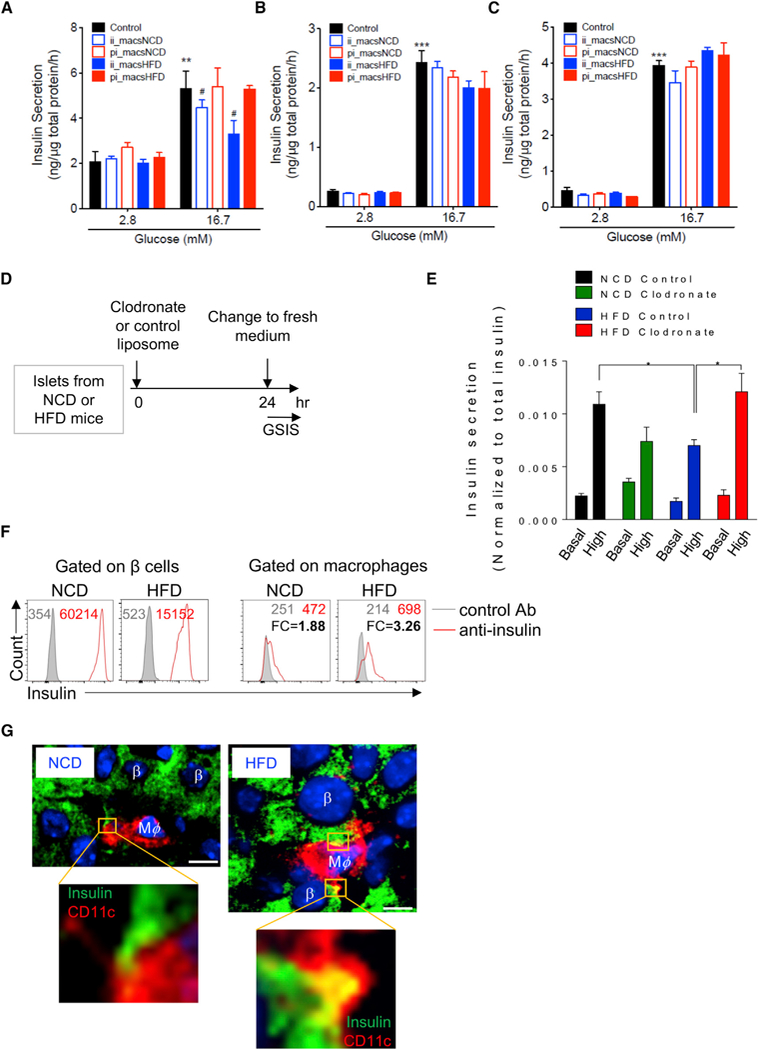
The nature of obesity-associated islet inflammation and its impact on β cell abnormalities remains poorly defined. Here, we explore immune cell components of islet inflammation and define their roles in regulating β cell function and proliferation. Islet inflammation in obese mice is dominated by macrophages. We identify two islet-resident macrophage populations, characterized by their anatomical distributions, distinct phenotypes, and functional properties. Obesity induces the local expansion of resident intra-islet macrophages, independent of recruitment from circulating monocytes. Functionally, intra-islet macrophages impair β cell function in a cell-cell contact-dependent manner. Increased engulfment of β cell insulin secretory granules by intra-islet macrophages in obese mice may contribute to restricting insulin secretion. In contrast, both intra- and peri-islet macrophage populations from obese mice promote β cell proliferation in a PDGFR signaling-dependent manner. Together, these data define distinct roles and mechanisms for islet macrophages in the regulation of islet β cells.

Keywords: islet inflammation; local macrophages proliferation; macrophages; obesity; β cell function; β cell proliferation.


Figures

Figure 1.
Figure 1.. Obesity-Associated Islet Inflammation Is Dominated by Myeloid Lineage Cells
(A) Immunofluorescence staining of pancreatic frozen sections prepared from wild-type B6 mice fed with HFD for various periods of time as indicated. 24-week-old NCD mice were used as controls. (Left) Representative images of CD45 staining. Dotted line depicts the border of an islet (same depiction for the rest of the figures). (Right) Statistics of the number of CD45+ cells per islet. 5–7 mice per group. (B) The expression of CD11b and Ly6C in CD45+ immune cells Isolated from the pancreases of age-matched NCD and HFD mice (with HFD for 16 weeks), respectively. (C) The fractionations of islet immune cells as in (B) based on their expression of CD11c and F4/80and analyzed by flow cytometry. Shown are the percentages of each subset in CD45+ CD11b+ cells. (D) The mean fluorescence intensity (MFIs) of F4/80 and CD11c proteins in the R1 and R2 subsets from NCD and HFD mice, as in (C). (E) The percentages of the R1 (F4/80hiCD11c) and R2 (F4/80loCD11c+) subsets in the islets of NCD and HFD mice as in (C). (F) Immunofluorescence staining of pancreatic frozen sections of NCD and HFD mice as in (A) to examine the expression patterns of CD11c and MHCII. Student’s t test was used, and statistic data are expressed as mean ± SEM. Data are representative of three(A–E), and four(F) experiments. (B–F) n = 3–4 in each group. *p < 0.05; **p < 0.01; n.s., non-significant. Scale bar, 50 μm. Also see Figures S1–S3.
Figure 2.
Figure 2.. Transcriptional Profiles of Islet Macrophages
(A) PCA analysis of islet macrophages under NCD and HFD conditions, in comparison with macrophages from other tissues. (B and C) The expression of M1 (B) and M2 (C) signature genes in isolated islet macrophages from NCD and HFD mice. Mean values from three replicates were shown. (D) Volcano plot showing the fold change (x axis) versus adjusted (adj.) p value(y axis) of the transcriptomes of CD11c+ intra-islet macrophages (ii-macs) between NCD and HFD mice. Genes highlighted in red or blue are based on the thresholds of Log2 fold change > 1 and adj. p value < 0.01. (E) Top 5 pathways in ii-macs that were either activated (red) or repressed (blue) by HFD. “log10(P)” is the enrichment p value in log base 10. (F) Volcano plot showing the fold change (x axis) versus adj. p value (y axis) of the transcriptomes of CD11c peri-islet macrophages (pi-macs) between NCD and HFD mice. Genes highlighted in red or blue are based on the thresholds of Log2 fold change > 1 and adj. p value < 0.01. (G) Top 5 pathways in pi-macs that were either activated (red) or repressed (blue) by HFD. “log10(P)” is the enrichment p value in log base 10. Data are representative of three replicates. ii-macs, intra-islet CD11c+ macrophages; pi-macs, peri-islet CD11c macrophages; SubQ, subcutaneous; GO, gene ontology. Also see Figures S4 and S5 and Tables S1, S2, S3, and S4.
Figure 3.
Figure 3.. Islet Macrophages Are Not Recruited from Circulating Monocytes
(A) Schematic diagram illustrating in vivo tracking of ACTbGFP wild-type (WT) or Ccr2RFP/RFP donor monocytes in HFD WT recipient mice. (B) Immunofluorescence staining of pancreatic frozen sections of 24-week-old HFD mice (with HFD for 16 weeks) received either wild-type or Ccr2-deficient monocytes. Pseudo-colors: green, wild-type monocytes; red, Ccr2-deficient monocytes. (C) (Left) Immunostaining of CCL2 in the pancreas of 24-week-old HFD mice (representative image from three mice with more than ten islets examined in each mouse). (Right) Co-staining of CCL2 and F4/80 in the peri-islet area of pancreatic sections from the same cohort of mice. (D) Immunofluorescence staining of the same pancreatic frozen sections as in (B) for the expression of MHCII (red, left panel) or F4/80 (red, right panel). Green pseudo-color depicts transferred WT monocytes. (E) Experimental design of adoptive transfer of monocytes isolated from WT B6 mice and Ltb4r1−/− NCD mice and labeled in vitro with PKH67 and PKH26, respectively. (F and G) Immunofluorescence staining of pancreatic frozen sections of mice received monocytes prepared as in (E) and analyzed for PKH67-labeled WT monocytes (F) at indicated time points and PKH26-labeled Ltb4r1−/− monocytes 7 days after the transfer (G). (H) Flow cytometric analysis of transferred monocytes that were accumulated in panLNs at various time points as indicated. Student’s t test was used, and statistic data are expressed as mean ± SEM (A–D); n = 4 per group; (E–G) n = 3 per group. *p < 0.05; **p < 0.01. Scale bars, 50 μm (B; C, left panel; D; F; G), 10 μm (C, right panel).
Figure 4.
Figure 4.. Obesity Induces a Local Expansion of Intra-Islet Macrophages
(A) Experimental design of BrdU incorporation assays. (B) Representative immunofluorescence staining of pancreatic frozen sections (left) and statistics (right) of age-matched NCD and HFD mice (16 weeks of HFD feeding) to measure the cells labeled with BrdU and the expression of MHCII. Arrows depict proliferating macrophages. Insets depict higher magnifications of the stainings for BrdU and MHCII. (C) Flow cytometric analysis of macrophage proliferation in mice prepared as in (B). Isolated islets were dispersed into single-cell suspension, and the incorporation of BrdU in CD11c+ intra-islet and CD11c peri-islet macrophages was measured. Student’s t test was used, and statistic data are expressed as mean ± SEM; n = 4 per group. **p < 0.01. ii-macs, intra-islet CD11c+ macrophages; pi-macs, peri-islet CD11c macrophages. Scale bar, 50 μm. Also see Figure S2.
Figure 5.
Figure 5.. Intra-Islet CD11c+ Macrophages Impair GSIS in Min6 and Primary β Cells
(A) Basal insulin secretion and GSIS inMin6 cells after direct cell-cell co-culture with or without intra-islet (CD11c+) or peri-islet (CD11c) macrophages isolated from age-matched NCD and HFD mice. The cells were co-cultured ata5 (Min6 cells) to 1 (macrophages) ratio to reflect the cell ratio in HFD mouse islets. After 24 hr, insulin secretion was measured as described in the STAR Methods section. n = 4 per group. (B) Basal insulin secretion and GSIS in Min6 cells after being co-cultured with macrophages in Transwell plates (0.4 mm polycarbonate filter). Min6 cells were plated at the bottom of the plates, and macrophages were added to the upper plates. The ratio between macrophages and Min6 cells was 1:5. n = 5 per group. (C) Basal insulin secretion and GSIS in Min6 cells after being incubated with macrophage-conditioned media for 24 hr.n = 6 (control), n = 4 (CD11c cells from NCD), and n = 2 (CD11c+ from NCD, CD11c and CD11c+ cells from HFD mice). **p < 0.01 versus lane 1; ***p < 0.001 versus lane 1; #, p < 0.05 versus lane 6. (D) Experimental design to test macrophage depletion and β cell GSIS. The islets were freshly isolated from NCD and HFD mice and cultured in vitro in the presence of clodronate liposome or control liposome (7 mg/mL, 1:100 dilution) for 24 hr. (E) The basal insulin secretion and GSIS from primary islets isolated from NCD and HFD mice with the presence or absence of macrophages. n = 5 per group. *p < 0.05. (F) Intra-islet macrophages from NCD or HFD mice were co-cultured with primary islets for 3 days. The expression of insulin was measured using flow cytometry with anti-insulin mAb in both β cells and macrophages. The numbers in each panel depict the MFIs of insulin expression (red) in comparison with isotype control (gray). FC, fold change. (G) Immunostaining of NCD and HFD pancreases. β cells were identified by anti-insulin staining and macrophages by anti-CD11c. Note that the HFD macrophage filopodia contained insulin signals (yellow). Scale bar, 5 μm. Student’s t test was used, and statistic data are expressed as mean ± SEM; ii-macs, intra-islet CD11c+ macrophages; pi-macs, peri-islet CD11c macrophages. Also see Figure S6.
Figure 6.
Figure 6.. Obesity Increases the Proliferation and Dual Hormone Expression in β Cells
(A) Immunostaining of pancreatic frozen sections of NCD and HFD mice showing the expression of insulin (green) and incorporation of BrdU (red). Inset image depicted one BrdU+ cell and one BrdU cell. (B) Immunostaining of pancreatic frozen sections of NCD and HFD mice showing the expression of glucagon (green) and incorporation of BrdU (red). (C) Double staining for insulin and glucagon in pancreatic frozen sections of NCD and HFD mice. Insets (a and b) were shown in higher magnification. Arrowheads depict insulin/glucagon double-positive cells. (D) Triple staining for insulin, glucagon, and BrdU in pancreatic frozen sections of HFD mice. Arrowheads depict BrdU-positive cells. Student’s t test was used, and statistic data are expressed as mean ± SEM; n = 6 per group. **p < 0.01; ****p < 0.0001; n.s., non-significant. n.d., non-detected. Scale bar, 50 μm.
Figure 7.
Figure 7.. Islet Macrophages from HFD Mice Can Promote β Cell Proliferation
(A) (Left) Experimental design of co-culturing primary islets and isolated macrophages from NCD and HFD mice. (Right) The incorporation of EdU in insulin+ β cells after being co-cultured with ii-macs or pi-macs from NCD and HFD mice, respectively. n = 3–4 per group. (B and C) The expression of Pdgfa in ii-macs and pi-macs from NCD and HFD mice. (B) Representative peak tracks depicting reads per million reads aligned. Arrow indicates Pdgfa transcription start site and direction of transcription. (C) Mean ± SEM of Pdgfa in intra- and peri-islet macrophages from NCD or HFD mice. Presented in TPMs (transcripts per kilobase million). Data are representative of three replicates. (D) (Left) Experimental design of co-culturing primary islets and isolated macrophages from HFD mice, with PDGFR inhibitors, CP-673451. (Right) The percentages of proliferating β cells after being co-cultured with intra-islet macrophages isolated from HFD mice; in the presence of CP-673451; or DMSO control. Data are representative of two independent experiments. n = 5 per group. Student’s t test was used, and statistic data are expressed as mean ± SEM. *p < 0.01; n.s., non-significant; ii-macs, intra-islet CD11c+ macrophages; pi-macs, peri-islet CD11c macrophages; w/, with; w/o, without; Mϕ, macrophage; CP, CP-673451; EdU, 5-ethynyl-2′-deoxyuridine. Also see Figure S7.

Comment in

Similar articles

Cited by

References

    1. Aamodt KI, and Powers AC (2017). Signals in the pancreatic islet microenvironment influence β-cell proliferation. Diabetes Obes. Metab. 19 (Suppl 1), 124–136. - PMC - PubMed
    1. Alonso LC, Yokoe T, Zhang P, Scott DK, Kim SK, O’Donnell CP, and Garcia-Ocaña A (2007). Glucose infusion in mice: a new model to induce beta-cell replication. Diabetes 56, 1792–1801. - PMC - PubMed
    1. Amano SU, Cohen JL, Vangala P, Tencerova M, Nicoloro SM, Yawe JC, Shen Y, Czech MP, and Aouadi M (2014). Local proliferation of macrophages contributes to obesity-associated adipose tissue inflammation. Cell Metab. 19, 162–171. - PMC - PubMed
    1. Araújo TG, Oliveira AG, Carvalho BM, Guadagnini D, Protzek AO, Carvalheira JB, Boschero AC, and Saad MJ (2012). Hepatocyte growth factor plays a key role in insulin resistance-associated compensatory mechanisms. Endocrinology 153, 5760–5769. - PubMed
    1. Assmann A, Ueki K, Winnay JN, Kadowaki T, and Kulkarni RN (2009). Glucose effects on beta-cell growth and survival require activation of insulin receptors and insulin receptor substrate 2. Mol. Cell. Biol. 29, 3219–3228. - PMC - PubMed

Publication types

Substances