. 2019 Feb 5;29(2):443-456.e5.
doi: 10.1016/j.cmet.2018.12.004. Epub 2018 Dec 27.

Efferocytosis Fuels Requirements of Fatty Acid Oxidation and the Electron Transport Chain to Polarize Macrophages for Tissue Repair

Affiliations

Efferocytosis Fuels Requirements of Fatty Acid Oxidation and the Electron Transport Chain to Polarize Macrophages for Tissue Repair

Shuang Zhang et al. Cell Metab. .

Abstract

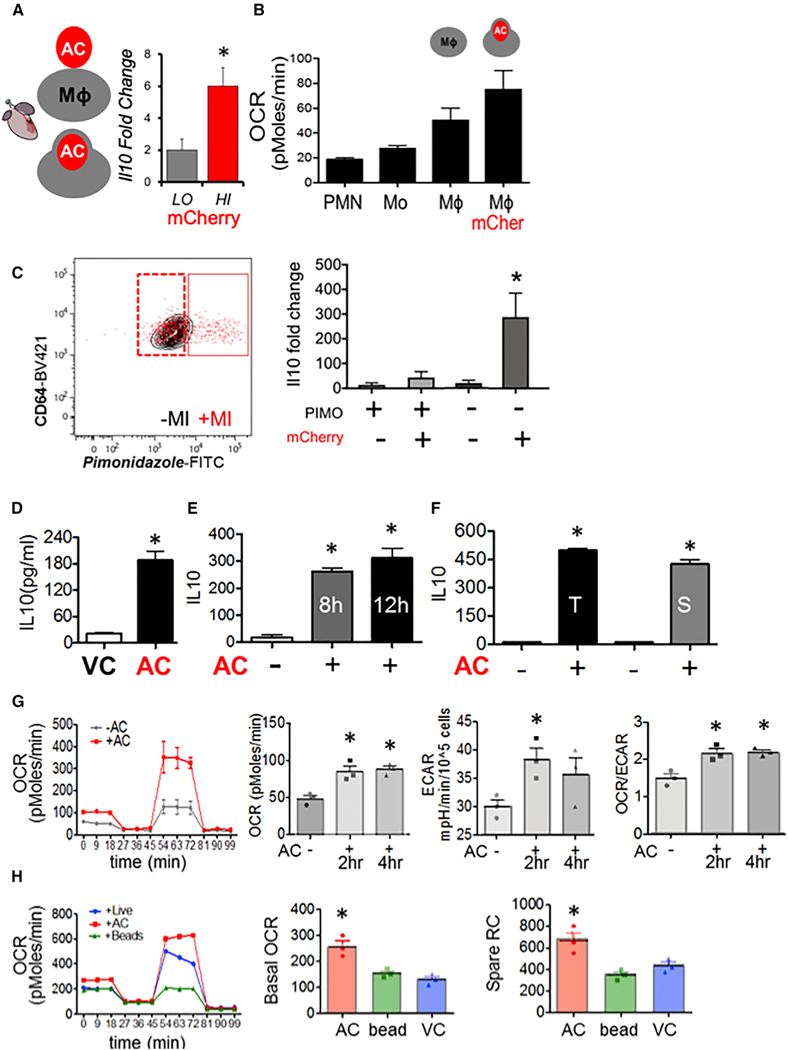
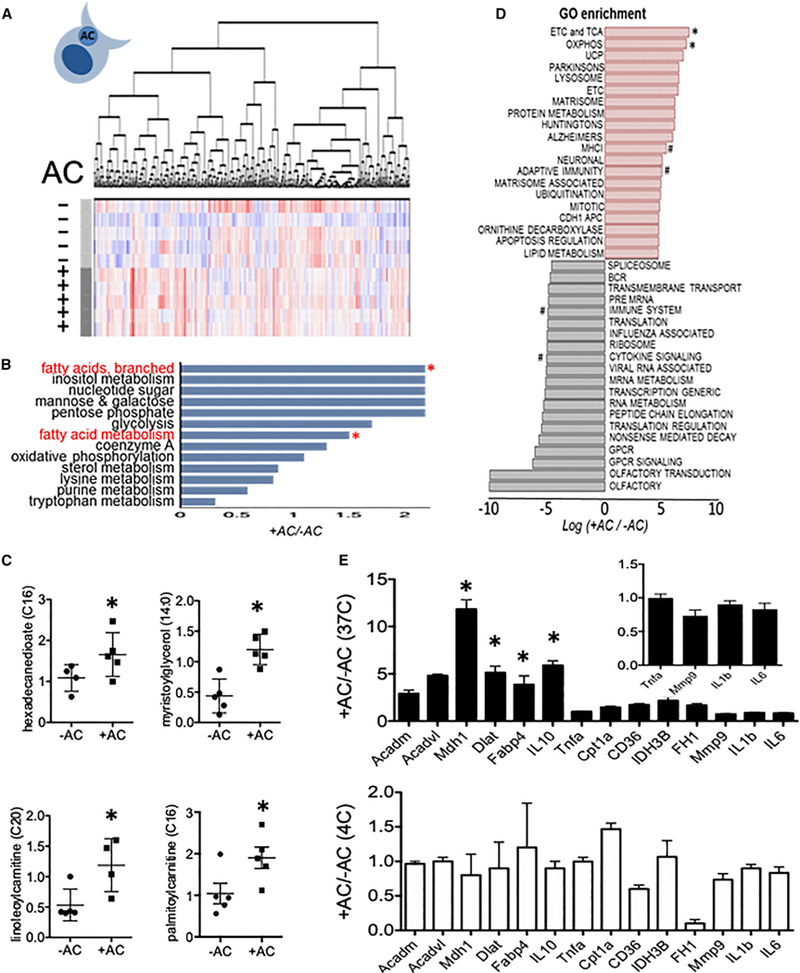
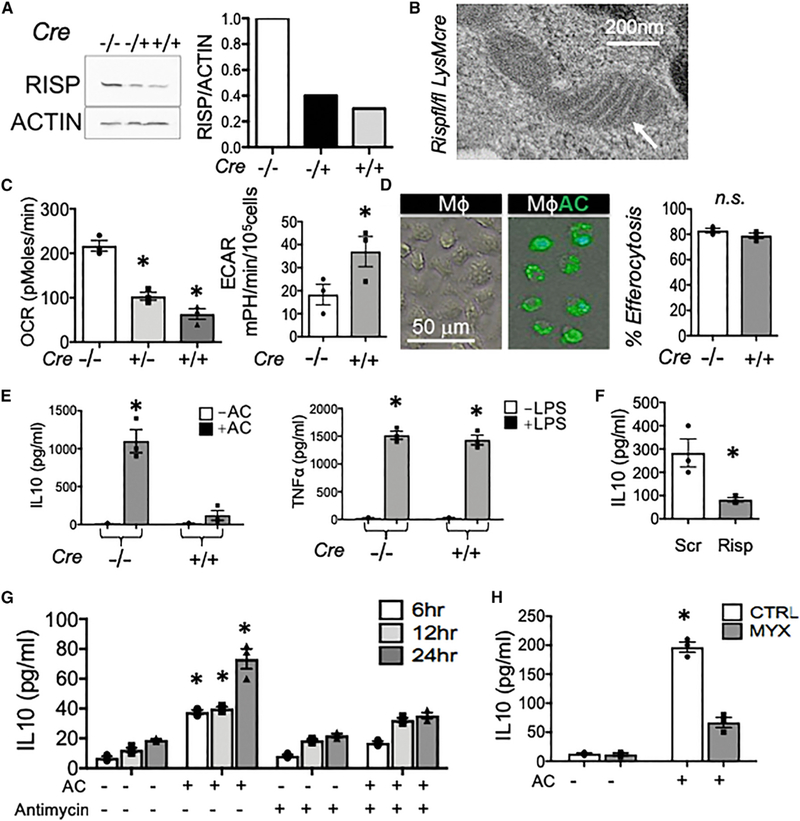
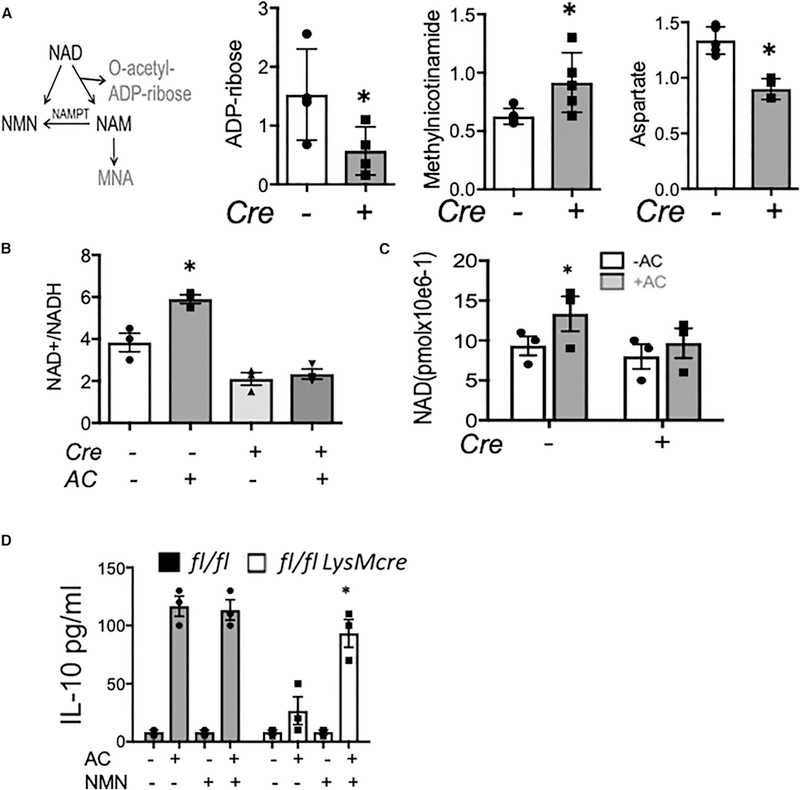
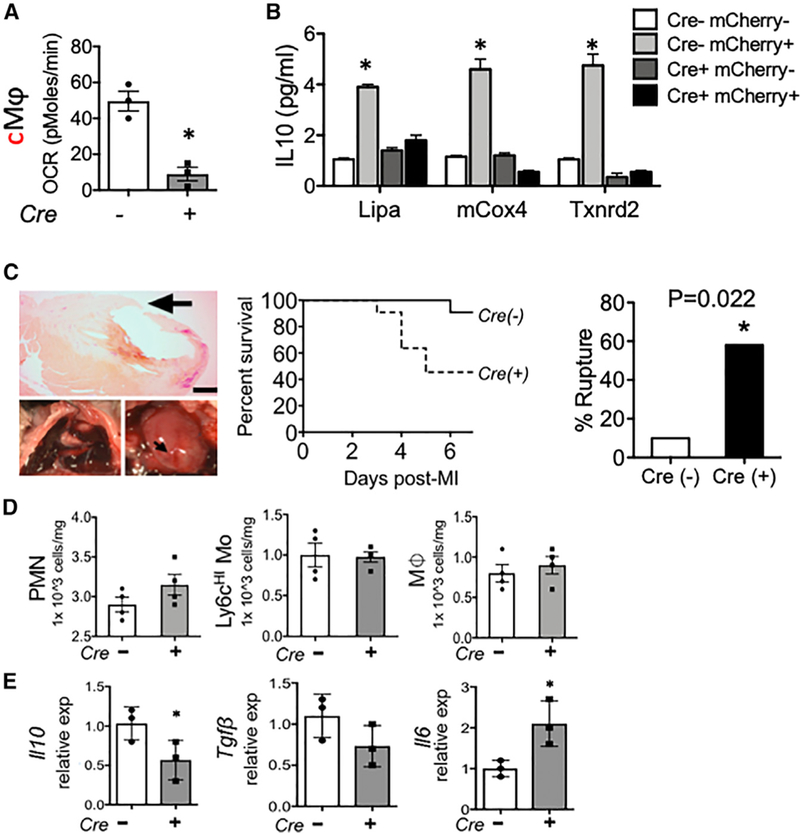
During wound injury, efferocytosis fills the macrophage with a metabolite load nearly equal to the phagocyte itself. A timely question pertains to how metabolic phagocytic signaling regulates the signature anti-inflammatory macrophage response. Here we report the metabolome of activated macrophages during efferocytosis to reveal an interleukin-10 (IL-10) cytokine escalation that was independent of glycolysis yet bolstered by apoptotic cell fatty acids and mitochondrial β-oxidation, the electron transport chain, and heightened coenzyme NAD+. Loss of IL-10 due to mitochondrial complex III defects was remarkably rescued by adding NAD+ precursors. This activated a SIRTUIN1 signaling cascade, largely independent of ATP, that culminated in activation of IL-10 transcription factor PBX1. Il-10 activation by the respiratory chain was also important in vivo, as efferocyte mitochondrial dysfunction led to cardiac rupture after myocardial injury. These findings highlight a new paradigm whereby macrophages leverage efferocytic metabolites and electron transport for anti-inflammatory reprogramming that culminates in organ repair.

Keywords: efferocytosis; immunometabolism; macrophage; wound healing.


Figures

Figure 1.
Figure 1.. Tissue Injury Phagocytes in the Process of Efferocytosis Produce IL-10 and Exhibit a Mitochondrial Bias
(A) In a model of tissue injury, B6 mice transgenic for cardiac-specific (Myh6-Cre) expression of mCherry were subject to myocardial infarction (MI). Cardiac extracts were prepared and flow cytometry employed to isolate cardiac macrophages (Mf s) (CD11b+F4/80+Ly6g—CD64+) that included low (LO) and high (HI) mCherry+ dying and apoptotic cells (ACs). mCherry-LO and -HI phagocyteswere sorted and relative gene expression normalized to β2m as assessed by qPCR and plotted as fold change over IL-10 from Mᶲs from naive hearts. (B) Cardiac Ly6g+ neutrophils (PMN), LycHI, Ly6g— monocytes (Mo), CD64+ Mfs, and Mᶲs staining for mCherry were interrogated for basal OCR by functional respiration analysis. (C) Cardiac Mfs were stained with hypoxia probe PIMOnidazole and mCherry and sorted for qPCR. (D-F) Elicited primary Mᶲs were co-cultivated with early (Annexin V positive, propidium iodide negative) ACs. Non-engulfed cells were removed from adherent phagocytes, and cell culture medium was analyzed for secreted cytokines. (D) IL-10 responsewith viable Jurkat cells (VCs) versusACs. (E) Time course analysis of IL-10 production. (F) IL-10 secretion after adding primary thymocytes (T) or primary splenocytes (S). (G) OCR of primary elicited Mᶲs ± indicated treatments and quantified basal OCR. To ascertain basal and spare respiratory capacity (SRC), efferocytes were administered sequential treatments ofoligomycin, CCCP, and rotenone plus antimycin. Minutes 0–18 is basal OCR and 54–81 min is SRC. Area underthe curve quantifications are displayed. Also measured was the extracellular acidification rate (ECAR) as a reflection of glycolysis. (H) Mᶲs were co-cultivated with inert beads and/or live cells.
Figure 2.
Figure 2.. Global Metabolomic Profile of Efferocytosis Highlights FAO Utilization
(A) Heatmap after unsupervised hierarchical clustering of metabolitesfrom primary peritoneal Mᶲs, minus (−) versus plus(+) apoptotic cells (n = 5 percondition). Shades of red and blue indicate an increase or decrease of metabolites, respectively. (B) Metabolite set enrichment analysis of significantly altered core pathways. Asterisks indicate pathways of interest. (C) Selected lipid metabolites of interest. (D) Gene ontology analysis after mRNA sequencing screen. # indicates pathways of interest. (E) qPCR validation of selected FAO, lipolysis, TCA, and inflammatory genes versus control (non-filled bars in bottom panel). *p < 0. 05. Inset is magnification of data < 1.
Figure 3.
Figure 3.. Efferocytic IL-10 Is Fueled by and Requires FAO, Not Glycolysis
(A) Apoptotic cells (ACs) were previously cultured in increasing concentrations of fatty-acid-supplemented growth media (μg/L fatty acid per liter), prior to co-cultivation with macrophages/Mᶲ at equivalent ACs to Mᶲ ratios and ELISAs performed. (B) FAO-inhibitor etomoxir (ETO) suppresses AC-induced OCR in efferocytes. (C) IL-10 and TGF-β production in AC-treated Mᶲs ± ETO. (D) IL-10 production in AC-treated Cpt1- and Cpt2-deficient Mᶲs. (E) IL-10 production in AC-treated Mᶲs ± 2-deoxyglucose (2DG). (F) IL-10 production in AC-treated Mᶲs ± glucose-inhibitor UK5099 and IL-1 β production in LPS-treated Mᶲs ± UK5099. 5 mM ATP was added 3 hr after LPS addition. *p < 0.05 versus control.
Figure 4.
Figure 4.. Electron Transport Dysfunction Reduces the Capacity of Efferocytes to Produce IL-10
Elicited peritoneal M$s were harvested from Rispfl/fl and Rispfl/fl LysMcre mice. (A) Mᶲs RISP protein was quantified by immunoblot. (B) Transmission electron micrograph of a Risp-deficient Mᶲ. (C) OCR and ECAR profiles of Risp-deficient Mᶲs. (D) Photomicrographs and quantification of efferocytosis. Mᶲs remain unlabeled while apoptotic cells (ACs) are labeled green. n.s., not statistically significant. (E) IL-10 in cell supernatants 12 hr after efferocytosis. TNF-α was measured 6 hr after LPS stimulation. (F) IL-10 production was measured in macrophages after Risp knockdown with siRNA. (G) Acute inhibitor antimycin/AntA added at 100 nM 1 hr post AC feeding. IL-10 was measured with ELISA. (H) Myxothiazol inhibitor of electron transfer to RISP was added to efferocytes and IL-10 measured by ELISA. *p < 0.05.
Figure 5.
Figure 5.. NAD+ Supplementation Partially Rescues Efferocytic IL-10 Production from Macrophages Deficient in RISP
(A) NAD metabolism scheme with a focus on NAD breakdown and buildup of MNA metabolite 1-methylnicotinamide (n-methylnicotinamide). Graphed is the relative change of indicated metabolites in Risp-deficient or control efferocytes, with versus without apoptotic cells. (B) Risp deficiency (LysMcre) reduces the increased NAD+/NADH ratio in Mᶲs during efferocytosis of apoptotic cells (ACs). (C) Mᶲs treated with or without ACs for 3 hr were harvested and used for direct measure of NAD+ levels. (D) Peritoneal efferocytes were administered NAD+ precursor NMN and IL-10 measured by ELISA. *p < 0.05 relative to control.
Figure 6.
Figure 6.. Sirtl Is Required for NAD-Dependent IL-10 Production and Activation of the IL-10Transcription Factor PBX
(A) Sirt2+/+ and Sirt2−/− peritoneal macrophages were challenged with apoptotic cells (ACs), and absolute IL-10 levels were measured by ELISA. (B) Immunoblot of SIRT1 protein in primary Mᶲs during efferocytosis. (C) IL-10 levels were compared between Sirt2 and Sirtl-deficient Mᶲs during efferocytosis. (D) SIRT1 protein activity measured in control versus Risp-deficient Mᶲs that were treated with versus without ACs. (E) NMN supplementation rescues absolute levels of IL-10 production in Risp-deficient efferocytes, but not Sirf1-deficient efferocytes. (F) PBX1 ChIP-IL-10 qPCR was performed in efferocytes treated with Sirf1 siRNA versus scrambled (Scr) control. (G) PBX1 ChIP-IL-10 qPCR before and after efferocytosis in control, Risp-deficient, and Risp-deficient macrophages with NMN supplementation. (H) IL-10 production after Sirt1 siRNA and/or Pbx1 siRNA in primary Mᶲs. *indicates p < 0.05 versus control.
Figure 7.
Figure 7.. Macrophage Mitochondrial Dysfunction Impairs IL-10-Associated Cardiac Repair
Rispfl/fl and Rispfl/fl LysMcre mice were subjected to experimental myocardial infarction (MI) at the left anterior descending artery, as described in STAR Methods. (A) Cardiac extracts were prepared and flow cytometry employed to isolate left ventricular cardiac Mᶲs (CD45+CD11b+F4/80+Ly6g—CD64+). Mice transgenic for cardiac-specific expression of the fluor mCherry were subjected to MI, and cardiac Mᶲs containing mCherry were interrogated for OCR in Rispfl/fl LysMcre mice. (B) Gene expression by qPCR from indicated cell types, sorted directly from heart. (C) Representative images and Kaplan-Meier survival plot and rupture quantification of indicated mice after MI. n = 10 (Cre—) versus 11 (Cre+) and p = 0.02. (D) Levels of indicated immune cell subsets (PMN, neutrophil; Mo, monocyte; Mᶲ, macrophage) after MI. (E) Gene expression of indicated inflammatory mediators from cardiac extracts. *p < 0.05.

Comment in

References

    1. A-Gonzalez N, Bensinger SJ, Hong C, Beceiro S, Bradley MN, Zelcer N, Deniz J, Ramirez C, Diaz M, Gallardo G, et al. (2009). Apoptotic cells promote their own clearance and immune tolerance through activation of the nuclear receptor LXR. Immunity 31, 245–258. - PMC - PubMed
    1. Alvey CM, Spinler KR, Irianto J, Pfeifer CR, Hayes B, Xia Y, Cho S, Dingal PCPD, Hsu J, Smith L, et al. (2017). SIRPA-inhibited, marrow-derived macrophages engorge, accumulate, and differentiate in antibody-targeted regression of solid tumors. Curr. Biol. 27, 2065–2077.e6. - PMC - PubMed
    1. Amat R, Planavila A, Chen SL, Iglesias R, Giralt M, and Villarroya F (2009). SIRT1 controls the transcription of the peroxisome proliferator-activated receptor-gamma Co-activator-1alpha (PGC-1alpha) gene in skeletal muscle through the PGC-1alpha autoregulatory loop and interaction with MyoD. J. Biol. Chem. 284, 21872–21880. - PMC - PubMed
    1. Ansó E, Weinberg SE, Diebold LP, Thompson BJ, Malinge S, Schumacker PT, Liu X, Zhang Y, Shao Z, Steadman M, et al. (2017). The mitochondrial respiratory chain is essential for haematopoietic stem cell function. Nat. Cell Biol. 19, 614–625. - PMC - PubMed
    1. Anzai A, Choi JL, He S, Fenn AM, Nairz M, Rattik S, McAlpine CS, Mindur JE, Chan CT, Iwamoto Y, et al. (2017). The infarcted myocardium solicits GM-CSF for the detrimental oversupply of inflammatory leukocytes. J. Exp. Med. 214, 3293–3310. - PMC - PubMed

Publication types