. 2019 Mar 21;26(3):400-410.e3.
doi: 10.1016/j.chembiol.2018.11.004. Epub 2018 Dec 27.

Optogenetic Delineation of Receptor Tyrosine Kinase Subcircuits in PC12 Cell Differentiation

Affiliations

Optogenetic Delineation of Receptor Tyrosine Kinase Subcircuits in PC12 Cell Differentiation

John S Khamo et al. Cell Chem Biol. .

Abstract

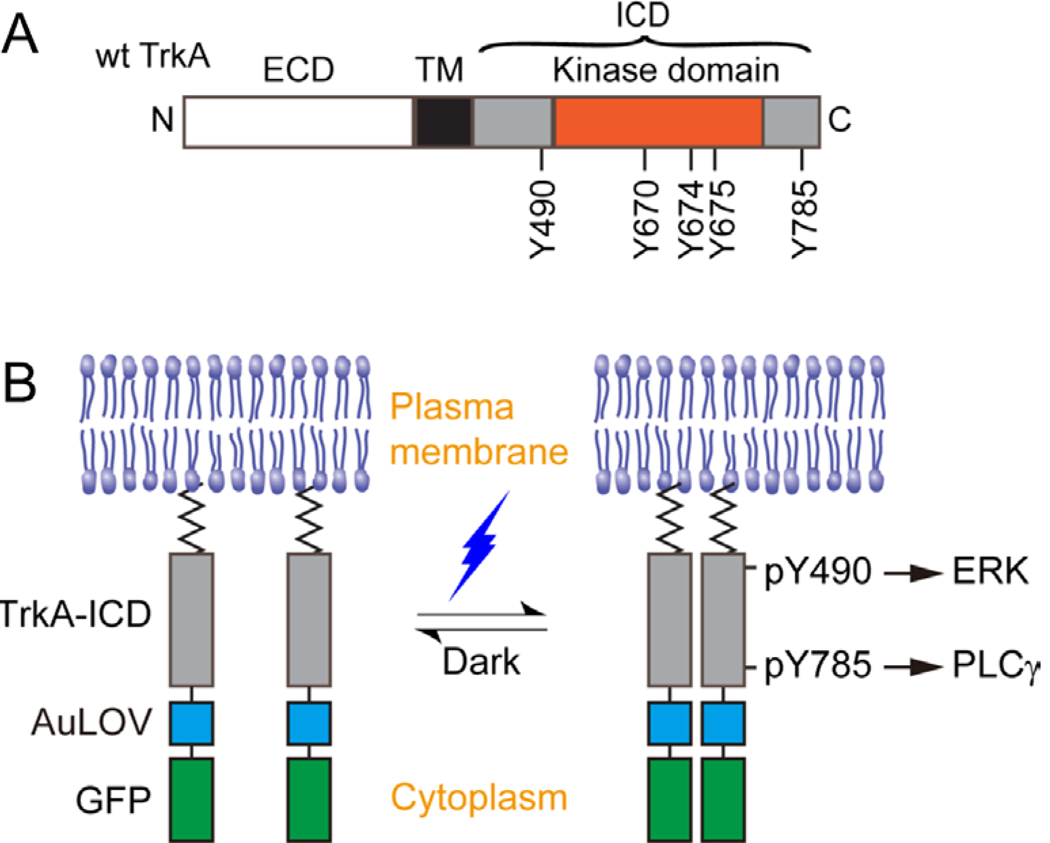
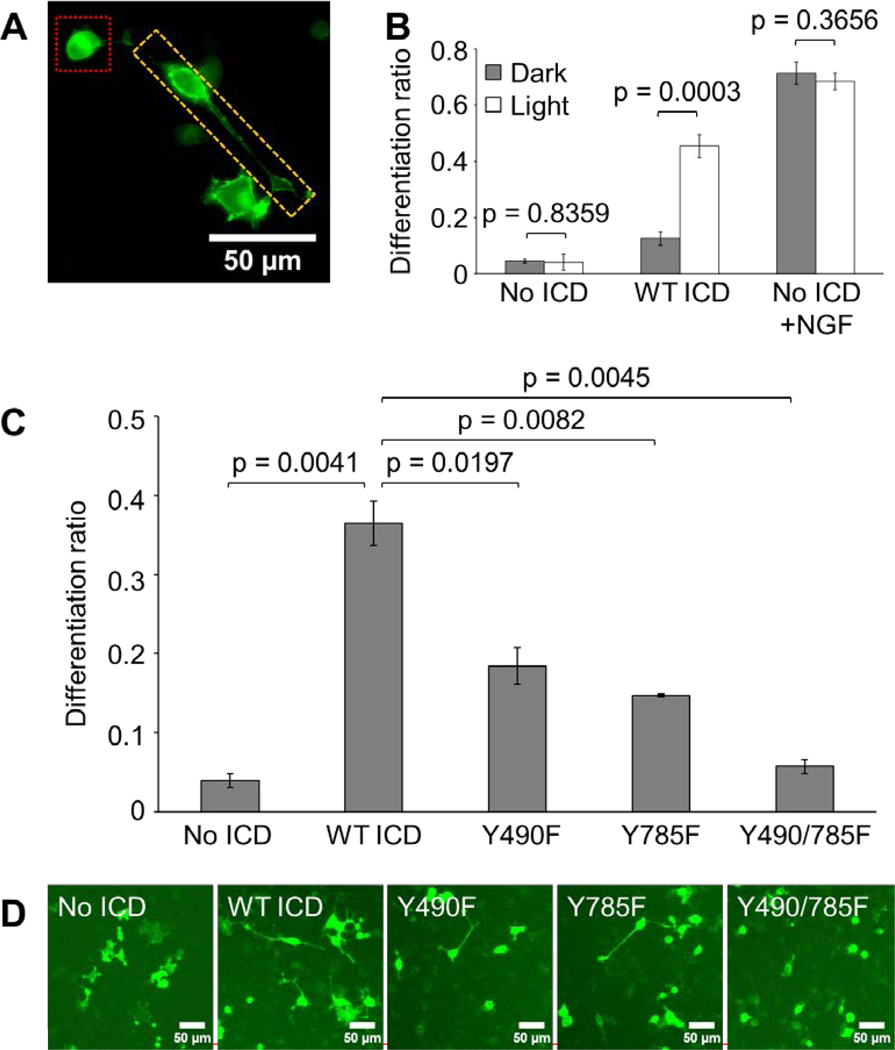
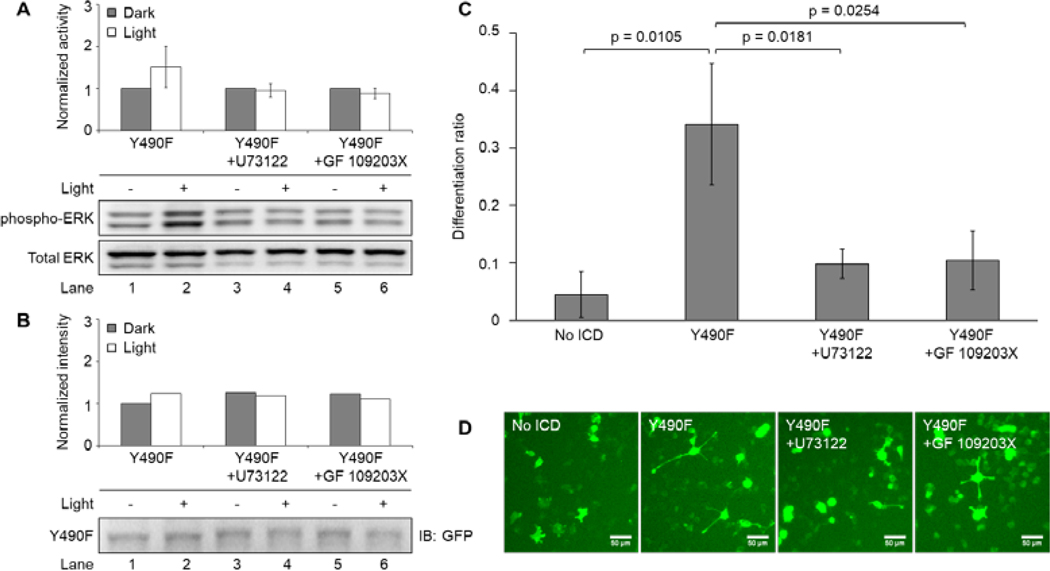
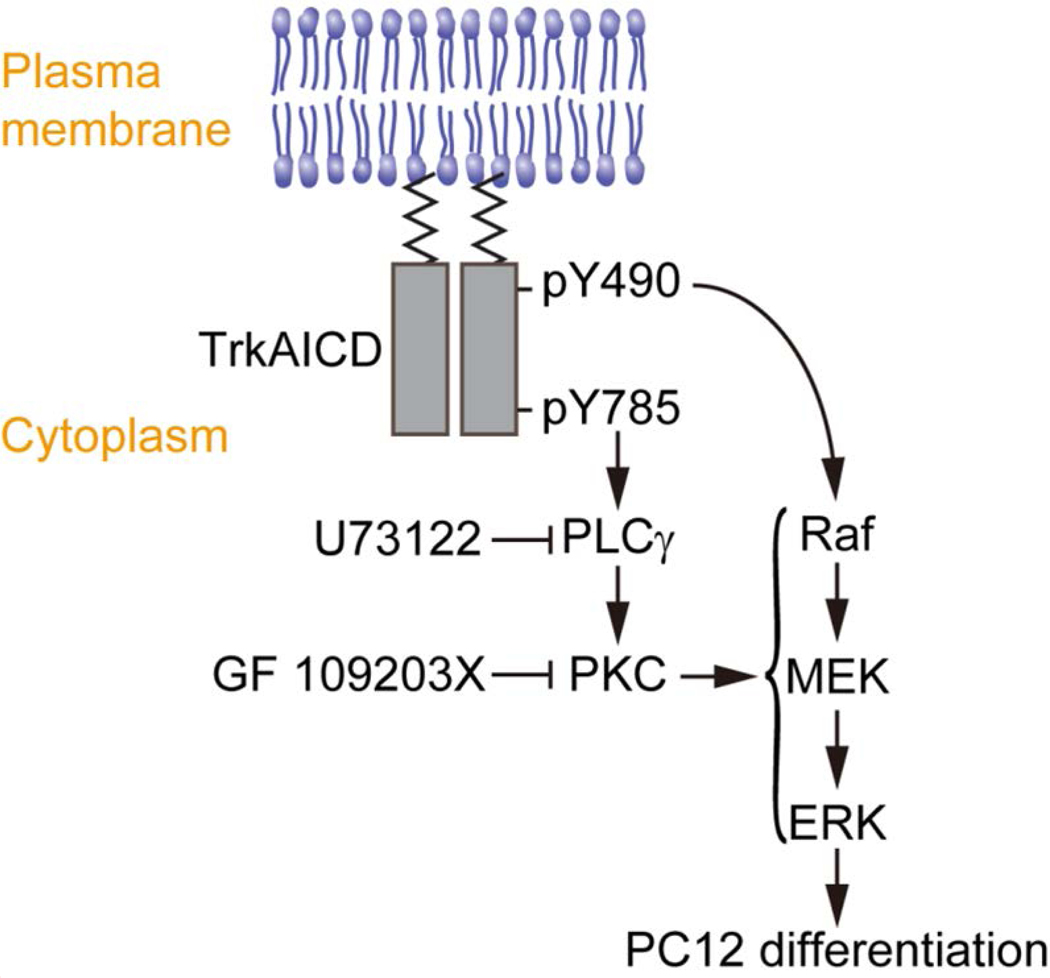
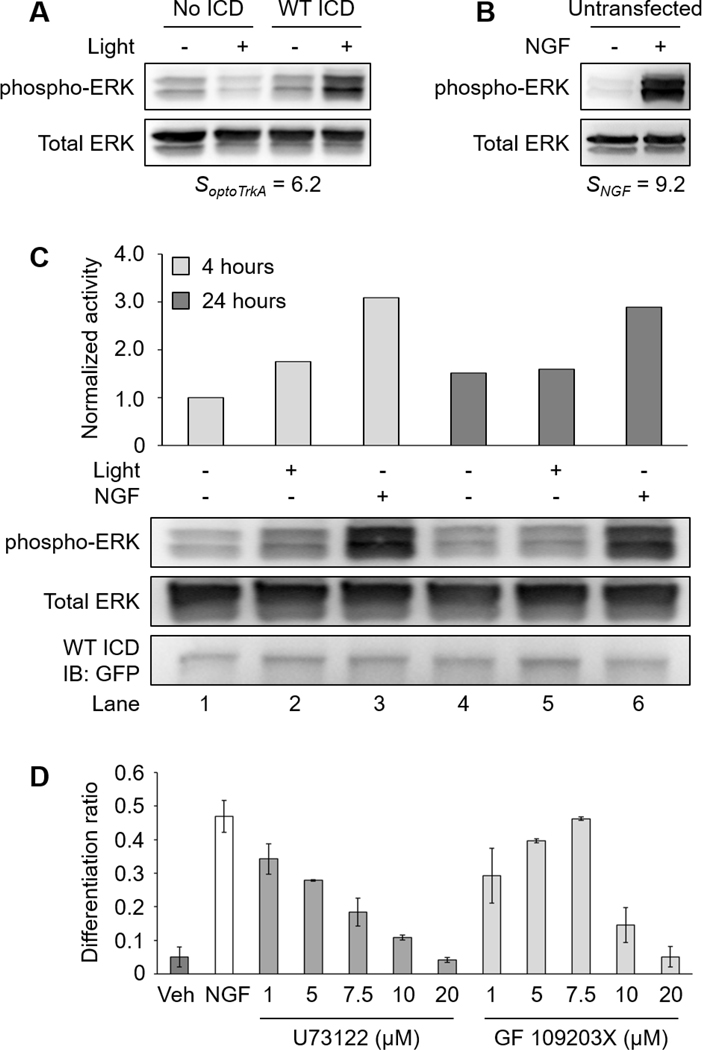
Nerve growth factor elicits signaling outcomes by interacting with both its high-affinity receptor, TrkA, and its low-affinity receptor, p75NTR. Although these two receptors can regulate distinct cellular outcomes, they both activate the extracellular-signal-regulated kinase pathway upon nerve growth factor stimulation. To delineate TrkA subcircuits in PC12 cell differentiation, we developed an optogenetic system whereby light was used to specifically activate TrkA signaling in the absence of nerve growth factor. By using tyrosine mutants of the optogenetic TrkA in combination with pathway-specific pharmacological inhibition, we find that Y490 and Y785 each contributes to PC12 cell differentiation through the extracellular-signal-regulated kinase pathway in an additive manner. Optogenetic activation of TrkA eliminates the confounding effect of p75NTR and other potential off-target effects of the ligand. This approach can be generalized for the mechanistic study of other receptor-mediated signaling pathways.

Keywords: ERK; PC12 cell differentiation; PLCγ; TrkA signaling subcircuits; Y490; Y785; nerve growth factor; optogenetics.


Figures

Figure 1.
Figure 1.. Design of the optogenetic TrkA system.
(A) Representation of the wild-type TrkA receptor. TrkA is a Type I transmembrane protein anchored at the plasma membrane by a single-helix transmembrane domain (TM). Nerve growth factor (NGF) associates with the extracellular domain (ECD) to promote receptor dimerization and phosphorylation of key tyrosines within the intracellular domain (ICD). Y670, Y674, and Y675 are critical for kinase activity, while Y490 and Y785 are involved in the initiation of the Raf/MEK/ERK and PLCγ-PKC signaling pathways, respectively. (B) Schematic representation of the optogenetic TrkA receptor. The ECD and TM are replaced by a lipidation motif to abolish ligand sensitivity, while retaining normal orientation and localization at the plasma membrane. Light sensitivity is introduced through fusion with the photosensitive protein, AuLOV. Illumination with blue light should promote dimerization of receptor ICDs and activation of downstream signaling pathways. Green fluorescent protein (GFP) serves as a probe for system expression.
Figure 2.
Figure 2.. Optogenetic TrkA localizes to the plasma membrane and homo-associates in response to blue light.
(A) Fluorescence microscopy images of PC12 cells transiently expressing a cytosolic GFP or variants of the optogenetic TrkA system. (B) Red-line profile analysis of fluorescence images in (A) reveals a strong membrane localization of the optogenetic constructs. (C) Overexpression of WT ICD and TrkA-mCherry shows that both fusion proteins primarily localize to the plasma membrane. (D) Bimolecular fluorescence complementation assay based on split Venus fragments. A 20-minute blue light illumination (5 mW/cm2) increased the fluorescence intensity in cells co-transfected with Lyn-TrkAICD-AuLOV-VN and Lyn-TrkAICD-AuLOV-VC. Images of the same cells were acquired before and after blue light treatment. (E) Intensity quantification along four dash-line profiles outlined in (D). (F-G) Same as (D-E) except that a No AuLOV control, Lyn-TrkAICD-VN and Lyn-TrkAICD-VC, is used. The same blue light illumination does not enhance the fluorescence intensity. (H) Structured illumination microscopy (SIM) images of MDA-MB-231 cells expressing WT ICD (top panels) or No AuLOV control (bottom panels) before and after blue light (405 nm) irradiation. (I) Quantification of the fraction of images whose intensity is above a threshold set at 50% of the maximum intensity of the background-subtracted images. Scale bar = 10 μm.
Figure 3.
Figure 3.. Optogenetic TrkA promotes PC12 cell differentiation in response to blue-light stimulation.
(A) Image for reference depicting differentiated (yellow box) and undifferentiated (red box) PC12 cells transfected with No ICD and treated with 50 ng/mL NGF for 24 hours. (B) Differentiation ratios calculated for PC12 cells transiently expressing WT ICD or No ICD. Transfected cells were illuminated with 300 μW/cm2 blue light or kept in the dark for 44 hours prior to imaging. WT ICD mediated significant light-induced differentiation compared to No ICD. Cells expressing No ICD in the presence of 50 ng/mL NGF underwent robust differentiation in a light-independent manner. Values represent the mean ± standard deviation of three biological replicates (n=3) with >70 cells counted per replicate. (C) Differentiation ratios calculated for PC12 cells transiently expressing variants of the optogenetic TrkA system. Transfected cells were illuminated with 300 μW/cm2 blue light for 24 hours prior to imaging. Y490F and Y785F showed a significant reduction in light-induced differentiation compared to WT ICD. Y490/785F resulted in a differentiation ratio similar to that of No ICD. Values represent the mean ± standard deviation of two biological replicates (n=2) with >900 cells counted per replicate. (D) Representative fluorescence images of the conditions reported in (C). Scale bar = 50 μm.
Figure 4.
Figure 4.. Light-induced optogenetic TrkA mutants differentially activate the ERK and PLCγ pathways.
Western blot analysis of light-induced (A) ERK and (B) PLCγ activity exhibited by PC12 cells transiently expressing variants of the optogenetic TrkA system. Transfected cells were serum-starved overnight following transfection, and were illuminated with 5 mW/cm2 blue light or kept in the dark for 10 minutes prior to lysis. Compared to WT ICD, Y490F displayed a dramatic reduction in ERK activity with no change in PLCγ activity. Y785F showed a relatively modest reduction in ERK activity with nearly abrogated PLCγ activity. Y490/785F showed no light-induced activity for either pathway, similar to No ICD. Values represent the mean ± standard deviation of three separate experiments (n=3) for ERK and two separate experiments (n=2) for PLCγ. (C) Western blot analysis of system expression by probing GFP. Expression level across samples fluctuates within 16%.
Figure 5.
Figure 5.. Y490F-mediated ERK signaling is abolished by PLCγ-PKC inhibitors.
(A) Western blot analysis of light-induced ERK activity exhibited by PC12 cells transiently expressing Y490F. Transfected cells were serum-starved overnight following transfection and were treated with a PLCγ inhibitor (U73122, 1 μM) or a PKC inhibitor (GF 109203X, 1 μM) for 10 minutes prior to illumination. Cells were subsequently illuminated with 5 mW/cm2 blue light or kept in the dark for 10 minutes prior to lysis. Cells treated with U73122 or GF 109203X had abolished light-induced ERK activity compared to the untreated control. Values represent the mean ± standard deviation of two separate experiments (n=2) for untreated, and four separate experiments (n=4) for U73122 and GF 109203X. (B) Western blot analysis of system expression by probing GFP. Expression level for illuminated conditions fluctuates within 14%. (C) Differentiation ratios calculated for PC12 cells transiently expressing Y490F in the presence of U73122 (1 μM) or GF 109203X (1 μM). Inhibitors were added to cells 1 hour prior to illumination. Cells were illuminated with 300 μW/cm2 blue light for 24 hours prior to imaging. Cells treated with U73122 or GF 109203X had decreased light-induced differentiation compared to the untreated control, which received inhibitor vehicle (DMSO). Values represent the mean ± standard deviation of three biological replicates (n=3) with >40 cells counted per replicate (D) Representative fluorescence images of the conditions reported in (C). Scale bar = 50 μm.
Figure 6.
Figure 6.. Proposed model for the role of Y490 and Y785 in TrkA-mediated PC12 cell differentiation.
The Raf/MEK/ERK signaling cascade, primarily instigated by Y490 of TrkA, is essential for PC12 cell differentiation. Y785 instigates the PLCγ-PKC pathway, which feeds into the Raf/MEK/ERK signaling cascade. Mutating Y785 or inhibiting the PLCγ-PKC pathway results in diminished receptor-mediated ERK signaling and differentiation in PC12 cells.
Figure 7.
Figure 7.. NGF elicits higher ERK activity compared to optogenetic TrkA and NGF-mediated PC12 cell differentiation is reduced by pharmacological inhibition of PLCγ and PKC in a dose-dependent manner.
(A) Western blot analysis of two separate experiments. Transfected cells (No ICD and WT ICD) were serum-starved overnight following transfection. Cells were illuminated with 5 mW/cm2 blue light or kept in the dark for 10 minutes prior to lysis. (B) Untransfected cells were serum-starved overnight prior to treatment. Cells were untreated or treated with NGF (100 ng/mL) for 5 minutes prior to lysis. The ERK activity mediated by optogenetic TrkA was lower than that of NGF. (C) Western blot analysis of ERK signaling mediated by long-term NGF or WT ICD activity. PC12 cells were transfected with WT ICD and serum-starved overnight following transfection. Cells were then kept in the dark, illuminated with 300 μW/cm2 blue light, or treated with NGF (50 ng/mL) for 4 or 24 hours prior to lysis. Untreated cells received NGF vehicle (sodium acetate). NGF stimulation elicited higher ERK activity than WT ICD for both durations. All samples are normalized to Lane 1. (D) Differentiation ratios for PC12 cells treated with NGF in the presence of U73122 or GF 109203X. Serum-starved cells were treated with inhibitors (1, 5, 7.5, 10, and 20 μM) 1 hour prior to NGF treatment. Cells were treated with NGF (50 ng/mL) for 24 hours. Cells were stained with 1 μM Calcein AM 10 minutes before imaging. NGF-induced PC12 cell differentiation was reduced by U73122 or GF 109203X in a dose-dependent manner. Untreated cells received NGF vehicle (sodium acetate) and inhibitor vehicle (DMSO). Values represent the mean ± standard deviation of two biological replicates (n=2) with >400 cells counted per replicate.

Similar articles

Cited by

References

    1. Arcaro A, and Wymann MP (1993). Wortmannin Is a Potent Phosphatidylinositol 3-Kinase Inhibitor - the Role of Phosphatidylinositol 3,4,5-Trisphosphate in Neutrophil Responses. Biochem J 296, 297–301. - PMC - PubMed
    1. Bae SS, Lee YH, Chang JS, Galadari SH, Kim YS, Ryu SH, and Suh PG (1998). Src homology domains of phospholipase C gamma 1 inhibit nerve growth factor-induced differentiation of PC12 cells. Journal of neurochemistry 71, 178–185. - PubMed
    1. Barker PA (1998). p75NTR: A study in contrasts. Cell death and differentiation 5, 346–356. - PubMed
    1. Bassili M, Birman E, Schor NF, and Saragovi HU (2010). Differential roles of Trk and p75 neurotrophin receptors in tumorigenesis and chemoresistance ex vivo and in vivo. Cancer Chemoth Pharm 65, 1047–1056. - PMC - PubMed
    1. Bothwell M (1995). Functional interactions of neurotrophins and neurotrophin receptors. Annual review of neuroscience 18, 223–253. - PubMed

Publication types

MeSH terms

LinkOut - more resources