

EGFR-Targeted Immunotoxin Exerts Antitumor Effects on Esophageal Cancers by Increasing ROS Accumulation and Inducing Apoptosis via Inhibition of the Nrf2-Keap1 Pathway
- PMID: 30596104
- PMCID: PMC6286775
- DOI: 10.1155/2018/1090287
EGFR-Targeted Immunotoxin Exerts Antitumor Effects on Esophageal Cancers by Increasing ROS Accumulation and Inducing Apoptosis via Inhibition of the Nrf2-Keap1 Pathway
Abstract
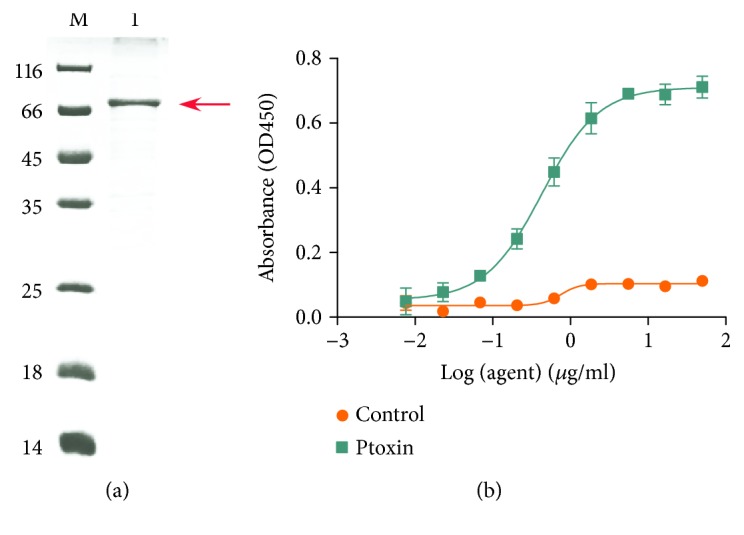
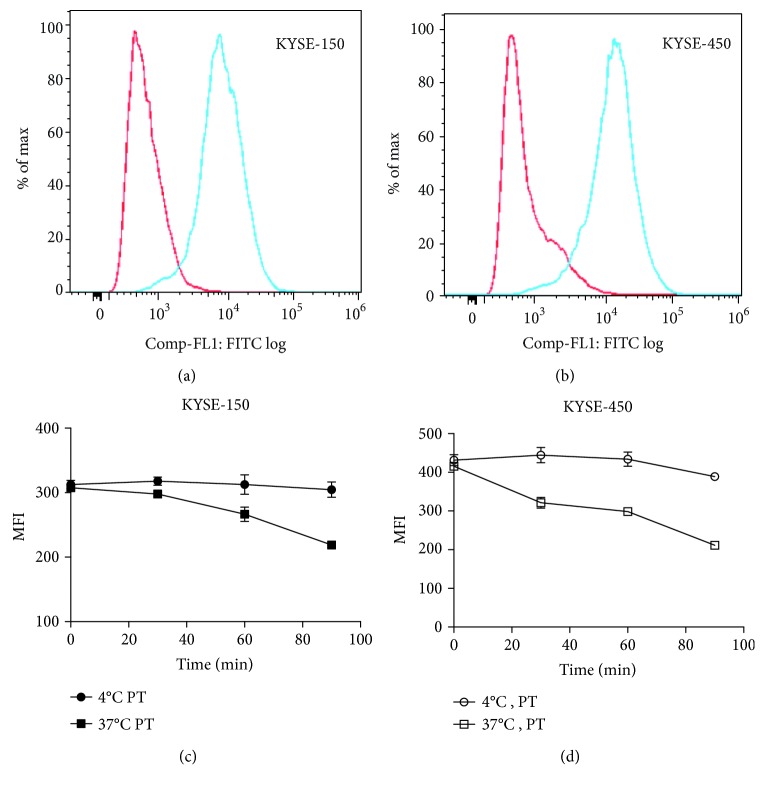
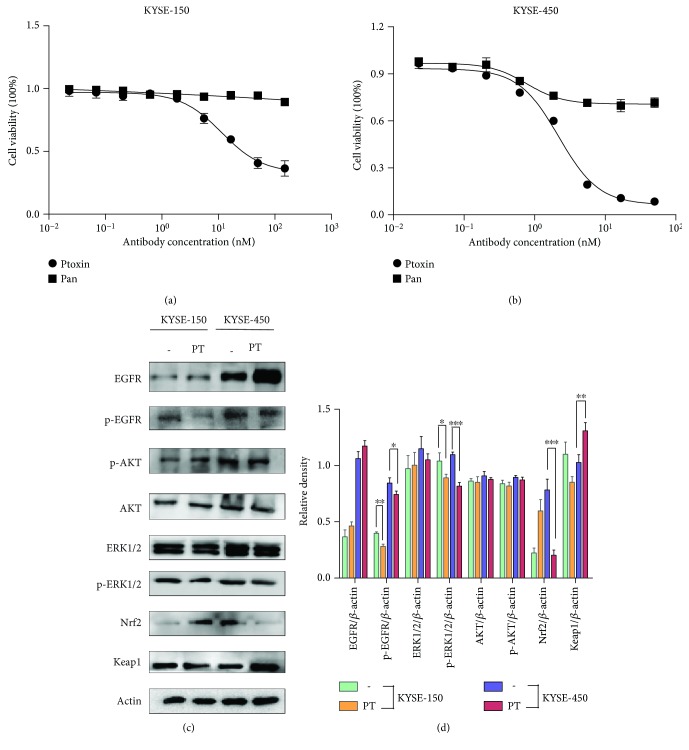
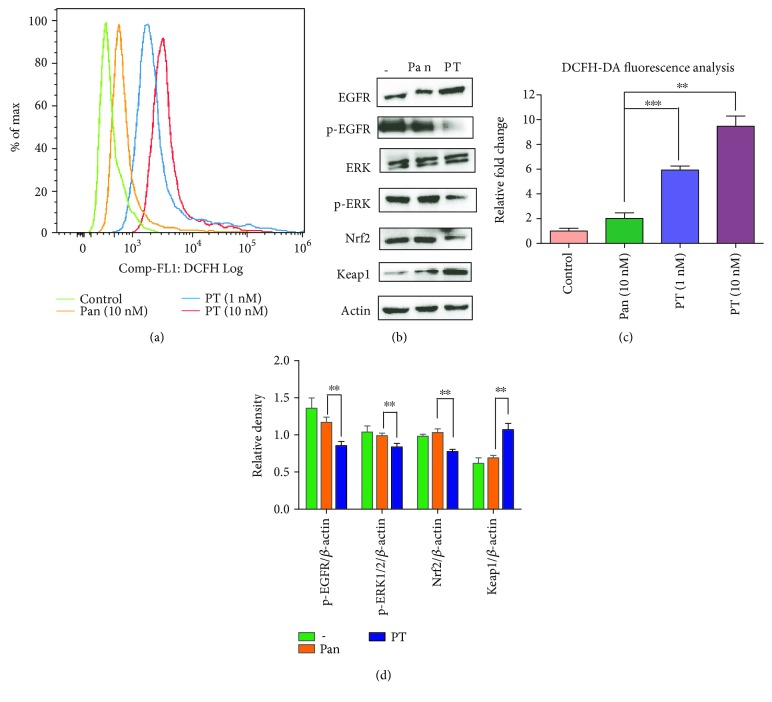
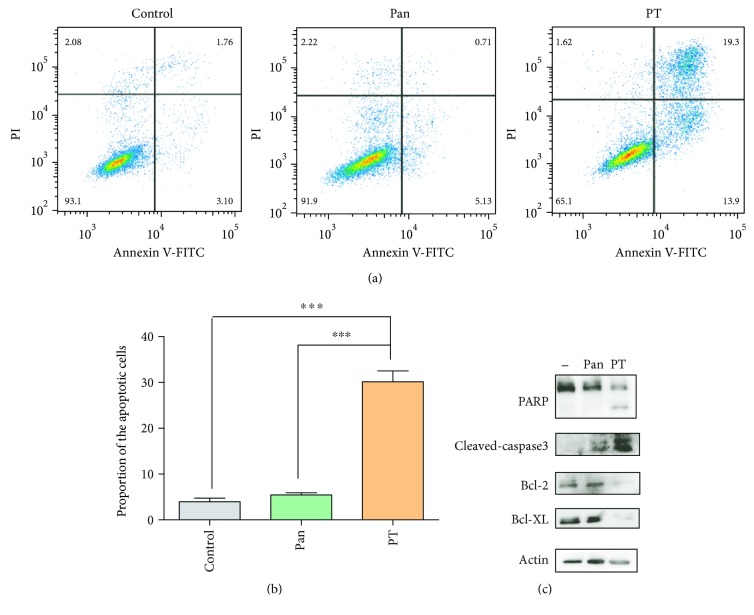
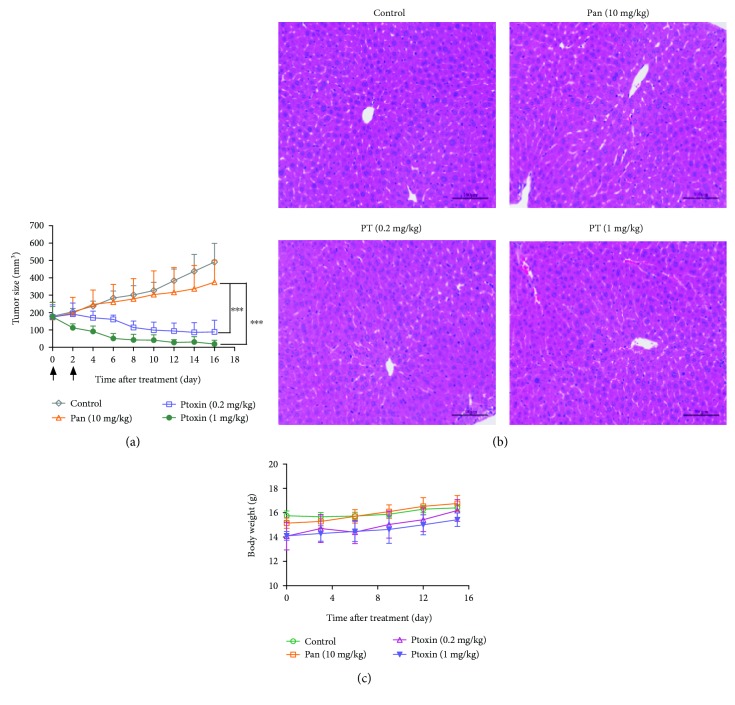
Previously, we developed a novel EGFR-targeted antibody (denoted as Pan), which has superior antitumor activity against EGFR-overexpressed tumors. However, it shows marginal effect on the growth of esophageal cancers. Therefore, the variable region of Pan was fused to a fragment of Pseudomonas exotoxin A (PE38) to create the immunotoxin, denoted as Ptoxin (PT). Results indicated that PT shows more effective antitumor activity as compared with Pan both on EGFR-overexpressed KYSE-450 and KYSE-150 esophageal cancer cells, especially on KYSE-450 cells. Moreover, treatment of PT induces regression of KYSE-450 tumor xenografts in nude mice. Furthermore, we investigated the potential mechanism involved in the enhanced antitumor effects of PT. Data showed that PT was more potent in reducing the phosphorylation of EGFR and ERK1/2. More importantly, we for the first time found that PT was more effective than Pan in inducing ROS accumulation by suppression of the Nrf2-Keap1 antioxidant pathway, and then induced apoptosis in KYSE-450 esophageal cancer cells, which may partly explain the more sensitive response of KYSE-450 to PT treatment. To conclude, our study provides a promising therapeutic approach for immunotoxin-based esophageal cancer treatment.
Figures
Similar articles
-
Immunotoxin targeting glypican-3 regresses liver cancer via dual inhibition of Wnt signalling and protein synthesis.Nat Commun. 2015 Mar 11;6:6536. doi: 10.1038/ncomms7536. Nat Commun. 2015. PMID: 25758784 Free PMC article.
-
A protease-resistant immunotoxin against CD22 with greatly increased activity against CLL and diminished animal toxicity.Blood. 2009 Apr 16;113(16):3792-800. doi: 10.1182/blood-2008-08-173195. Epub 2008 Nov 6. Blood. 2009. PMID: 18988862 Free PMC article.
-
An epidermal growth factor receptor-targeting immunotoxin based on IgG shows potent antitumor activity against head and neck cancer.FASEB J. 2024 Jul 15;38(13):e23759. doi: 10.1096/fj.202301968R. FASEB J. 2024. PMID: 38949635
-
Immunotoxin therapy for cancer.JAMA. 1993 Jan 6;269(1):78-81. JAMA. 1993. PMID: 8416411 Review. No abstract available.
-
Quantification of immunotoxin number for complete therapeutic response.Methods Mol Biol. 2001;166:111-23. doi: 10.1385/1-59259-114-0:111. Methods Mol Biol. 2001. PMID: 11217362 Review. No abstract available.
Cited by
-
Protecting Effect of Bacillus coagulans T242 on HT-29 Cells Against AAPH-Induced Oxidative Damage.Probiotics Antimicrob Proteins. 2022 Aug;14(4):741-750. doi: 10.1007/s12602-022-09917-5. Epub 2022 May 2. Probiotics Antimicrob Proteins. 2022. PMID: 35501534
-
Time series expression pattern of key genes reveals the molecular process of esophageal cancer.Biosci Rep. 2020 Feb 28;40(2):BSR20191985. doi: 10.1042/BSR20191985. Biosci Rep. 2020. PMID: 32068233 Free PMC article.
-
Gefitinib induces apoptosis in Caco-2 cells via ER stress-mediated mitochondrial pathways and the IRE1α/JNK/p38 MAPK signaling axis.Med Oncol. 2025 Feb 10;42(3):71. doi: 10.1007/s12032-025-02622-7. Med Oncol. 2025. PMID: 39924616
-
Advances and challenges in the treatment of esophageal cancer.Acta Pharm Sin B. 2021 Nov;11(11):3379-3392. doi: 10.1016/j.apsb.2021.03.008. Epub 2021 Mar 9. Acta Pharm Sin B. 2021. PMID: 34900524 Free PMC article. Review.
-
ROS-Mediated Therapeutic Strategy in Chemo-/Radiotherapy of Head and Neck Cancer.Oxid Med Cell Longev. 2020 Jul 22;2020:5047987. doi: 10.1155/2020/5047987. eCollection 2020. Oxid Med Cell Longev. 2020. PMID: 32774675 Free PMC article. Review.
References
MeSH terms
Substances
LinkOut - more resources
Full Text Sources
Medical
Research Materials
Miscellaneous
