. 2018;6(4):316.
doi: 10.4172/2329-6488.1000316. Epub 2018 Aug 31.

Trichostatin A Shows Transient Protection from Chronic Alcohol-Induced Reactive Oxygen Species (ROS) Production in Human Monocyte-Derived Dendritic Cells

Affiliations

Trichostatin A Shows Transient Protection from Chronic Alcohol-Induced Reactive Oxygen Species (ROS) Production in Human Monocyte-Derived Dendritic Cells

Tiyash Parira et al. J Alcohol Drug Depend. 2018.

Abstract

Objective: The objective of this study was to understand whether histone deacetylase (HDACs) inhibitor Trichostatin A or TSA can block and/or reverse chronic alcohol exposure-induced ROS in human monocyte-derived dendritic cells (MDDCs). Additionally, since nuclear factor (erythroid-derived 2)-like 2 (Nrf2) is a known regulator of antioxidant responses, we studied the effects of alcohol and TSA on ROS production and modulation of Nrf2 by MDDCs.

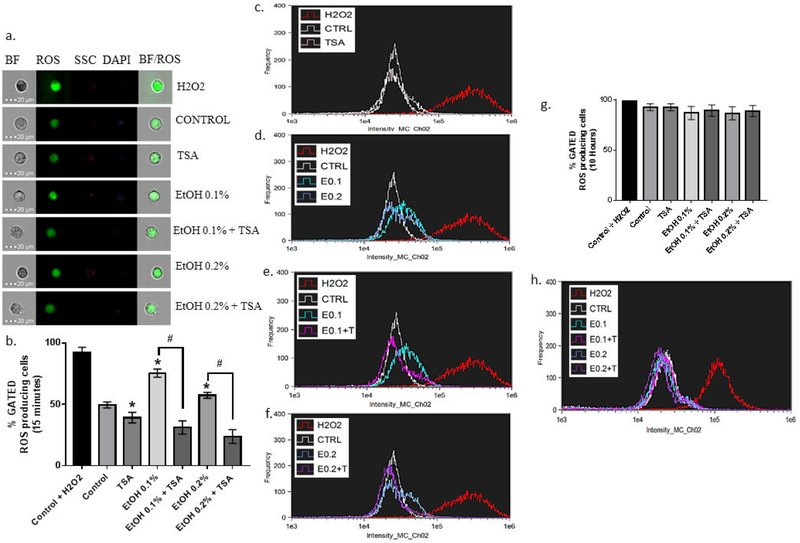
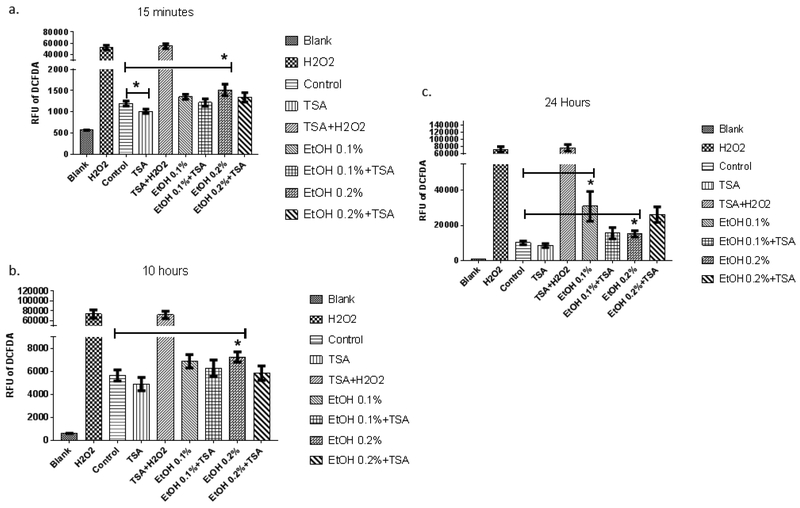
Methods: Intra-cellular, extra-cellular, and total ROS levels were measured in MDDCs treated chronically with alcohol (0.1 and 0.2 % EtOH) using 2',7'-dichlorofluorescin diacetate (DCF-DA) followed by detection of ROS in microplate reader and imaging flow cytometer. Nrf2 expression was analyzed by qRT- PCR and western blot. In addition, NFE2L2 (Nrf2), class I HDAC genes HDAC1, HDAC2, and histone acetyltransferase genes KAT5 were analyzed in silico using the GeneMania prediction server.

Results: Our results confirmed alcohol's ability to increase intracellular ROS levels in MDDCs within minutes of treatment. Our findings have also demonstrated, for the first time, that TSA has a transient protective effect on MDDCs treated chronically with alcohol since the ability of TSA to reduce intracellular ROS levels is only detected up to 15 minutes post-chronic alcohol treatment with no significant protective effects by 10 hours. In addition, chronic alcohol treatment was able to increase the expression of the antioxidant regulator Nrf2 in a dose dependent manner, and the effect of the higher amount of alcohol (0.2%) on Nrf2 gene expression was significantly enhanced by TSA.

Conclusion: This study demonstrates that TSA has a transient protective effect against ROS induced by chronic alcohol exposure of human MDDCs and chronic long-term exposure of MDDCs with alcohol and TSA induces cellular toxicity. It also highlights imaging flow cytometry as a novel tool to detect intracellular ROS levels. Overall, the effect of TSA might be mediated through Nrf2; however, further studies are needed to fully understand the molecular mechanisms.

Keywords: Human dendritic cells; Imaging flow cytometry; Oxidative stress; Reactive oxygen species; Trichostatin A.


Conflict of interest statement

Conflict of Interest The authors declare no competing interests.

Figures

Figure 1:
Figure 1:
Alcohol increases intracellular ROS levels within minutes and this effect is transiently blocked by TSA: After five days of chronic alcohol exposure, cells were retreated with TSA for two hours, DCF-DA was added followed by EtOH, then intracellular ROS levels were analyzed in MDDCs by single cell imaging flow cytometry. Panel a shows representative single cell images where column 1 is BF or Bright Field, column 2 is ROS or DCF-DA, column 3 is SSC or Side Scatter, column 4 is DAPI or viability dye and column 5 is BF/ROS or overlay of Bright Field and ROS or DCF-DA image. Panel b shows percentage of ROS positive cells for each treatment. Significant effect was observed [F (6,50)=30.05, p<0.0001]. Post hoc comparisons using the Tukey’s multiple comparisons test indicated that the mean score for EtOH 0.1% (M=75.46, SEM=3.371, p=0.0005) and EtOH 0.2% (M=57.47, SEM=2.418, p=0.0001) was significantly different than EtOH 0.1%+TSA and EtOH 0.2%+TSA condition (M=31.17, SEM=5.419; M=23.09, SEM=5.586). Panel c show representative histogram overlays of intensity of ROS for all treatments. Panel g shows percentage of ROS positive cells at 10 h post DCF-DA and EtOH treatment [F (6, 32)=0.675, p=0.6706]. Panel h shows a representative histogram overlay of intensity of ROS after 10 h. post DCF-DA and EtOH treatment. The experiment was carried out from 5 different buffy coats. 1-way ANOVA was carried out to test for significance. Data represented as Mean ± SEM with * representing p ≤ 0.05.
Figure 2:
Figure 2:
TSA has a temporal effect on alcohol-mediated extracellular ROS production. To corroborate the protective effect of TSA, extracellular ROS levels were measured by plate reader at different time points after adding DCF-DA and re-treating the cells with alcohol. Panel a, b and c: is a graphical representation of extracellular ROS levels as measured in supernatants of cells after adding DCF-DA and retreatment with EtOH after 15 minutes (panel a), 10 h. (panel b) and 24 h. (panel c). The experiment was done from 3 different buffy coats and each treatment plated in quadruplets. For panel a, at 15 minutes, 2-way ANOVA showed significant row factor (F (12, 60)=14.81, p<0.0001) and significant column factor (F (5, 60)=1.15, p<0.0001). Post hoc analysis by Tukey’s multiple comparisons test showed mean for EtOH 0.2% (M = 1513.85, SEM=135, p=0.006) was significantly different compared to control (M=1195.9, SEM=59.2). When analyzed by paired T-Test, TSA (M=1013.2, SEM=49.9, p=0.03) showed significant difference compared to control, however, Tukey’s multiple comparisons test was not significant for the same. For panel b at 10 h, 2-way ANOVA showed significant row factor (F (11, 55)=150.8, p<0.0001) and significant column factor (F (5, 55)=11.92, p<0.0001). Post hoc analysis by Tukey’s multiple comparisons test showed mean for EtOH 0.2% (M=7241, SEM=452, p<0.0001) was significantly different compared to control (M=5644.6, SEM=479). For panel c at 24 h, 2-way ANOVA showed significant row factor (F (11, 55)=2.532, p=0.0116) and significant column factor (F (5, 55)=5.128, p=0.0006). Post hoc analysis by Tukey’s multiple comparisons test showed EtOH 0.1% (M=30910, SEM = 8492, p=0.0058) was significantly different compared to control (M=10055.6, SEM=1063.9). When analyzed by paired T-Test, EtOH 0.2% ( (M=15149, SEM=1804, p=0.02 showed significant difference compared to control, however, Tukey’s multiple comparisons test was not significant for the same. 2-way ANOVA with post hoc analysis of Tukey’s multiple comparisons test and paired T-test were carried out to test for significance. Data represented as Mean ± SEM with * representing p ≤ 0.05.
Figure 3:
Figure 3:
Alcohol increases total ROS production over time and this effect plateaus by 12 h. After chronic treatment of MDDCs, cells were harvested, plated and treated with TSA followed by DCF-DA and retreated with EtOH and total ROS production (intra-cellular and extracellular) by MDDCs was measured. Panel a, MDDCs chronically treated with 0.1 or 0.2% EtOH show upregulated ROS production compared to control MDDCs as measured by relative fluorescence units (RFU) of total ROS levels. 2-way ANOVA showed significant row factor (F (10, 670)=91.92, p<0.0001) and post hoc analysis with Tukey’s multiple comparisons test did not find any significant difference between control, EtOH 0.1% and EtOH 0.2%. In panel b, total ROS levels measured at different time points for MDDCs chronically treated with 50 nM TSA are plotted along with untreated control, positive control H2O2 treated MDDCs, and for blank or no cells. 2-way ANOVA showed significant row factor (F (10,373)=138, p<0.0001) and significant column factor (F (1, 373)=30.65, p<0.0001). Post hoc analysis with Sidak’s multiple comparisons test shows at 9th h, mean for TSA (M=3507.8, SEM=129.9, p=0.059) showed significant difference compared to control (M=4109.1, SEM=257.7). At 10th h, mean for TSA (M=3873.6, SEM=51.4, p=0.007) showed significant difference compared to control. Finally, at 12th h, mean for TSA (M=4604.9, SEM=195.9, p=0.0001) showed significant difference compared to control. Panel c, MDDCs treated with EtOH 0.1% and TSA show reduced ROS levels compared to MDDCs treated with EtOH 0.1% only. 2-way ANOVA showed significant row factor (F (10, 578)=75.68, p<0.0001) and significant column factor (F (1, 578)=6.625, p=0.0103). Post hoc analysis with Sidak’s multiple comparisons test shows at 12 h, mean for EtOH 0.1%+TSA (M=5263.1, SEM=348, p=0.003) showed significant difference compared to EtOH 0.1% (M = 6333.9, SEM = 496.9). In Panel d, MDDCs treated with EtOH 0.2% and TSA show reduced ROS levels compared to MDDCs treated with EtOH 0.2% only. 2-way ANOVA showed significant interaction (F (10, 562)=7.345, p<0.0001), significant row factor (F (10, 562)=111.7, p<0.0001) and significant column factor (F (1, 562)=4.966, p=0.0262). However, post hoc analysis with Sidak’s multiple comparisons test did not find any significant difference between EtOH 0.2% and EtOH 0.2% + TSA up to 12 h. At 20th, 22nd and 24th h, there is significant difference between EtOH 0.2% +TSA (20th h: M=5370, SEM=59.6, p=0.02, 22nd h: M=5801, SEM=63.1, p=0.005, 24th h: M=6232, SEM=63.8, p=0.0009) and EtOH 0.2% (20th h: M=4029, SEM=83.1, 22nd h: M=4260, SEM=101.2, 24th h: M=4495, SEM=119). The experiment was carried out from 3 buffy coats and each treatment was plated at least in quadruplets. 2-way ANOVA was used to test for significance. Sidak’s multiple comparisons test was used when comparing two treatments while Tukey’s multiple comparisons test was used when comparing more than two treatments. Data represented as Mean RFU ± SEM with * representing p ≤ 0.05.
Figure 4:
Figure 4:
Alcohol and TSA modulate the antioxidant regulator Nrf2 possibly by interactions between HDACs, HATs and Nrf2. Post chronic treatments, total RNA and protein were isolated. Nrf2 gene expression was studied through reverse transcription qPCR and represented as Transcript Accumulation Index (TAI) [50] in panel a. 2-way ANOVA showed significant column factor [F (5,65)=38.33, p<0.0001]. Post hoc comparisons using the Tukey’s multiple comparisons test indicated that the mean score for EtOH 0.2% (M=9.937, SEM=1.308, p=0.0007) was significantly different than control. EtOH 0.1% (M=2.04, SEM=0.4, p=0.02) was significantly different than control. EtOH 0.2% + TSA condition (M=18.01, SEM=2.3, p=0.006) was significantly different than EtOH 0.2%. Western blotting was used to visualize protein expression as shown in panel b. The qPCR and western blot experiments were carried out from 5 different buffy coats. Representative western blot is depicted in Figure 4, panel b. Optical density accounts for 33.11% of the total variance [F (4, 20) = 3.996, p=0.0153]. Post hoc Tukey’s multiple comparisons tests showed no significance between treatments, only a variance between optical densities of Nrf2. Statistical test 2 way ANOVA was carried out to test for significance. Data are represented as mean ± SEM with ‘representing p ≤ 0.05. In silico analysis in panel c show, genes for Nrf2 (NFE2L2), HDAC1 and HDAC2 and histone acetyl transferase (HAT) TIP60 gene KAT5 interact primarily through physical interactions and co-expression.

Similar articles

Cited by

References

    1. Wu D, Zhai Q, Shi X (2006) Alcohol-induced oxidative stress and cell responses. J Gastroenterol Hepatol 21 Suppl 3: S26–S29. - PubMed
    1. Boule LA (2017) Summary of the 2016 alcohol and immunology research interest group (AIRIG) meeting. Alcohol 2017. - PMC - PubMed
    1. Nagy LE (2015) The role of innate immunity in alcoholic liver disease. Alcohol Res 37: 237–250. - PMC - PubMed
    1. Samuelson DR (2017) The respiratory tract microbial biogeography in alcohol use disorder. Am J Physiol Lung Cell Mol Physiol pp: ajplung. 00277.2017. - PMC - PubMed
    1. Lohman RJ (2016) Differential anti-inflammatory activity of hdac inhibitors in human macrophages and rat arthritis. J Pharmacol Exp Ther 356: 387–396. - PubMed

LinkOut - more resources