

In situ protein micro-crystal fabrication by cryo-FIB for electron diffraction
- PMID: 30596142
- PMCID: PMC6276065
- DOI: 10.1007/s41048-018-0075-x
In situ protein micro-crystal fabrication by cryo-FIB for electron diffraction
Abstract
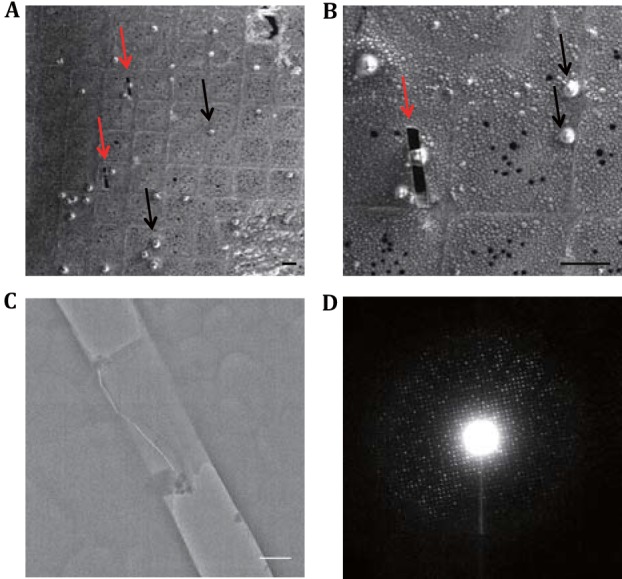
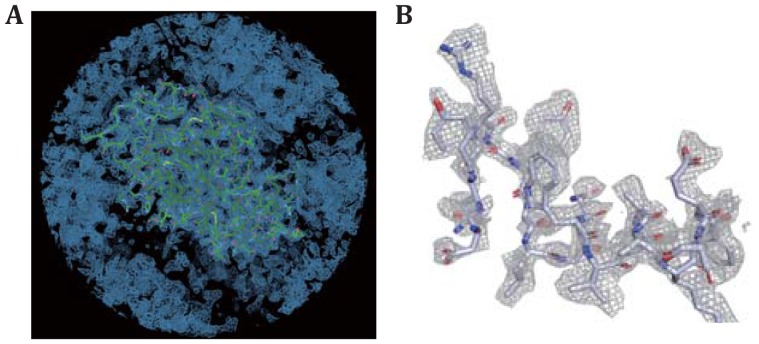
Micro-electron diffraction (MicroED) is an emerging technique to use cryo-electron microscope to study the crystal structures of macromolecule from its micro-/nano-crystals, which are not suitable for conventional X-ray crystallography. However, this technique has been prevented for its wide application by the limited availability of producing good micro-/nano-crystals and the inappropriate transfer of crystals. Here, we developed a complete workflow to prepare suitable crystals efficiently for MicroED experiment. This workflow includes in situ on-grid crystallization, single-side blotting, cryo-focus ion beam (cryo-FIB) fabrication, and cryo-electron diffraction of crystal cryo-lamella. This workflow enables us to apply MicroED to study many small macromolecular crystals with the size of 2-10 μm, which is too large for MicroED but quite small for conventional X-ray crystallography. We have applied this method to solve 2.5 Å crystal structure of lysozyme from its micro-crystal within the size of 10 × 10 × 10 μm3. Our work will greatly expand the availability space of crystals suitable for MicroED and fill up the gap between MicroED and X-ray crystallography.
Keywords: Cryo focused ion beam; Cryo-electron microscopy; Electron diffraction; In situ crystallization; Micro-crystal.
Conflict of interest statement
Xinmei Li, Shuangbo Zhang and Fei Sun declare that they have no conflict of interest.This article does not contain any studies with human or animal subjects performed by any of the authors.The raw TIFF files of diffraction images, the program to convert TIFF files to OSC files, the final merged structural factor MTZ file as well as the refined model PDB file are available at the webpage of the lab (http://feilab.ibp.ac.cn/data/FIB-MicroED).
Figures


References
-
- Chapman HN, Fromme P, Barty A, White TA, Kirian RA, Aquila A, Hunter MS, Schulz J, DePonte DP, Weierstall U, Doak RB, Maia FR, Martin AV, Schlichting I, Lomb L, Coppola N, Shoeman RL, Epp SW, Hartmann R, Rolles D, Rudenko A, Foucar L, Kimmel N, Weidenspointner G, Holl P, Liang M, Barthelmess M, Caleman C, Boutet S, Bogan MJ, Krzywinski J, Bostedt C, Bajt S, Gumprecht L, Rudek B, Erk B, Schmidt C, Hömke A, Reich C, Pietschner D, Strüder L, Hauser G, Gorke H, Ullrich J, Herrmann S, Schaller G, Schopper F, Soltau H, Kühnel KU, Messerschmidt M, Bozek JD, Hau-Riege SP, Frank M, Hampton CY, Sierra RG, Starodub D, Williams GJ, Hajdu J, Timneanu N, Seibert MM, Andreasson J, Rocker A, Jönsson O, Svenda M, Stern S, Nass K, Andritschke R, Schröter CD, Krasniqi F, Bott M, Schmidt KE, Wang X, Grotjohann I, Holton JM, Barends TR, Neutze R, Marchesini S, Fromme R, Schorb S, Rupp D, Adolph M, Gorkhover T, Andersson I, Hirsemann H, Potdevin G, Graafsma H, Nilsson B, Spence JC (2011) Femtosecond X-ray protein nanocrystallography. Nature 470:73–77 - PMC - PubMed
LinkOut - more resources
Full Text Sources
Miscellaneous