Review
. 2018;3(1):51.
doi: 10.1007/s41109-018-0107-y. Epub 2018 Dec 17.

Network spectra for drug-target identification in complex diseases: new guns against old foes

Affiliations
Review

Network spectra for drug-target identification in complex diseases: new guns against old foes

Aparna Rai et al. Appl Netw Sci. 2018.

Abstract

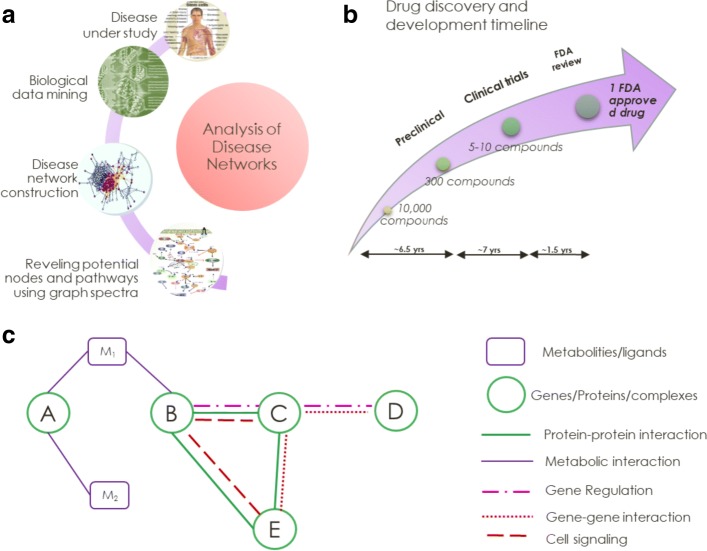
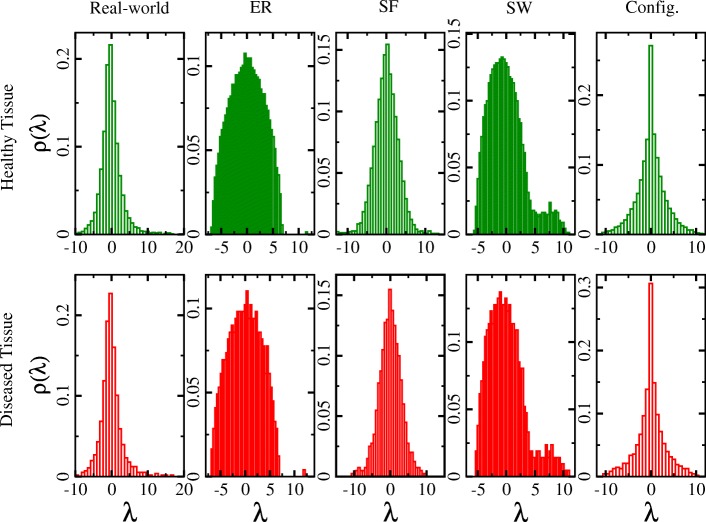
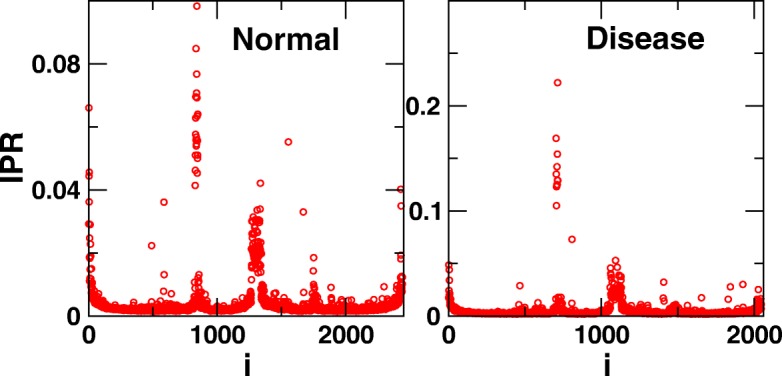
The fundamental understanding of altered complex molecular interactions in a diseased condition is the key to its cure. The overall functioning of these molecules is kind of jugglers play in the cell orchestra and to anticipate these relationships among the molecules is one of the greatest challenges in modern biology and medicine. Network science turned out to be providing a successful and simple platform to understand complex interactions among healthy and diseased tissues. Furthermore, much information about the structure and dynamics of a network is concealed in the eigenvalues of its adjacency matrix. In this review, we illustrate rapid advancements in the field of network science in combination with spectral graph theory that enables us to uncover the complexities of various diseases. Interpretations laid by network science approach have solicited insights into molecular relationships and have reported novel drug targets and biomarkers in various complex diseases.

Keywords: Biomarkers; Disease networks; Network spectra; Random matrix theory (RMT); Systems biology.


Conflict of interest statement

The authors declare that they have no competing interests.Springer Nature remains neutral with regard to jurisdictional claims in published maps and institutional affiliations.

Figures

Fig. 1
Fig. 1
Representative diagrams. a Steps to identify drug targets using network spectra. Step-wise, it involves biological data mining of disease in interest, it can be any biological data such as of sequence data, expression data etc. Further, disease network is constructed using the biological data and after that various techniques in spectral graph theory are exploited to identify important information in networks. b Drug discovery and development timeline. It starts from target identification to pre-clinical studies, to 4 tier clinical trails. From start to finish, the entire drug development process usually spans about 8 to 12 years, leaving drug developers with around a decade or less of patent exclusivity on branded drugs once they make it to market. c Types of biological interactions that can be represented by networks. Molecular interactions are effects that biomolecules have on each other. Since there are variety of biomolecules present such as proteins, DNA, there are diverse types of interactions among biomolecules are possible
Fig. 2
Fig. 2
Eigenvalues Distribution. The eigenvalues distribution plotted for healthy (network size (N) = 2083, average degree (〈K〉) = 10) and the diseased (N = 656, 〈K〉 = 11) tissues PPI networks of Diabetes Mellitus proteomics data. Also, random networks were constructed using network information corresponding PPI network data. The eigenvalue statistics of PPI reflects typical triangular shape with the tail of the distribution relating with the exponent of the power law of degree distribution as observed for many other biological and real-world networks. ER networks show typical semi-circular shaped distribution. Apart from that SW, SF and configuration model network show different patterns of distribution than their corresponding PPI networks suggesting PPI networks display different behavior than random network
Fig. 3
Fig. 3
Zero Degeneracy. Schematic diagram representing (a) complete node duplication and (b) partial node duplication in networks. Biological networks know to posses a higher degeneracy at the zero eigenvalue than corresponding random networks. The degeneracy at the zero eigenvalue is signature of presence of node duplication in the network. The detailed explanation is given in Table 3
Fig. 4
Fig. 4
Eigenvector Localization. The figure shows IPR of both disease and normal networks, clearly reflecting three regions (i) degenerate part in the middle, (ii) a large non-degenerate part which follow GOE statistics of RMT and (iii) non-degenerate part at both the end and near to the zero eigenvalues which deviate from RMT (Rai et al. 2014). Moreover, the nodes corresponding to the structures prescribed by the localized eigenvectors can be identified in the networks to further exploit them for the deeper biological understanding
Fig. 5
Fig. 5
Local structure of top contributing nodes (TCNs). Left panel denotes the local structure of all TCNs in the disease network whereas right panel denotes the local structure for the same proteins in the normal network. Yellow represents TCNs and pink represent their first neighbor. The TCNs, in addition to the functional importance pertaining to the occurrence of the disease state revealed, exhibits interesting structural properties. This is more remarkable in the light that all of these TCNs lie in the low degree regime in the networks. Moreover, their betweenness centrality also are zero further ruling out any trivial structural significance of these nodes. But importance of these nodes based on the analysis of their interactions reveals the existence of preserved local structural patterns. Most strikingly, all of them follow phenomenon of gene duplication which shows TCNs being involved in the pair formation in which first node in each pair has exactly the same neighbors as of the second node. Most remarkably, there are 20 duplicates (proteins having the same number of neighbors and having more than one connection) in the whole network of which 18 are found in the TCNs of the most localized eigenvectors (Rai et al. 2014)

Similar articles

Cited by

References

    1. Agrawal A, et al. Quantifying randomness in protein-protein interaction networks of different species: A random matrix approach. Phys A. 2014;404:359–367. doi: 10.1016/j.physa.2013.12.005. - DOI
    1. Aguirre-Plans J, et al. Proximal Pathway Enrichment Analysis for Targeting Comorbid Diseases via Network Endopharmacology. Pharmaceuticals. 2018;11(3):61. doi: 10.3390/ph11030061. - DOI - PMC - PubMed
    1. Albert R, Barabási A. Statistical mechanics of complex networks. Rev Mod Phys. 2002;74:47–97. doi: 10.1103/RevModPhys.74.47. - DOI
    1. AlQuraishi M, et al. A multiscale statistical mechanical framework integrates biophysical and genomic data to assemble cancer networks. Nat Genet. 2014;46:1363–71. doi: 10.1038/ng.3138. - DOI - PMC - PubMed
    1. Alyass A, Turcotte M, Meyre D From big data analysis to personalized medicine for all: challenges and opportunities. BMC Med Genomics. 2015;8:33. doi: 10.1186/s12920-015-0108-y. - DOI - PMC - PubMed