

Association of Serum Calcium and Insulin Resistance With Hypertension Risk: A Prospective Population-Based Study
- PMID: 30596304
- PMCID: PMC6405709
- DOI: 10.1161/JAHA.118.009585
Association of Serum Calcium and Insulin Resistance With Hypertension Risk: A Prospective Population-Based Study
Abstract
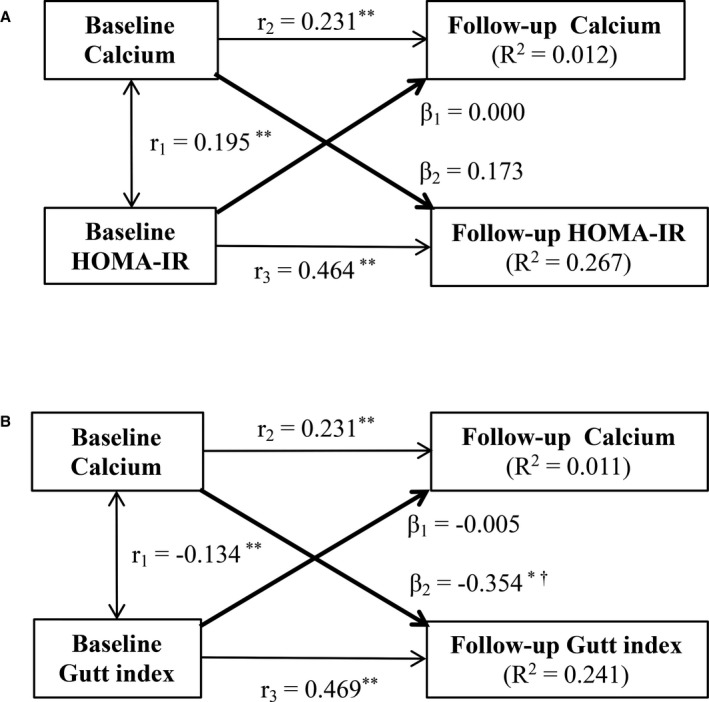
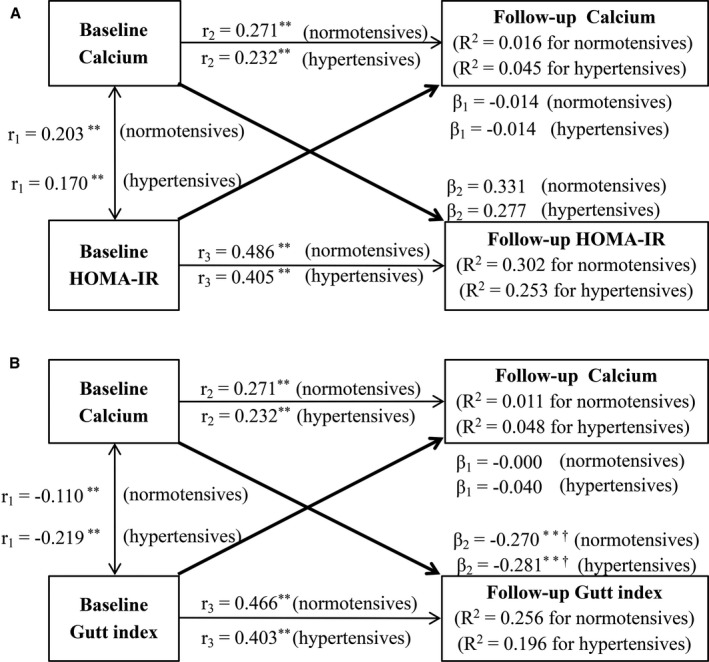
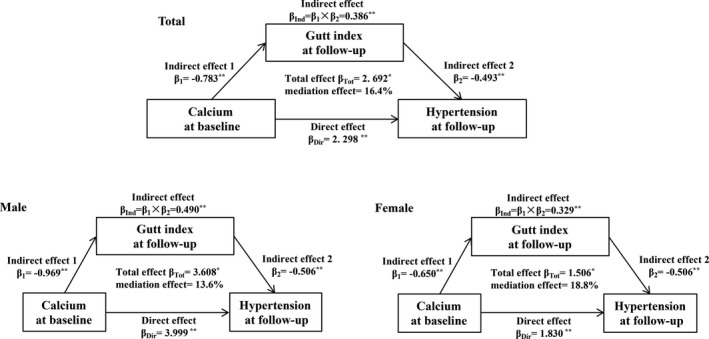
Background The temporal sequence between serum calcium and insulin resistance (IR) and their effects on hypertension are unclear. We studied the association between serum calcium and IR, with risk of hypertension events in a longitudinal cohort conducted in China. Methods and Results Data from 8653 subjects aged 20 to 74 years with an average follow-up of 5.3 years were analyzed. Serum calcium, and fasting and 2-hour serum glucose and insulin were measured at baseline and follow-up. Cross-lagged panel and mediation analysis were used to examine the temporal relationship between serum calcium and IR and its impact on hypertension incidence. The conjoint effects of serum calcium and IR at baseline on hypertension at follow-up were observed ( P=0.029 for HOMA_IR [hepatic IR] and P=0.009 for Gutt index [peripheral IR]). The cross-lagged path coefficient (β2) from baseline serum calcium to follow-up peripheral IR were significantly greater than path coefficient (β1) from baseline peripheral insulin resistance to follow-up serum calcium (β2 =-0.354 versus β1=-0.005; P=0.027). However, no directional relationships were observed in the serum calcium↔hepatic IR analysis. The mediation effect of peripheral IR on the association of serum calcium at baseline with hypertension at follow-up was estimated at 16.4% ( P<0.001). Conclusions Our findings demonstrate that higher serum calcium levels probably precede peripheral IR, and this 1-directional relation plays a role in the development of hypertension.
Keywords: calcium; hypertension; insulin resistance.
Figures
References
-
- Yajnik CS, Katre PA, Joshi SM, Kumaran K, Bhat DS, Lubree HG, Memane N, Kinare AS, Pandit AN, Bhave SA, Bavdekar A, Fall CH. Higher glucose, insulin and insulin resistance (HOMA‐IR) in childhood predict adverse cardiovascular risk in early adulthood: the Pune Children's Study. Diabetologia. 2015;58:1626–1636. - PMC - PubMed
-
- McCarron DA, Pingree PA, Rubin RJ, Gaucher SM, Molitch M, Krutzik S. Enhanced parathyroid function in essential hypertension: a homeostatic response to a urinary calcium leak. Hypertension. 1980;2:162–168. - PubMed
-
- Robinson BF. Altered calcium handling as a cause of primary hypertension. J Hypertens. 1984;2:453–460. - PubMed
-
- Dominiczak AF, Lyall F, Morton JJ, Dargie HJ, Boyle IT, Tune TT, Murray G, Semple PF. Blood pressure, left ventricular mass and intracellular calcium in primary hyperparathyroidism. Clin Sci (Lond). 1990;78:127–132. - PubMed
Publication types
MeSH terms
Substances
LinkOut - more resources
Full Text Sources
Medical
