. 2019 Jan;18(2):167-203.
doi: 10.1080/15384101.2018.1560203. Epub 2018 Dec 30.

Downregulation of NEAT1 reverses the radioactive iodine resistance of papillary thyroid carcinoma cell via miR-101-3p/FN1/PI3K-AKT signaling pathway

Affiliations

Downregulation of NEAT1 reverses the radioactive iodine resistance of papillary thyroid carcinoma cell via miR-101-3p/FN1/PI3K-AKT signaling pathway

Chao Liu et al. Cell Cycle. 2019 Jan.

Retraction in

Abstract

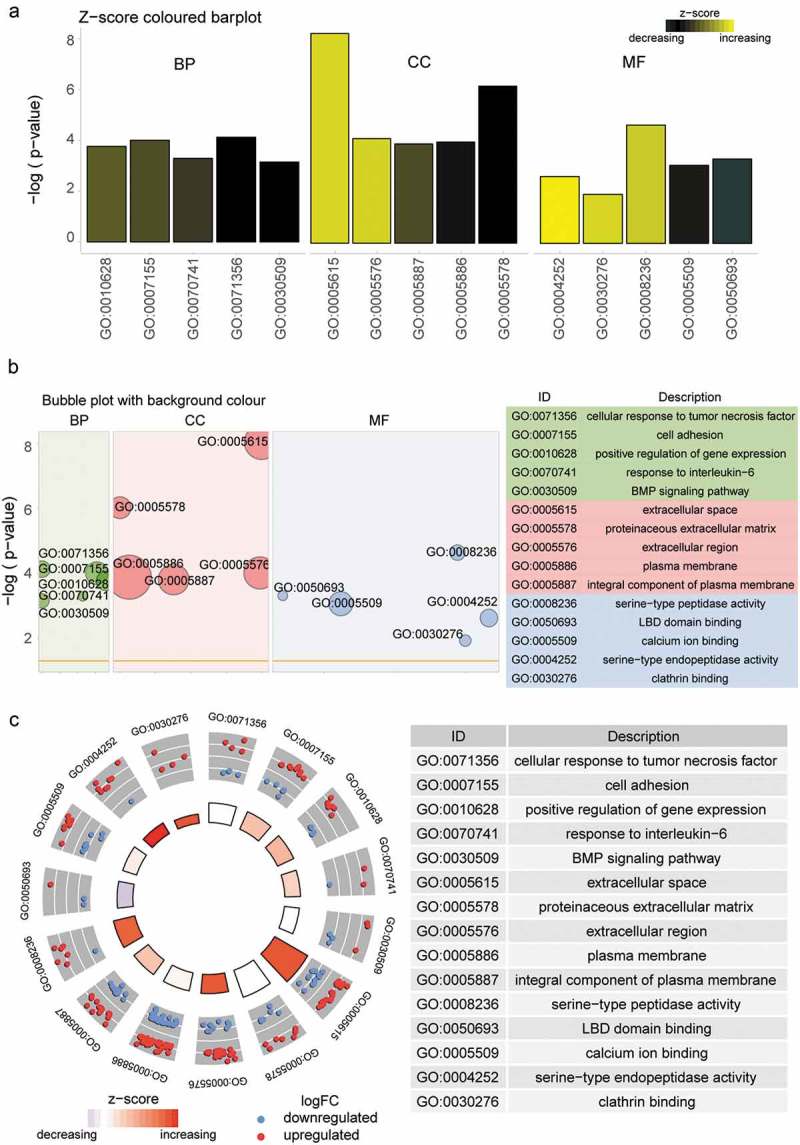
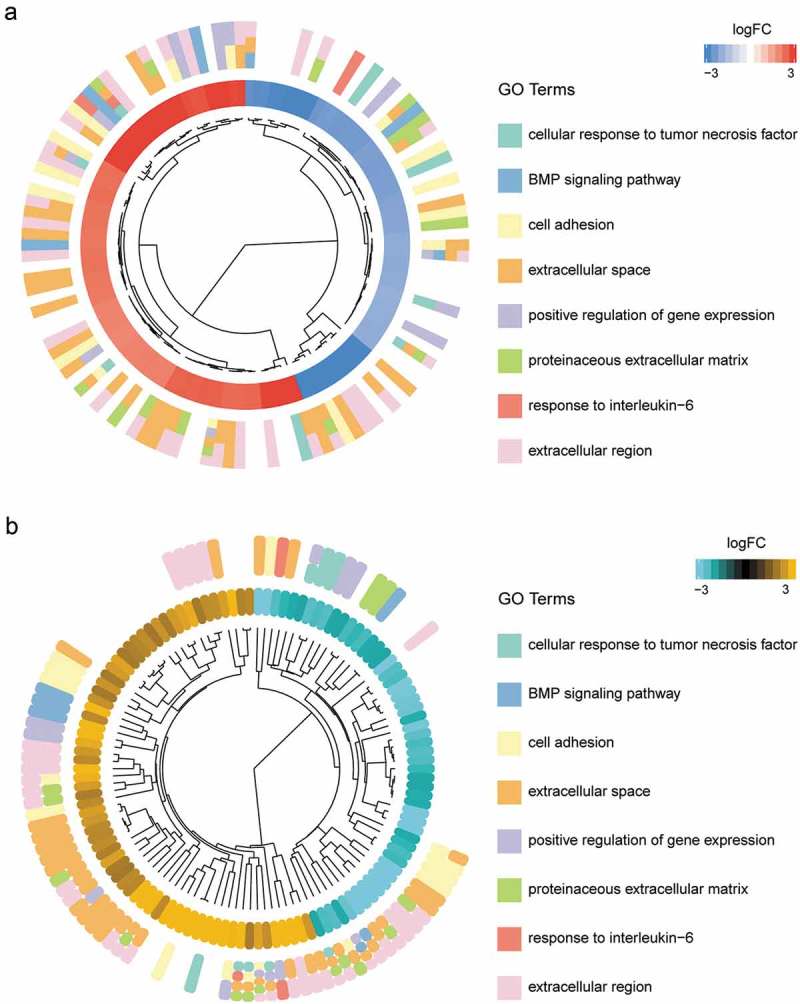
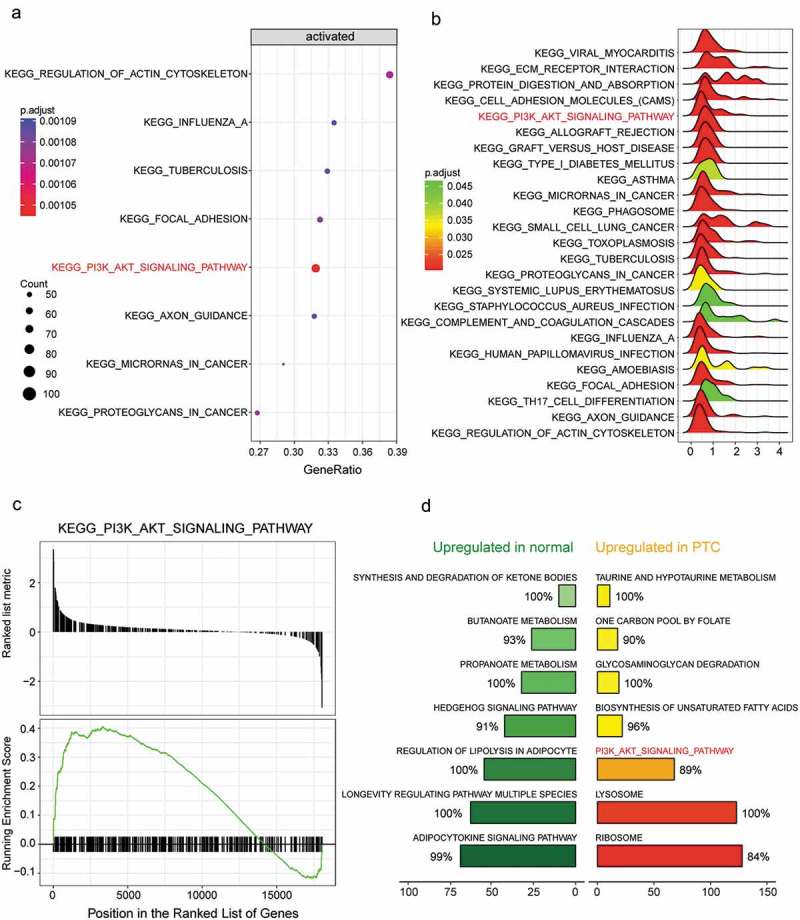
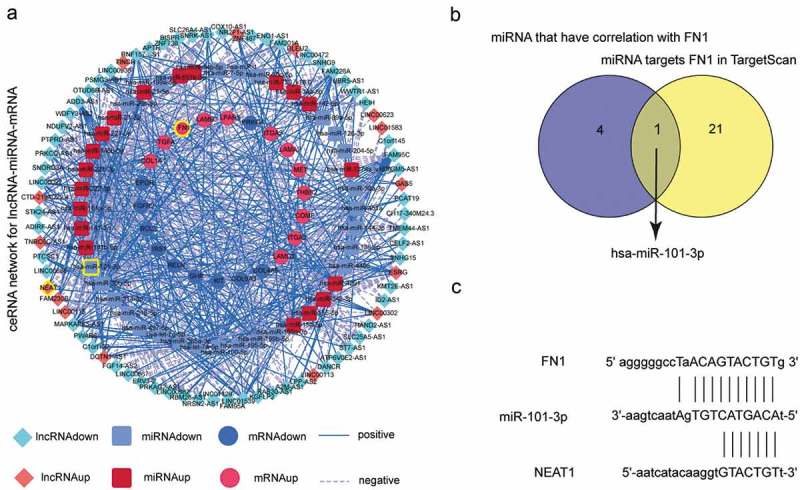
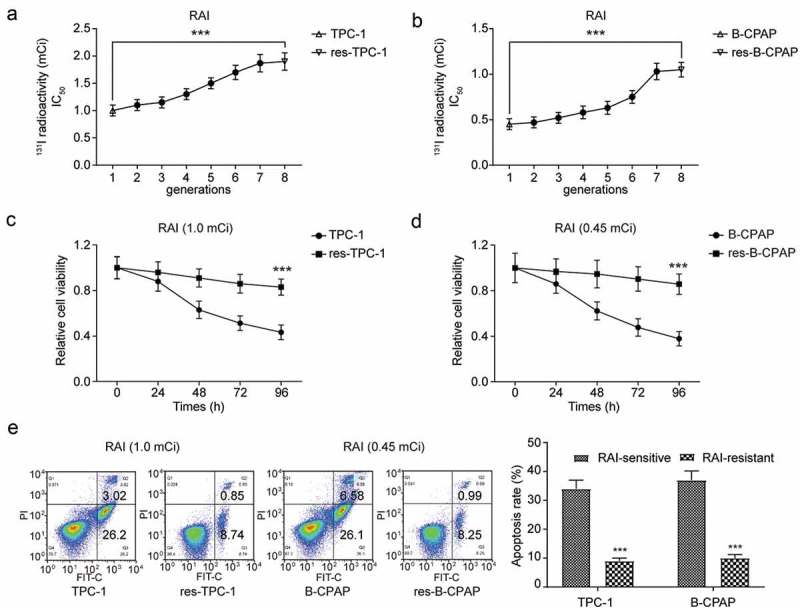
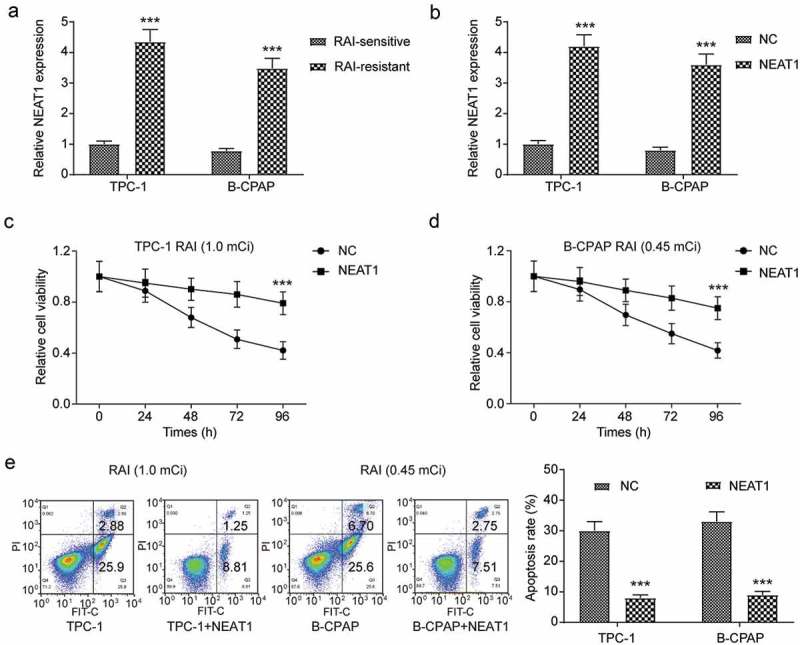
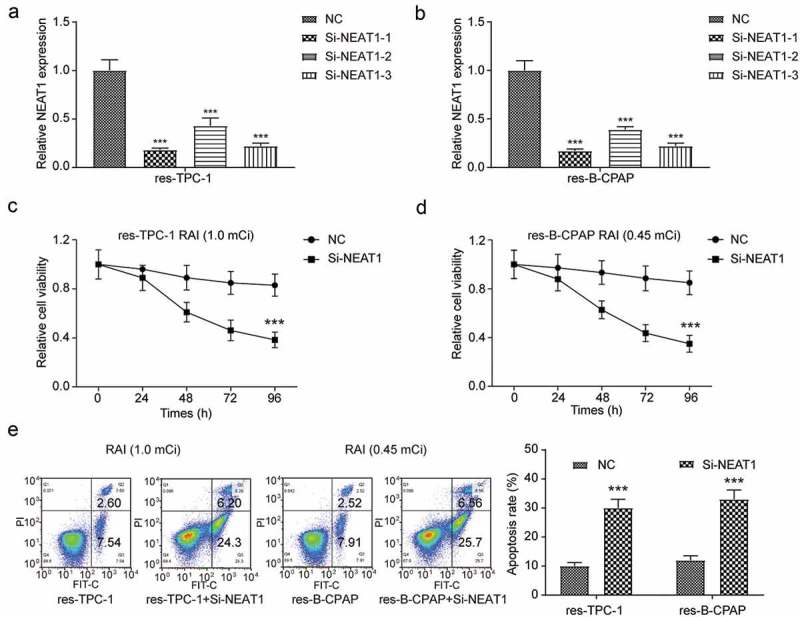
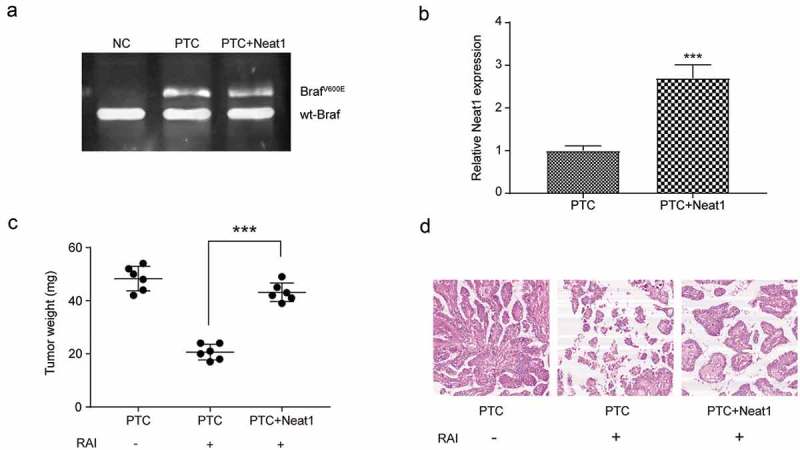
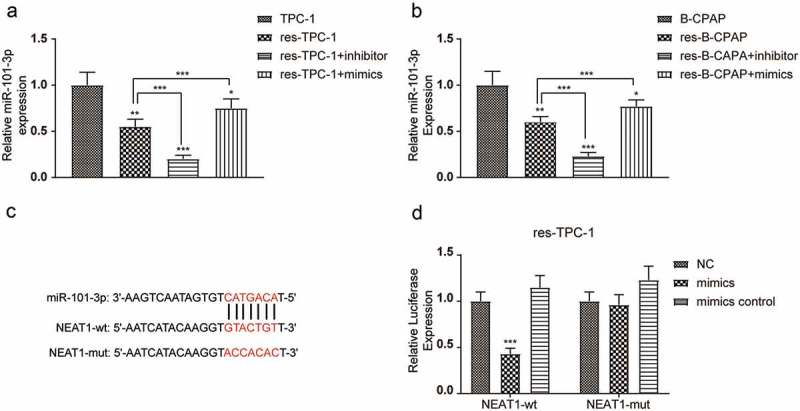
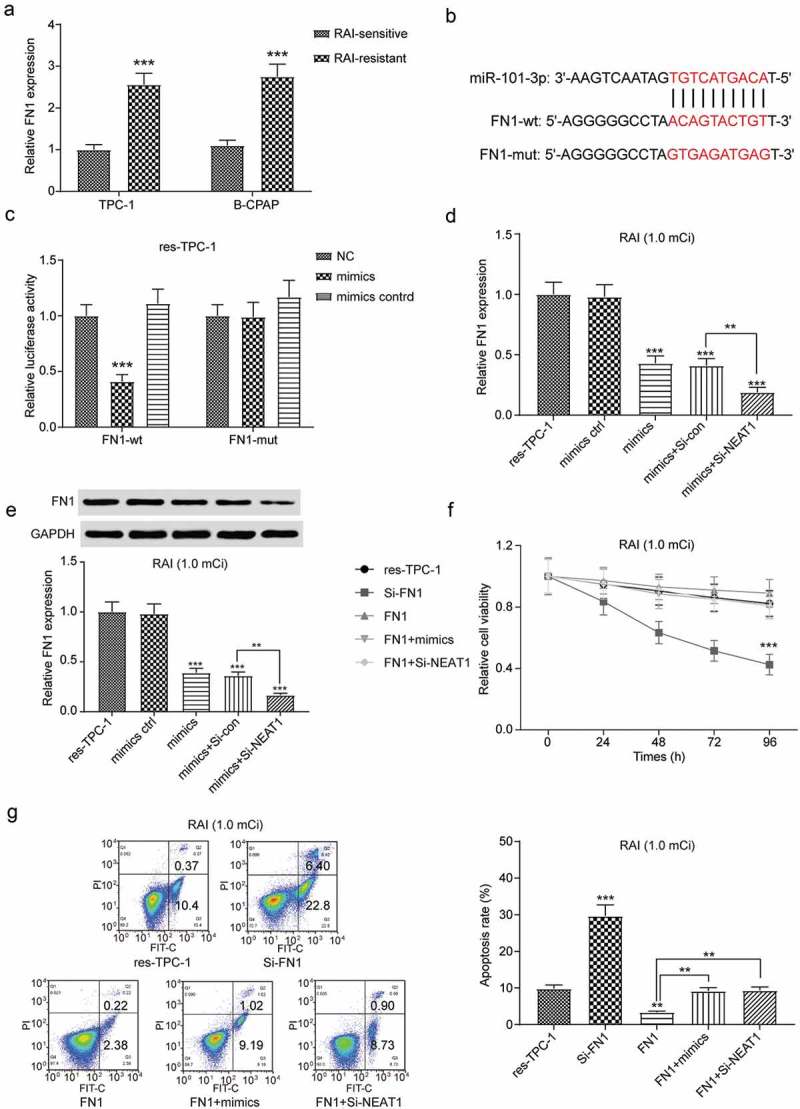
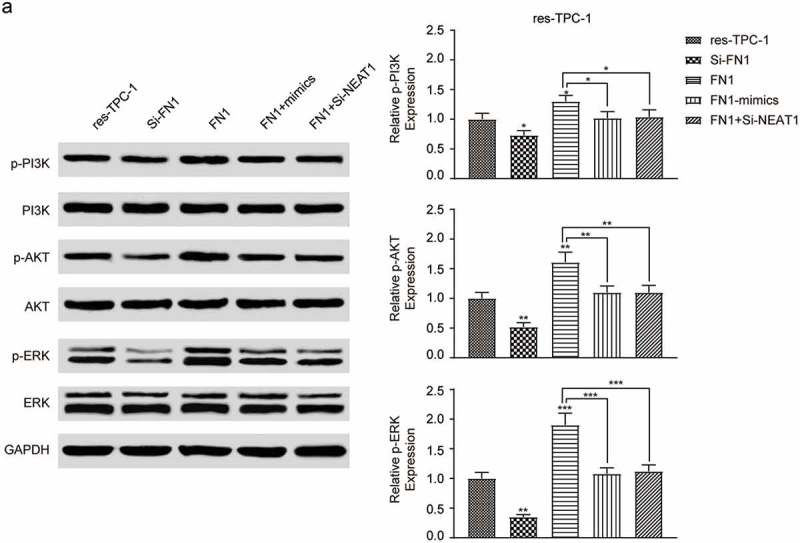
Considering the resistance of papillary thyroid cancer (PTC) 131I therapy, this study was designed to find a solution at molecular respect. By probing into lncRNA-NEAT1/miR-101-3p/FN1 axis and PI3K/AKT signaling pathway, this study provided a potential target for PTC therapy. 131I-resistant cell lines were established by continuous treatment with median-lethal 131I. Bioinformatic analysis was applied to filtrate possible lncRNA/miRNA/mRNA and related signaling pathway. Luciferase reporter assay was employed in the verification of the targeting relationship between lncRNA and miRNA as well as miRNA and mRNA. MTT assay and flow cytometry assay were performed to observe the impact of NEAT1/miR-101-3p/FN1 on cell viability and apoptosis in radioactivity iodine (RAI)-resistant PTC cell lines, respectively. Western blot and qRT-PCR were conducted to measure the expression of proteins and mRNAs in RAI-resistant PTC tissues and cells. Meanwhile, endogenous PTC mice model were constructed, in order to verify the relation between NEAT1 and RAI-resistance in vivo. NEAT1 was over-expressed in RAI-resistant PTC tissues and cell lines and could resist RAI by accelerating proliferation accompanied by suppressing apoptosis. It indicated that overexpressed NEAT1 restrained the damage of RAI to tumor in both macroscopic and microcosmic. Besides, NEAT1/miR-101-3p exhibited a negative correlation by directly targeting each other. The expression of FN1, an overexpressed downstream protein in RAI-resistance PTC tissues, could be tuned down by miR-101-3p, while the decrease could be restored by NEAT1. In conclusion, both in vitro and in vivo, NEAT1 suppression could inhibit 131I resistance of PTC by upregulating miR-101-3p/FN1 expression and inactivated PI3K/AKT signaling pathway both in vitro and in vivo.

Keywords: FN1; NEAT1; PI3K/AKT signaling pathway; PTC; RAI-resistance; miR-101-3p.


Figures

Figure 1.
Figure 1.
GO term enrichment analysis. (a) Barplot of three different functional categories. The significance of each terms was displayed on the y-axis and bars were ordered according to the corresponding Z-score. Three GO term: Cellular response to tumor necrosis factor, Extra cellular space and Serine-type endopeptidase activity demonstrated the highest significance in BP, CC, MF respectively. (b) Bubble plot of three different functional categories. The z-score was assigned to x-axis and the negative log adjusted p to the y-axis. The area of the displayed bubble was proportional to the count of genes involved in certain term and the bubble’s color was corresponding to the category. Cellular response to tumor necrosis factor, plasma membrane and calcium ion binding in BP, CC and MF respectively were the terms that contained the largest number of genes. (c) GOCircle of valuable GO terms contained in three different functional categories. The outer circle showed a scatter plot for each term of the log2FC of the assigned genes. Red circles displayed up-regulation and blue ones displayed down-regulation. GO term plasma membrane in CC contained the largest number of up-regulated genes and extra cellular space demonstrated the highest Z-score.
Figure 2.
Figure 2.
Hierarchical clustering of GO terms. (a) The first ring next to the dendrogram represents the log2FC of the genes, which were actually the leaves of the clustering tree. Genes were grouped by their log2FC value. (b) Genes were clustered based on different terms. Most genes involved in extra cellular space were up-regulated while most genes in cellular response to tumor necrosis factor term were down-regulated.
Figure 3.
Figure 3.
PI3K/AKT signaling pathway was activated in RAI-resistant PTC. (a) Dotplot displayed that PI3K/AKT signaling pathway was activated in RAI-resistant PTC. The size of the dot was proportional to the number of genes in this pathway and Gene Ratio was on the horizontal axis. (b) Ridgeplot suggested the distributions of those significant biased KEGG pathways, and PI3K-AKT signaling pathway was activated in RAI-resistant PTC as the ridge of this pathway was on the right of the zero point. (c) Gseaplot of PI3K/AKT signaling pathway. It indicated most genes involved in PI3K/AKT signaling pathway were overexpressed in RAI-resistant PTC. (d) The ranking plot of top 7 pathways in normal PTC group and RAI-resistant PTC group respectively base on their NES (Normalized Enrichment Score).
Figure 4.
Figure 4.
CeRNA network analysis. (a) CeRNA network correlated these lncRNAs, miRNAs and mRNAs involved in PI3K/AKT signaling pathway. (b) Venn diagram of two sets: all miRNAs which targeted FN1 and all miRNAs which had correlation with FN1. MiRNA miR-101-3p was the only intersection. (c) The estimated binding sites of NEAT1, miR-101-3p and FN1.
Figure 5.
Figure 5.
131I treatment had a poor effect in RAI-resistant PTC cell lines. (a) Continuously treatment of the median-lethal dose of 131I to TPC-1 cell lines. 1st generation of TPC-1 was set as normal TPC-1 cell line, and the 8th as res-TPC-1 (RAI-resistant TPC-1). 131I radioactivity was calculated with a half-time decay of 8.02 days. The medium was changed every day. (b) Continuously treatment of the median-lethal dose of 131I to B-CPAP cell lines. 1st generation of B-CPAP was considered as normal B-CPAP cell line, and the 8th as res- B-CPAP (RAI-resistant B-CPAP). 131I radioactivity was calculated with a half-time decay of 8.02 days. The medium was changed every day. (c) MTT assay for sensitive and resistant TPC-1 cell lines treated with 131I (1.0 mCi/well) for 96 h. (d) MTT assay for sensitive and resistant B-CPAP cell lines treated with 131I (0.45 mCi/well) for 96 h. (e) Apoptosis assay for TPC-1, res-TPC-1, B-CPAP and res-B-CPAP cell lines treated with 131I for 12 h by flow cytometry. TPC-1 cells were treated with 1.0 mCi 131I and B-CPA cells were treated with 0.45 mCi 131I. The data were from one representative experiment of three identically performed and were expressed as means±SD (Standard Deviation). *** P < 0.001.
Figure 6.
Figure 6.
The overexpression of NEAT1 in normal PTC cell lines led to 131I resistance. (a) NEAT1 was overexpressed in 131I-resistant PTC cell lines according to qRT-PCR results. (b) Transfection of NEAT1 in both two normal PTC cell lines significantly upregulated the expression of NEAT1. (c) MTT assay indicated that cell viability of NEAT1-upregulated or normal TPC-1 cell line, with 96 h 131I treatment. (d) MTT assay indicated that cell viability of NEAT1-upregulated or normal B-CPAP cell line, with 96 h 131I treatment. (e) Apoptosis assay for TPC-1 and B-CPAP cell lines treated with 131I for 12 h was determined by flow cytometry. TPC-1 cells were treated with 1.0 mCi 131I and B-CPAP cells were treated with 0.45 mCi 131I. The data were from one representative experiment of three identically performed and were expressed as mean±SD. *** P < 0.001.
Figure 7.
Figure 7.
The downregulation of NEAT1 in RAI-resistant cell lines reversed 131I resistance. (a) NEAT1 was downregulated in 131I-resistant PTC-1 cell line by NEAT1 siRNAs transfection. Si-NEAT1-1 was chosen for the subsequent experiments. (b) QRT-PCR results showed that NEAT1 was downregulated in 131I-resistant B-CPAP cell lines. Si-NEAT1-1 was chosen for the subsequent experiments. (c) Cell viability of NEAT1-upregulated or normal res-TPC-1 cell line was analyzed by MTT assay, with 96 h 131I treatment. (d) Cell viability of NEAT1-upregulated or normal res-B-CPAP cell line was analyzed by MTT assay, with 96 h 131I treatment. (e) Apoptosis assay for res-TPC-1 and res-B-CPAP cell lines treated with 131I for 12 h was measured by flow cytometry. Res-TPC-1 cells were treated with 1.0 mCi 131I and res-B-CPAP cells were treated with 0.45 mCi 131I. The data were from one representative experiment of three identically performed and were expressed as mean±SD. *** P < 0.001.
Figure 8.
Figure 8.
Neat1-overexpressed mice reversed the effect of 131I treatment. (a) Agarose electrophoresis results showed that both PTC and PTC+Neat1 group mice successfully expressed BrafV600E, compared to the NC mice. PTC group means mice transfected with BrafV600E, PTC+Neat1 group means mice transfected with BrafV600E and Neat1. (b) QRT-PCR results showed that Neat1 was significantly overexpressed in PTC+Neat1 group, compared to PTC group. (c) The weight of PTC tumor of three groups. RAI means radioactive iodine treatment, + means RAI treated, – means RAI free. (d) HE staining of PTC tissues in three groups. The data were expressed as mean±SD. *** P < 0.001.
Figure 9.
Figure 9.
miR-101-3p was regulated by NEAT1 in PTC. (a) QRT-PCR results indicated that the expression of miR-101-3p in res-TPC-1 transfected with miR-101-3p inhibitor or mimics was compared to the expression of miR-101-3p in TPC-1 and res-TPC-1, respectively. (b) QRT-PCR results indicated that the expression of miR-101-3p with miR-101-3p inhibitor or mimics in res-B-CPAP was compared to the expression of miR-101-3p in B-CPAP and res-B-CPAP, respectively. (c) StarBase v2.0 predicted the direct target relationship between miR-101-3p and NEAT1. (d) Luciferase reporter assay indicated that miR-101-3p directly targeted at NEAT1. The data were from one representative experiment of three identically performed and were expressed as mean±SD. * P < 0.05, ** P < 0.01, *** P < 0.001.
Figure 10.
Figure 10.
The expression of FN1 was regulated by NEAT1/miR-101-3p. (a) FN1 was overexpressed in 131I-resistant PTC cell lines determined by qRT-PCR. (b) TargetScan predicted the direct target relationship between miR-101-3p and FN1. (c) Luciferase reporter assay indicated that miR-101-3p directly targeted at FN1. (d) QRT-PCR indicated that upregulated of miR-101-3p inhibited the mRNA expression of FN1, and co-transfected with Si-NEAT1 increased the effect of inhibition. (e) Western blot supported that the co-transfection of miR-101-3p and Si-NEAT1 significantly decreased the protein expression of FN1, compared to control or transfected single. (f) Cell viability assay was detected by MTT, under 131I treatment for 96 h. FN1 attenuated the effect of RAI and Si-NEAT1 could reversed this resistance. (g) Apoptosis assay for res-TPC-1 cell line treated with 131I for 12 h was evaluated by flow cytometry. TPC-1 cells were treated with 1.0 mCi 131I and B-CPA cells were treated with 0.45 mCi 131I. The data were from one representative experiment of three identically performed and were expressed as mean±SD. ** P < 0.01, *** P < 0.001.
Figure 11.
Figure 11.
The expression of proteins related PI3K/AKT signaling pathway (a) Downregulation of PI3K/AKT signaling pathway contributed to RAI-resistance remission. Western blot presented the expression of PI3K, AKT and ERK, as well as their corresponding phosphorylated proteins. The data were from one representative experiment of three identically performed and were expressed as mean±SD. * P < 0.05, ** P < 0.01, *** P < 0.001.

Similar articles

Cited by

References

    1. Zhang H, Cai Y, Zheng L, et al. Long noncoding RNA NEAT1 regulate papillary thyroid cancer progression by modulating miR-129-5p/KLK7 expression. J Cell Physiol. 2018;233:6638–6648. - PubMed
    1. Lupoli R, Cacciapuoti M, Tortora A, et al. Clinical outcome in differentiated thyroid carcinoma and microcarcinoma. Int J Surg. 2014;12(Suppl 1):S148–51. - PubMed
    1. Xiang C, Zhang ML, Zhao QZ, et al. LncRNA-SLC6A9-5:2: A potent sensitizer in 131I-resistant papillary thyroid carcinoma with PARP-1 induction. Oncotarget. 2017;8:22954–22967. - PMC - PubMed
    1. Liu D, Hu S, Hou P, et al. Suppression of BRAF/MEK/MAP kinase pathway restores expression of iodide-metabolizing genes in thyroid cells expressing the V600E BRAF mutant. Clin Cancer Res. 2007;13:1341–1349. - PubMed
    1. Chen C, Zhou L, Wang H, et al. Long noncoding RNA CNALPTC1 promotes cell proliferation and migration of papillary thyroid cancer via sponging miR-30 family. Am J Cancer Res. 2018;8:192–206. - PMC - PubMed

Publication types

MeSH terms