. 2018 Dec;22(12):6039-6054.
doi: 10.1111/jcmm.13879. Epub 2018 Sep 14.

The outer membrane protein Tp92 of Treponema pallidum induces human mononuclear cell death and IL-8 secretion

Affiliations

The outer membrane protein Tp92 of Treponema pallidum induces human mononuclear cell death and IL-8 secretion

Xi Luo et al. J Cell Mol Med. 2018 Dec.

Abstract

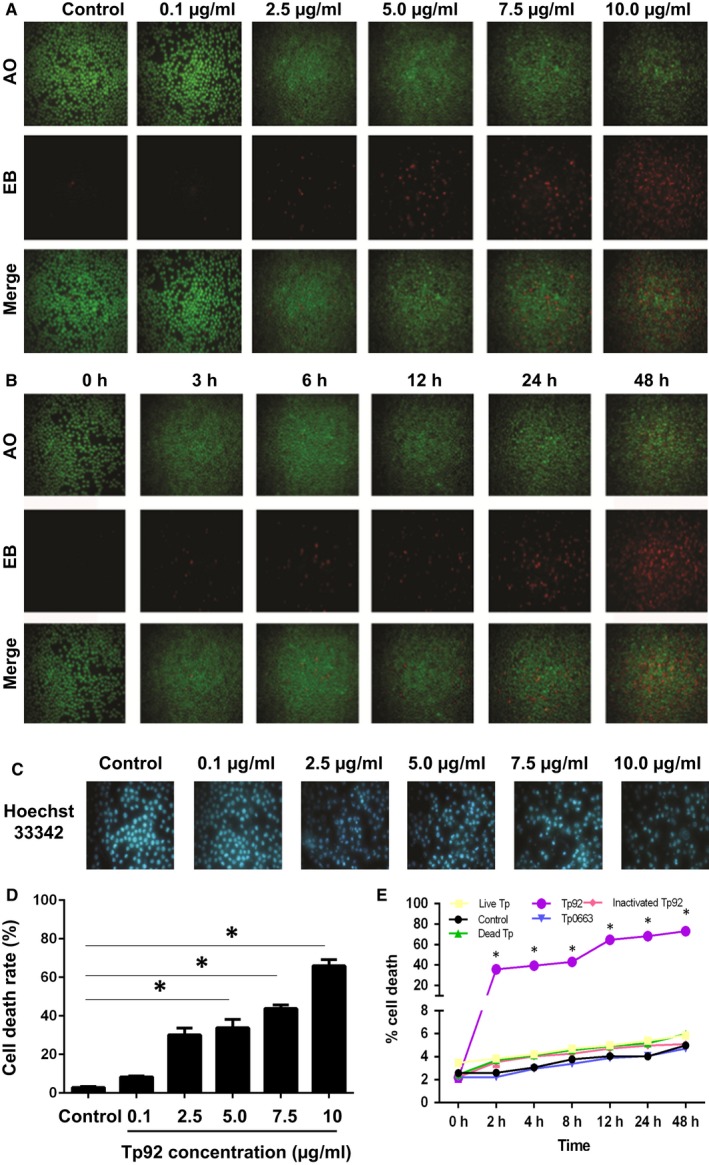
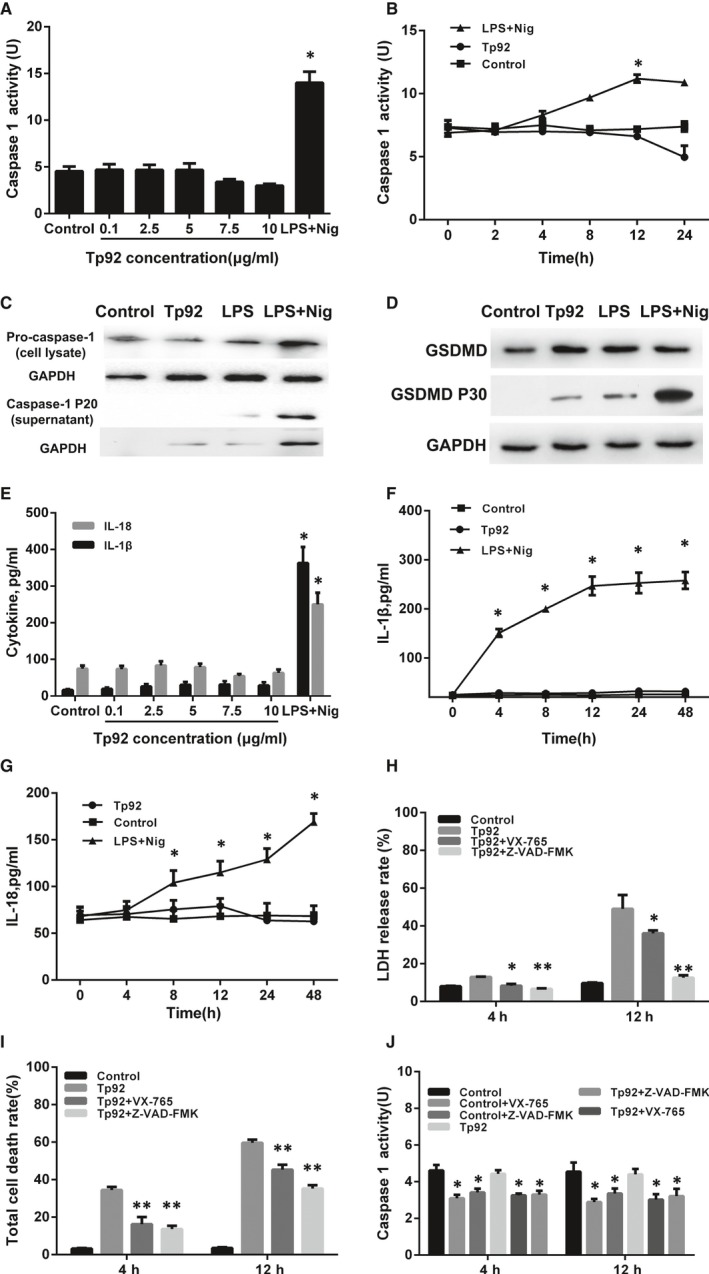
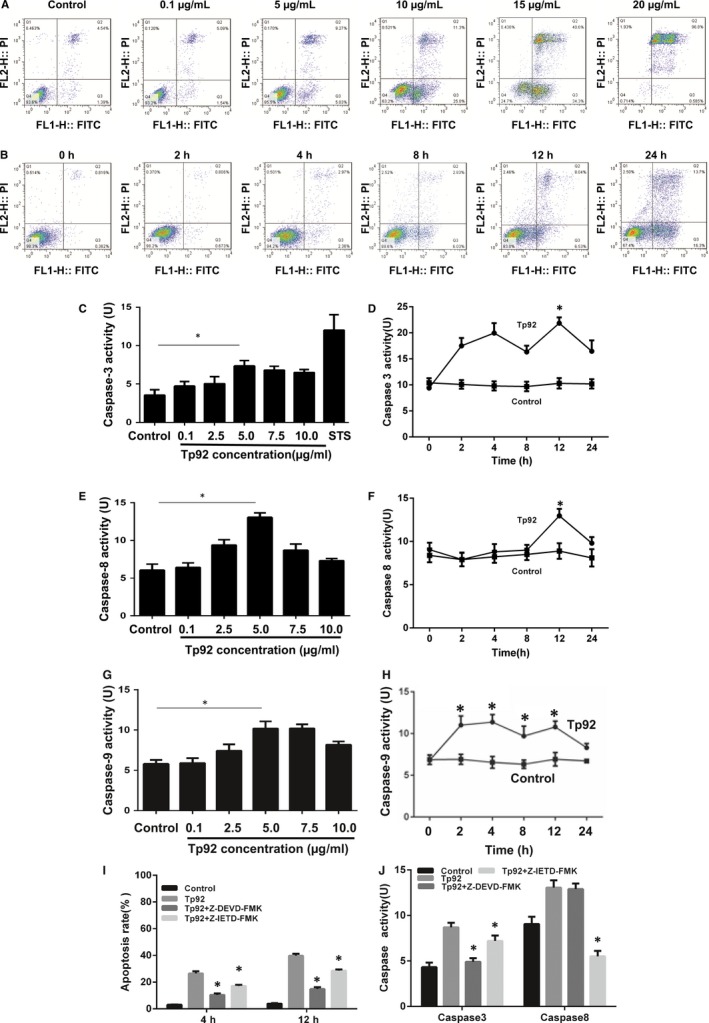
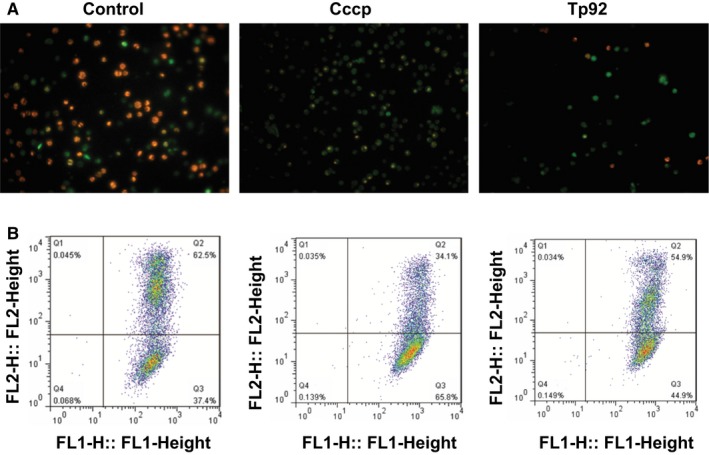
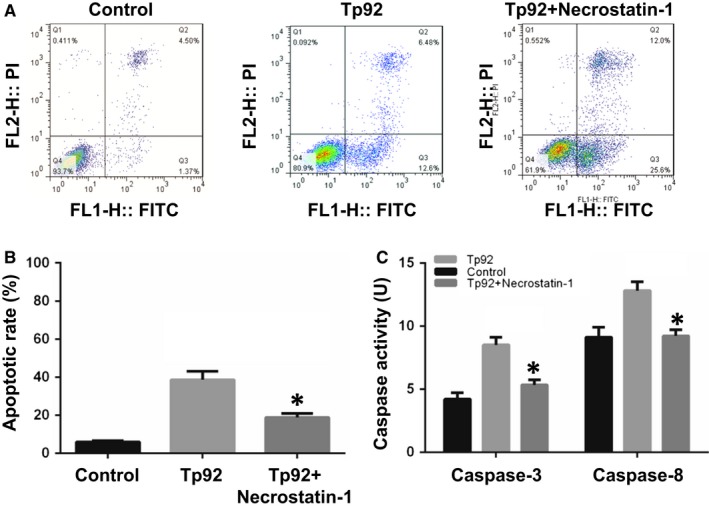
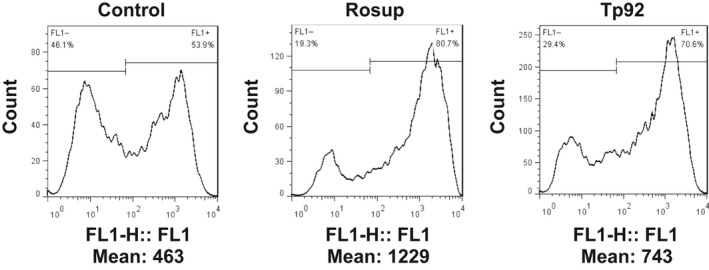
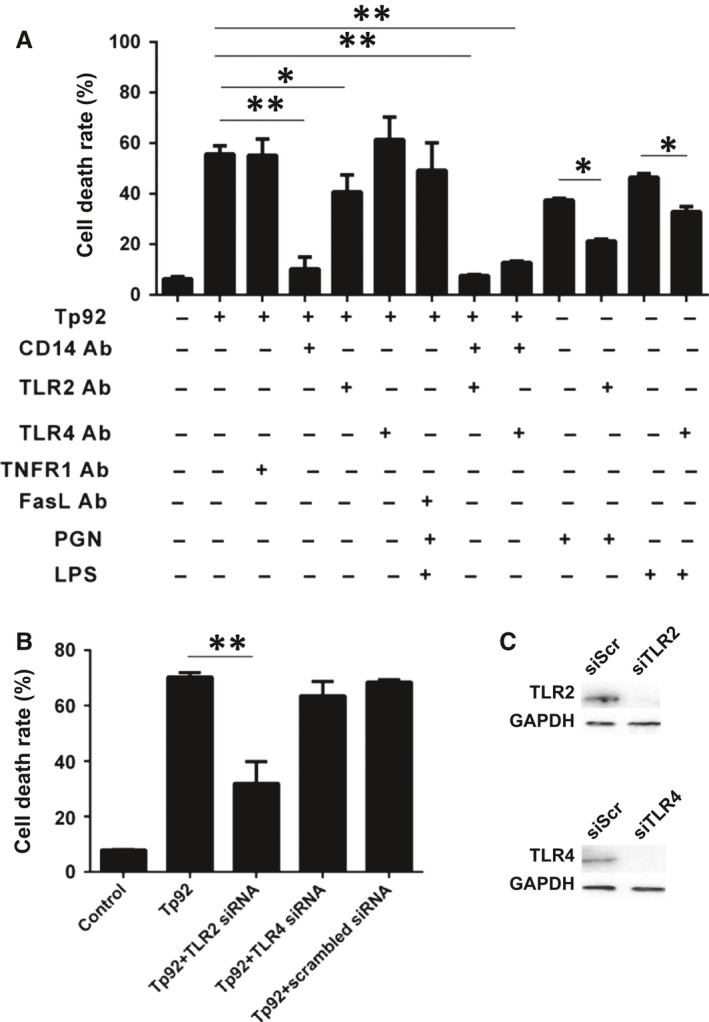
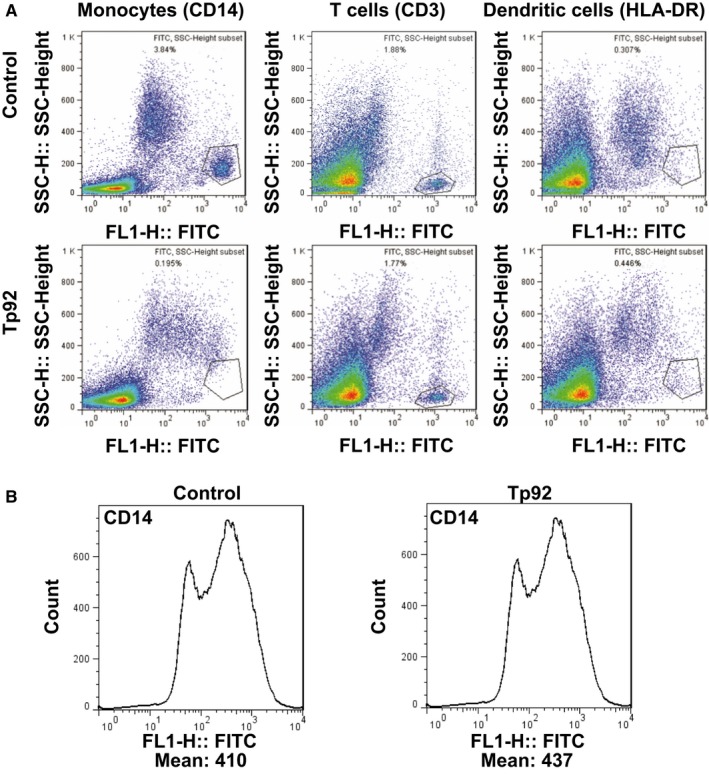
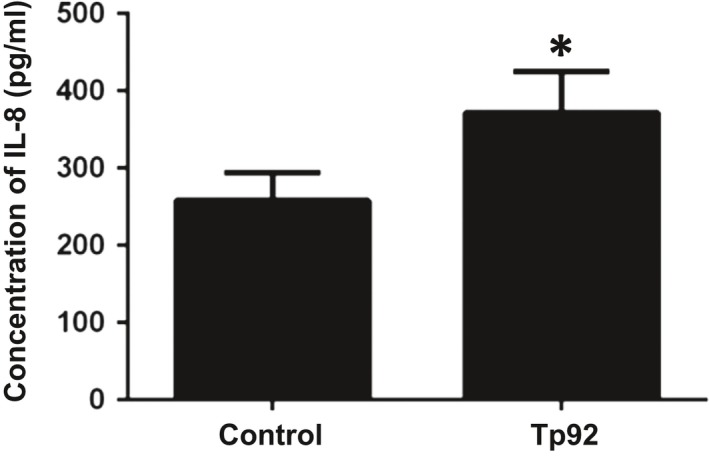
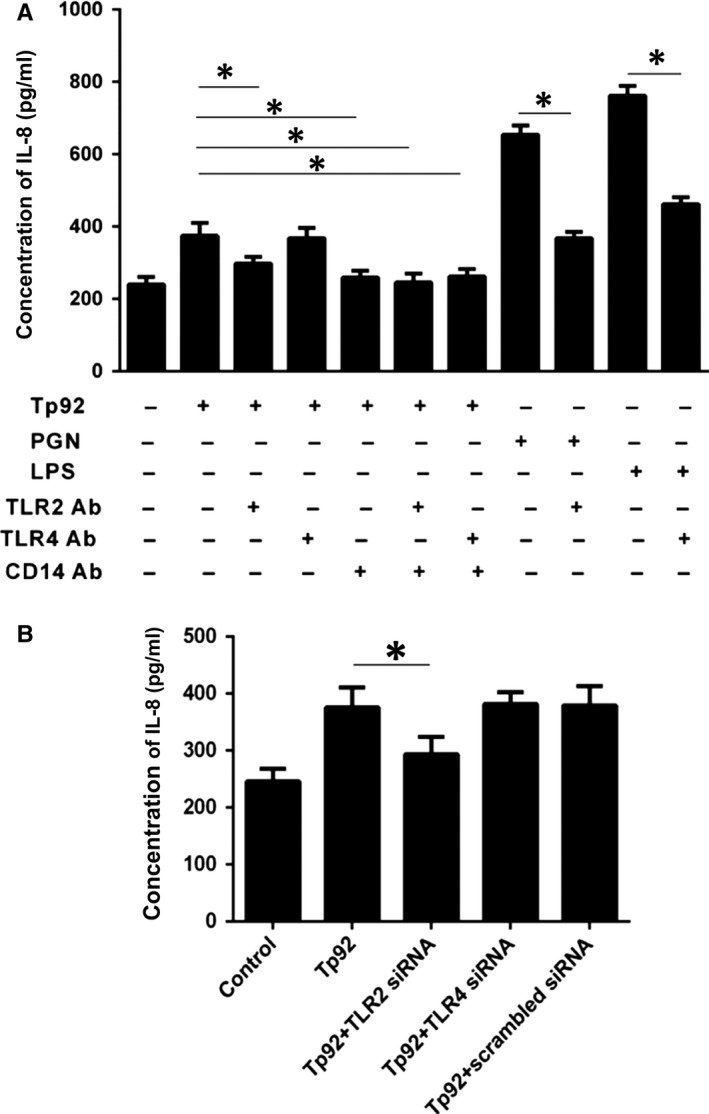
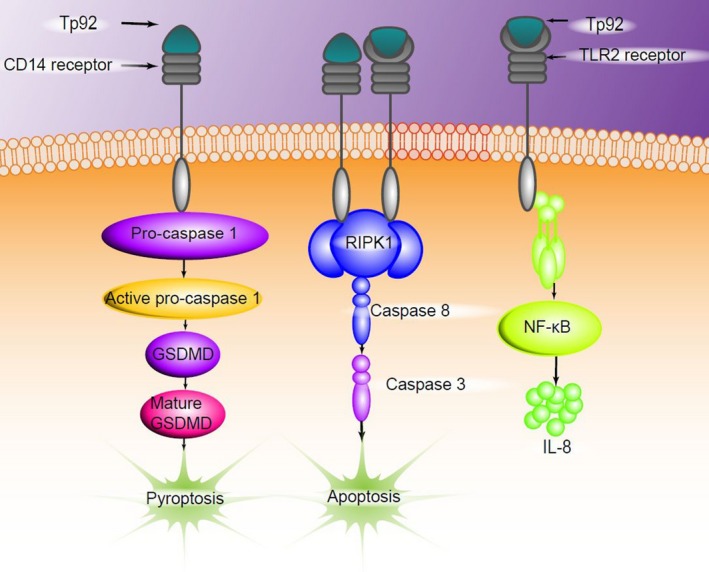
Treponema pallidum is the pathogen that causes syphilis, a sexually transmitted disease; however, the pathogenic mechanism of this organism remains unclear. Tp92 is the only T. pallidum outer membrane protein that has structural features similar to the outer membrane proteins of other Gram-negative bacteria, but the exact functions of this protein remain unknown. In the present study, we demonstrated that the recombinant Tp92 protein can induce human mononuclear cell death. Tp92 mediated the human monocytic cell line derived from an acute monicytic leukemia patient (THP-1) cell death by recognizing CD14 and/or TLR2 on cell surfaces. After the stimulation of THP-1 cells by the Tp92 protein, Tp92 may induce atypical pyroptosis of THP-1 cells via the pro-caspase-1 pathway. Meanwhile, this protein caused the apoptosis of THP-1 cells via the receptor-interacting protein kinase 1/caspase-8/aspase-3 pathway. Tp92 reduced the number of monocytes among peripheral blood mononuclear cells. Interestingly, further research showed that Tp92 failed to increase the tumour necrosis factor-α, interleukin (IL)-1β, IL-6, IL-10, IL-18 and monocyte chemotactic protein 1 (MCP)-1 levels but slightly elevated the IL-8 levels via the Nuclear Factor (NF)-κB pathway in THP-1 cells. The data suggest that Tp92 recognizes CD14 and TLR2, transfers the signal to a downstream pathway, and activates NF-κB to mediate the production of IL-8. This mechanism may help T. pallidum escape recognition and elimination by the host innate immune system.

Keywords: Treponema pallidum; CD14; IL‐8; TLR2; Tp92; apoptosis; membrane protein; pyroptosis.


Figures

Figure 1
Figure 1
Effect of the Tp92 protein on THP‐1 cell death. A and B, Effect of different (A) concentrations or (B) durations of Tp92 treatment on the integrity of THP‐1 cell membranes. The cells were treated with (A) 0, 0.1, 2.5, 5.0, 7.5 or 10.0 μg/mL Tp92 for 12 hours or (B) 5.0 μg/mL Tp92 for 0, 3, 6, 12, 24 or 48 hours. AO/EB staining was performed, and the cells were observed under a fluorescence microscope. Red indicates cells with damaged membrane, while green indicates intact cells. C, Effect of different concentrations of the Tp92 protein on the nuclei of THP‐1 cells. The cells were stimulated with 0, 0.1, 2.5, 5.0, 7.5 or 10.0 μg/mL Tp92 for 12 hours, and the nuclei were stained with Hoechst33342 dye and observed under a fluorescence microscope. D and E, Effect of different (D) concentrations or (E) durations of Tp92 treatment on the total death rates of THP‐1 cells. The cells were treated with (D) 0, 0.1, 2.5, 5.0, 7.5 or 10.0 μg/mL Tp92 for 12 hours or (E) 1 × 103 live Tp (Treponema pallidum), 1 × 103 dead Tp, 5.0 μg/mL Tp0663 (T. pallidum outer membrane protein), 5.0 μg/mL Tp92 and 5.0 μg/mL inactivated Tp92 (heat inactivation) for 0, 2, 4, 8, 12, 24 or 48 hours. The CCK‐8 assay was used to determine the total death rates of the THP‐1 cells. Data are expressed as the means ± standard deviations of three replicates. *P < 0.05 compared with the control
Figure 2
Figure 2
Effect of the Tp92 protein on the pyroptosis of THP‐1 cells. A and B, Effect of different (A) concentrations and (B) durations of Tp92 or LPS+Nig treatment on caspase‐1 activity. THP‐1 cells were treated with (A) 0, 0.1, 2.5, 5.0, 7.5 or 10.0 μg/mL Tp92 or LPS (1 μg/mL)+Nig (5 μM) for 12 hours or (B) LPS (1 μg/mL)+Nig (5 μM) or 5.0 μg/mL Tp92 for 0, 2, 4, 8, 12 or 24 hours. *P < 0.05 compared with the control. C and D, Effect of Tp92, LPS or LPS+Nig on (C) caspase‐1, pro‐caspase‐1 and (D) GSDMD protein expression determined by Western blotting. THP‐1 cells were treated with Tp92 (5 μg/mL), LPS (1 μg/mL) or LPS (1 μg/mL)+Nig (5 μM) for 12 hours before Western blotting. E‐G, Effect of different (E) concentrations and (F and G) durations of Tp92 or LPS+Nig treatments on the concentrations of IL‐1β and IL‐18 measured by ELISA. THP‐1 cells were treated with (E) 0, 0.1, 2.5, 5.0, 7.5 or 10.0 μg/mL Tp92 or LPS (1 μg/mL)+Nig (5 μM) for 12 hours or (F and G) LPS (1 μg/mL)+Nig (5 μM) or 5.0 μg/mL Tp92 for 0, 4, 8, 12, 24 or 48 hours. *P < 0.05 compared with the control. H‐J, Effect of the caspase‐1‐specific inhibitor VX‐765 or caspase inhibitor Z‐VADFMK on the (H) LDH release rate, (I) total cell death rate and (J) caspase‐1 activity. THP‐1 cells were pretreated with VX‐765 (50 μM) or Z‐VADFMK (100 μM) for 1 hour before being treated with Tp92 (5 μg/mL) for 12 hours. At 4 and 12 hours, the LDH release rate, total cell death rate and casepase‐1 activity were measured and expressed as the means ± standard deviations of three replicates. *P < 0.05 and **P < 0.01 compared with the Tp92 group
Figure 3
Figure 3
Effect of the Tp92 protein on the apoptosis of THP‐1 cells. A and B, Effect of different (A) concentrations and (B) durations of Tp92 treatment on the apoptosis of THP‐1 cells, as determined by flow cytometry. The cells were treated with (A) 0, 0.1, 5.0, 10.0, 15.0 or 20.0 μg/mL Tp92 for 12 hours or (B) 5.0 μg/mL Tp92 for 0, 2, 4, 8, 12 or 24 hours. C‐H, Effect of different (C, E, G) concentrations and (D, F, H) durations of Tp92 treatment on the activities of caspase‐3, ‐8 and ‐9. STS (0.1 μM) was also used to treat THP‐1 cells to study the activity of caspase‐3. *P < 0.05 compared with the control. I, Effect of caspase‐3 and caspase‐8 inhibitors on the apoptosis of THP‐1 cells. Cells were pretreated with the caspase‐3 inhibitor Z‐DEVDFMK (10 μM) or caspase‐8 inhibitor Z‐IETDFMK (1 μL/mL) for 1 hour and then treated with Tp92 (5 μg/mL) for 4 or 12 hours before measuring the apoptotic rate. *P < 0.05 compared with the Tp92 group. J, Effect of caspase‐3 and caspase‐8 inhibitors on the activities of caspase‐3 and caspase‐8. Cells were pretreated with Z‐DEVDFMK (10 μM) or Z‐IETDFMK (1 μL/mL) for 1 hour and then treated with Tp92 (5 μg/mL) for 12 hours before testing the activities of caspase‐3 and caspase‐8. *P < 0.05 compared with the Tp92 group
Figure 4
Figure 4
Effect of Tp92 on mitochondria. A, Fluorescence microscopy of mitochondria in THP‐1 cells (magnification, 200 × ). B, Mitochondrial transmembrane potential determined by flow cytometry. THP‐1 cells were treated with carbonyl cyanide 3‐chlorophenylhydrazone (Cccp) or Tp92 (5.0 μg/mL) for 12 hours
Figure 5
Figure 5
Effect of the RIPK1 inhibitor necrostatin‐1 on (A and B) apoptosis and (C) caspase activity. A and B, Apoptotic rate of THP‐1 cells determined by flow cytometry. B, Activities of caspase‐3 and caspase‐8. The cells were pretreated with necrostatin‐1 (10 μM) and then incubated with Tp92 (5 μg/mL) for 12 hours. *P < 0.05 compared with the Tp92 group
Figure 6
Figure 6
Effect of Tp92 on the ROS levels in THP‐1 cells. The cells were treated with Rosup (1 μg/mL) or Tp92 (5 μg/mL) for 12 hours. Average fluorescence intensity was measured by flow cytometry
Figure 7
Figure 7
Tp92 mediates THP‐1 cell death by recognizing CD14 and/or TLR2 on cell surfaces. A, Death rates of THP‐1 cells pretreated with TNFR1, FasL, TLR4, CD14 or TLR2‐neutralizing antibodies (10 μg/mL each) for 1 hour. The cells were treated with Tp92 (5.0 μg/mL), LPS (1 μg/mL) or PGN (10 μg/mL) for 12 hours, and the CCK‐8 assay was performed to determine the total cell death rate. B, Death rates of THP‐1 cells pretreated with TLR2 (2 μg/mL) or TLR4 (2 μg/mL) interference plasmids for 24 hours. The cells were treated with Tp92 (5 μg/mL) for 12 hours, and the CCK‐8 assay was carried out to measure the total cell death rate. Data are expressed as the means ± standard deviations (n = 3). *P < 0.05 and **P < 0.01. C, Expression of TLR2 and TLR4 proteins in THP‐1 cells pretreated with TLR2 and TLR4 interference plasmids for 24 hours. Western blotting was used to determine protein expression
Figure 8
Figure 8
Effect of the Tp92 protein on PBMCs. A, Fluorescence intensity of monocytes (CD14), T cells (CD3) and dendritic cells (HLADR) among PBMCs. The cells were treated with Tp92 (5 μg/mL) for 12 hours and then incubated with FITC‐conjugated anti‐CD14, anti‐CD3 or anti‐HLADR antibody at 4°C in the dark for 1 hour before flow cytometry. B, CD14 expression on the surfaces of THP‐1 cells pretreated with Tp92. The cells were treated with Tp92 (5 μg/mL) for 12 hours and then incubated with FITC‐conjugated anti‐CD14 antibody at 4°C in the dark for 1 hour before flow cytometry. *P < 0.05
Figure 9
Figure 9
Effect of the Tp92 protein on PBMCs. Concentration of IL‐8 secreted by PBMCs, as determined by ELISA. The cells were treated with Tp92 (5 μg/mL) for 12 hours before ELISA. *P < 0.05
Figure 10
Figure 10
Effect of Tp92 on the secretion of cytokines by THP‐1 cells. A and B, Concentrations of secreted cytokines determined by ELISA. The cells were treated with (A) 0, 0.1, 2.5, 5.0, 7.5 or 10.0 μg/mL Tp92 or LPS (1 μg/mL)+Nig(5 μM) for 12 hours or (B) 5.0 μg/mL Tp92 for 0, 4, 8, 12, 24 or 48 hours. *P < 005 compared with (A) PBS or (B) 0 hour. C and D, Effect of the NF‐κB inhibitor QNZ on the secretion of IL‐8. C, Concentration of secreted IL‐8 measured by ELISA. The cells were pretreated with QNZ (10 nM) for 1 hour before treatment with the control (DMSO), Tp92 (5 μg/mL) or LPS (1 μg/mL) for 12 hours. *P < 005. D, NF‐κB protein expression in cells treated with Tp92 (5 μg/mL) or Tp92 (5 μg/mL)+QNZ (10 nM)
Figure 11
Figure 11
Mechanism by which the Tp92 protein mediates IL‐8 secretion. A and B, Concentration of secreted IL‐8 measured by ELISA. A, The cells were pretreated with CD14 (10 μg/mL), TLR2 (10 μg/mL) or TLR4 (10 μg/mL) for 1 hour before treatment with Tp92 (5 μg/mL), PGN (10 μg/mL), or LPS (1 μg/mL) for 12 hours. *P < 005. B, The cells were pretreated with the siRNA of TLR2 (2 μg/mL) and TLR4 (2 μg/mL) for 24 hours before treatment with Tp92 (5 μg/mL) for 12 hours. *P < 005
Figure 12
Figure 12
The outer membrane protein Tp92 of Treponema pallidum induces human mononuclear cell death and IL‐8 secretion

Similar articles

Cited by

References

    1. Stamm LV. Syphilis: re‐emergence of an old foe. Microb Cell. 2016;3:363‐370. - PMC - PubMed
    1. Baughn RE, Musher DM. Secondary syphilitic lesions. Clin Microbiol Rev. 2005;18:205‐216. - PMC - PubMed
    1. Salavec M, Bostik V, Kapla J, et al. A repeated syphilis infection imported from Thailand in an HIV positive couple of men‐who‐have‐sex‐with‐men in Czech Republic. Travel Med Infect Dis. 2014;12:84‐87. - PubMed
    1. Miao EA, Leaf IA, Treuting PM, et al. Caspase‐1‐induced pyroptosis is an innate immune effector mechanism against intracellular bacteria. Nat Immunol. 2010;11:1136‐1142. - PMC - PubMed
    1. Lamkanfi M, Dixit VM. Manipulation of host cell death pathways during microbial infections. Cell Host Microbe. 2010;8:44‐54. - PubMed

Publication types

MeSH terms