. 2018 Nov;183(4):588-600.
doi: 10.1111/bjh.15578. Epub 2018 Sep 14.

Direct role of FLT3 in regulation of early lymphoid progenitors

Affiliations

Direct role of FLT3 in regulation of early lymphoid progenitors

Alya Zriwil et al. Br J Haematol. 2018 Nov.

Abstract

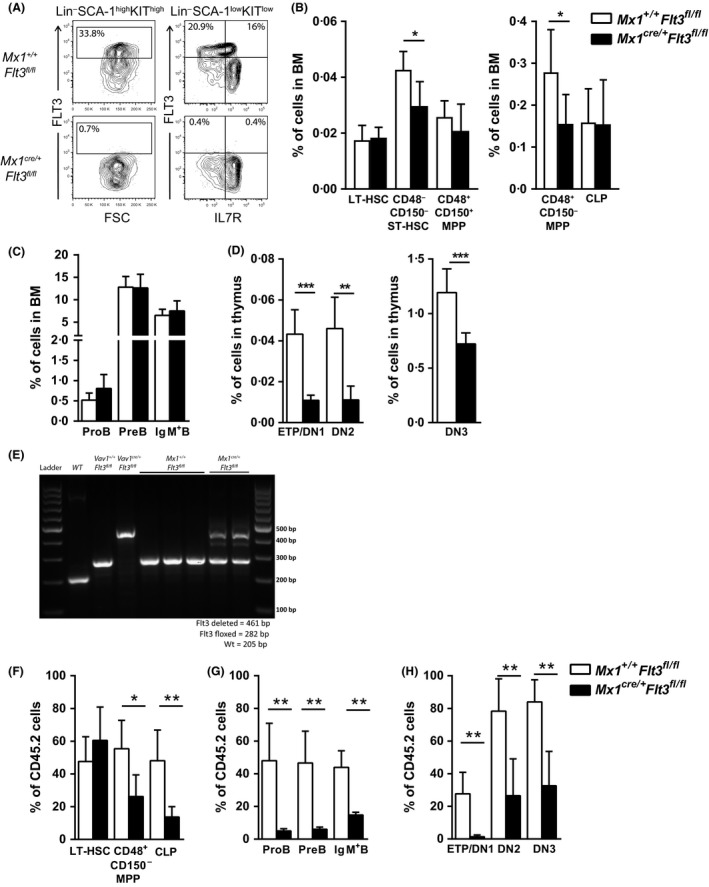
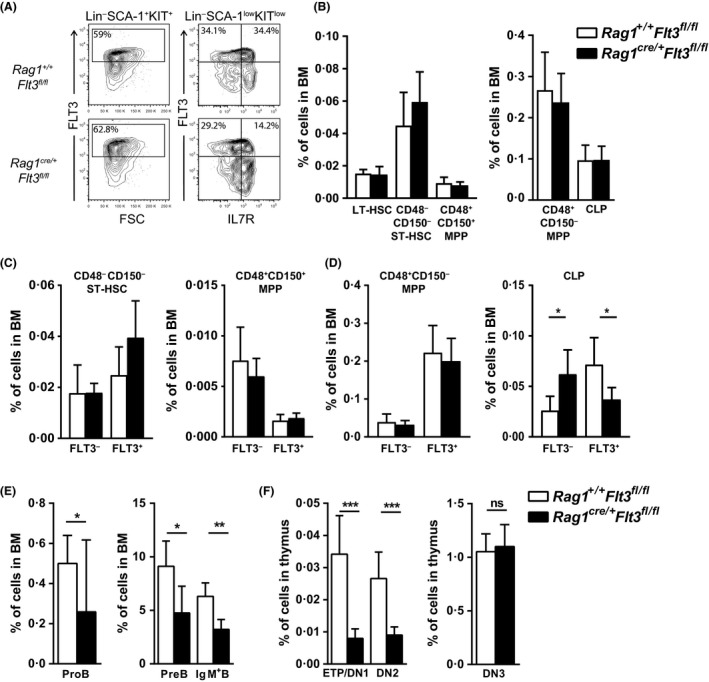
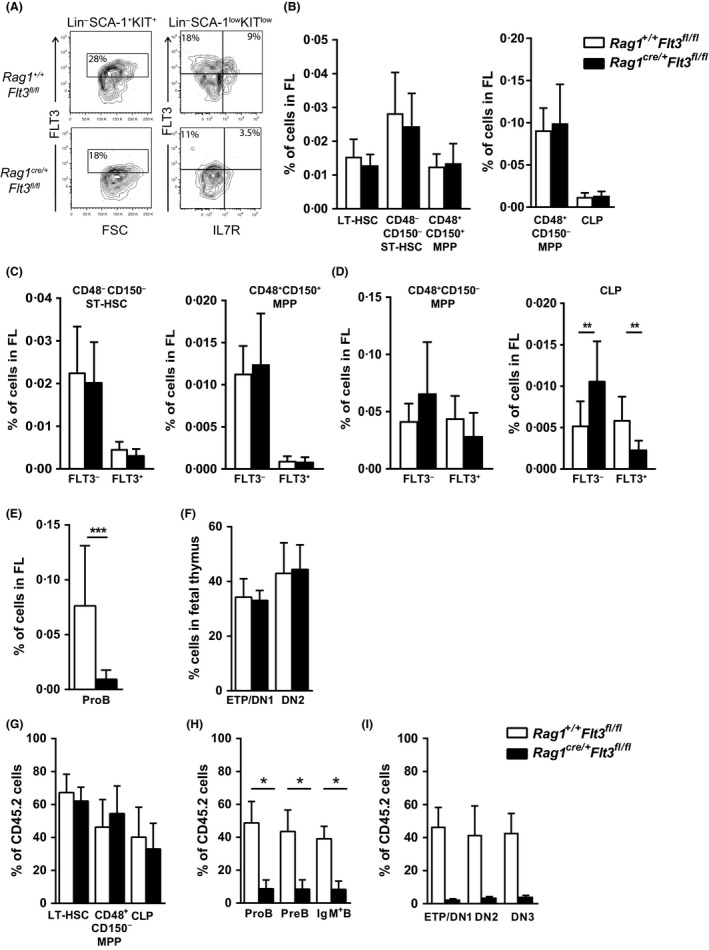
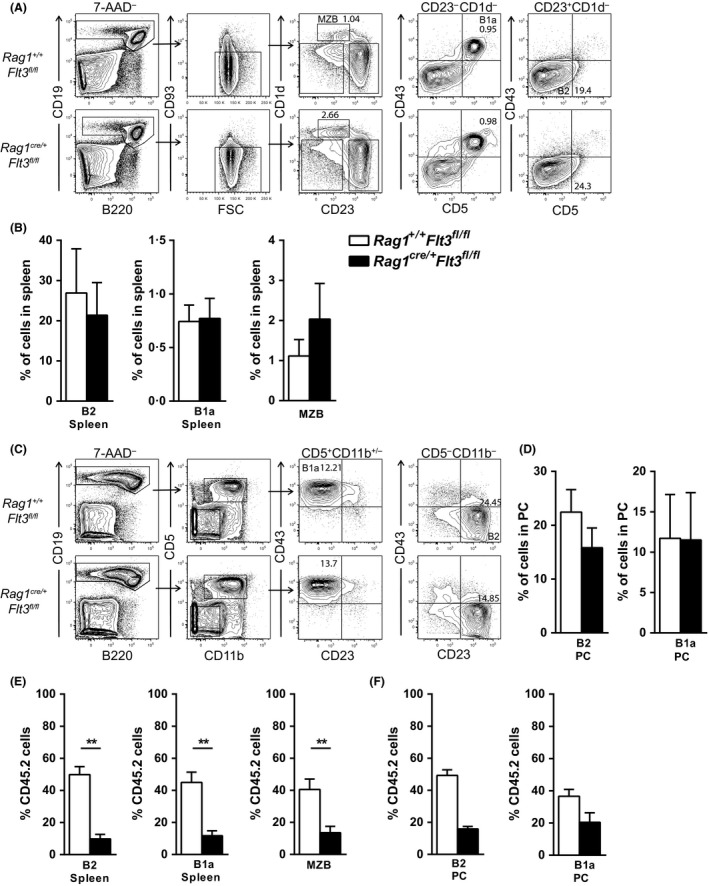
Given that FLT3 expression is highly restricted on lymphoid progenitors, it is possible that the established role of FLT3 in the regulation of B and T lymphopoiesis reflects its high expression and role in regulation of lymphoid-primed multipotent progenitors (LMPPs) or common lymphoid progenitors (CLPs). We generated a Flt3 conditional knock-out (Flt3fl/fl) mouse model to address the direct role of FLT3 in regulation of lymphoid-restricted progenitors, subsequent to turning on Rag1 expression, as well as potentially ontogeny-specific roles in B and T lymphopoiesis. Our studies establish a prominent and direct role of FLT3, independently of the established role of FLT3 in regulation of LMPPs and CLPs, in regulation of fetal as well as adult early B cell progenitors, and the early thymic progenitors (ETPs) in adult mice but not in the fetus. Our findings highlight the potential benefit of targeting poor prognosis acute B-cell progenitor leukaemia and ETP leukaemia with recurrent FLT3 mutations using clinical FLT3 inhibitors.

Keywords: FLT3; conditional knock‐out mouse model; haematopoiesis; lymphoid development; lymphoid progenitors.


Figures

Figure 1
Figure 1
Role of FLT3 in steady‐state adult haematopoiesis. (A) Representative fluorescence‐activated cell sorting (FACS) profiles showing FLT3 surface expression on LinSCA‐1+KIT+ cells and LinSCA‐1lowKITlow cells in Mx1 +/+ Flt3 fl/fl compared to Mx1 cre/+ Flt3 fl/fl bone marrow (BM) (numbers represent mean percentages of 6–8 mice per genotype) 4 weeks after polyinositolic polycytidylic acid (pIpC) injection. In addition to isotype control and Fluorescence Minus One (FMO) controls, gates for FLT3 expression were set using long‐term haematopoietic stem cells (LTHSCs) as a negative internal reference population (IRP), to improve the reliable detection of FLT3 positive and negative cells, as HSCs have been established to lack cell surface FLT3 expression (Adolfsson et al, 2001). (B–C) Mean percentages (±SD of total BM cells) of (B) LTHSCs (LinSCA1+KIT+CD48‐CD150+), CD48 CD150 short‐term (ST)‐HSCs (LinSCA‐1+KIT+CD48CD150), CD48+ CD150+ multipotent progenitors (MPPs) (LinSCA‐1+KIT+CD48+CD150+), CD48+ CD150 MPPs (LinSCA‐1+KIT+CD48+CD150) and common lymphoid progenitors (CLPs) (LinSCA‐1lowKITlowIL‐7R+), (C) ProB cells (LinB220+ CD43+ CD19+ CD24+ CD93+), PreB cells (LinB220+ CD43 CD19+IgM) and IgM+ B cells (LinB220+ CD43 CD19+IgM+) in 12‐week‐old Mx1 +/+ Flt3 fl/fl and Mx1 cre/+ Flt3 fl/fl mice (n = 6–8 mice per genotype in 3 experiments) 4 weeks after pIpC injection. (D) Mean percentages (±SD of total thymus cells) of early thymic progenitors (ETPs) (Lin CD4 CD8a KIT + CD25), Double Negative 2 (DN2) (Lin CD4 CD8a KIT + CD25+) and Double Negative 3 (DN3) (Lin CD4 CD8a KIT CD25+) cells in 12‐week‐old Mx1 +/+ Flt3 fl/fl and Mx1 cre/+ Flt3 fl/fl mice (n = 6–8 mice per genotype in 3 experiments) 4 weeks after pIpC injection. (E) Polymerase chain reaction analysis of recombination at the Flt3 locus in ProB cells in Mx1 +/+ Flt3 fl/fl and Mx1 cre/+ Flt3 fl/fl mice 4 weeks after pIpC injection. Also shown are Vav1 +/+ Flt3 fl/fl, Vav1 cre/+ Flt3 fl/fl and wild type (WT) controls. The upper band represents the deleted Flt3 allele (461 bp), the middle band the floxed Flt3 allele (282 bp) and the lower band the WT allele (205 bp). (F–H) Mean percentages (±SD) contribution of CD45.2 cells to (F) LTHSCs, CD48+ CD150 MPPs and CLPs, (G) ProB cells, PreB cells and IgM+ B cells in BM and (H) ETP, DN2 and DN3 cells in thymus of mice transplanted with 2 × 106 cells unfractionated BM cells from Mx1 +/+ Flt3 fl/fl (CD45.2) or Mx1 cre/+ Flt3 fl/fl (CD45.2) mice (n = 6 per genotype) together with 2 × 106 cells unfractionated BM competitor cells from WT CD45.1 mice, analysed 8 weeks post‐transplantation and 4 weeks after pIpC injection. *P < 0·05; **P < 0·01; ***P < 0·001.
Figure 2
Figure 2
Role of FLT3 in adult lymphoid‐committed progenitors. (A) Representative fluorescence‐activated cell sorting (FACS) profiles showing FLT3 surface expression on LinSCA‐1+KIT+ cells and LinSCA‐1lowKITlow cells in Rag1 +/+ Flt3 fl/fl compared to Rag1 cre/+ Flt3 fl/fl bone marrow (BM) (numbers represent mean percentages of 7 mice per genotype). Gates were set using long‐term haematopoietic stem cells (LTHSCs) as a negative internal reference population (IRP). (B) Mean percentages (±SD of total BM cells) of CD48 CD150+ LTHSCs, CD48 CD150 short‐term (ST)‐HSCs, CD48+ CD150+ multipotent progenitors (MPPs), CD48+ CD150 MPPs and common lymphoid progenitors (CLPs) in 12‐week‐old Rag1 +/+ Flt3 fl/fl and Rag1 cre/+ Flt3 fl/fl mice (n = 7 mice per genotype in 2 experiments). (C–D) Mean percentages (±SD of total BM cells) FLT3 and FLT3+ subsets of (C) CD48 CD150 STHSCs, CD48+ CD150+ MPPs and (D) CD48+ CD150 MPPs and CLPs in 12‐week‐old Rag1 +/+ Flt3 fl/fl and Rag1 cre/+ Flt3 fl/fl mice (n = 7 mice per genotype in 2 experiments). (E) Mean percentages (±SD of total BM cells) of ProB cells, PreB cells and IgM+ B cells in 12‐week‐old Rag1 +/+ Flt3 fl/fl and Rag1 cre/+ Flt3 fl/fl mice (n = 7 mice per genotype in 2 experiments). (F) Mean percentages (±SD of total thymus cells) of early thymic progenitor (ETP), Double Negative 2 (DN2) and Double Negative 3 (DN3) cells in 12‐weekold adult thymus from Rag1 +/+ Flt3 fl/fl and Rag1 cre/+ Flt3 fl/fl mice (n = 7 mice per genotype in 2 experiments). *P < 0·05; **P < 0·01; ***P < 0·001; ns, not significant.
Figure 3
Figure 3
Role of FLT3 in fetal lymphoid‐committed progenitors. (A) Representative fluorescence‐activated cell sorting (FACS)profiles showing FLT3 surface expression on LinSCA‐1+KIT+ cells and LinSCA‐1lowKITlow cells in Rag1 +/+ Flt3 fl/fl compared to Rag1 cre/+ Flt3 fl/fl E14.5 fetal liver (FL) cells (numbers represent mean percentages of 8–11 embryos per genotype). (B) Mean percentages (±SD of total FL cells) of CD48 CD150+ long‐term haematopoietic stem cells (LTHSCs), CD48 CD150 short‐term (ST)‐HSCs, CD48+ CD150+ multipotent progenitors (MPPs), CD48+ CD150 MPPs and common lymphoid progenitors (CLPs) in E14.5 Rag1 +/+ Flt3 fl/fl and Rag1 cre/+ Flt3 fl/fl embryos (n = 8–11 embryos per genotype in 2 experiments). (C–D) Mean percentages (±SD of total FL cells) FLT3 and FLT3+ subsets of (C) CD48 CD150 STHSCs, CD48+ CD150+ MPPs and (D) CD48+ CD150 MPPs and CLPs in E14.5 Rag1 +/+ Flt3 fl/fl and Rag1 cre/+ Flt3 fl/fl embryos (n = 8–11 embryos per genotype in 2 experiments). (E) Mean percentages (±SD of total FL cells) of ProB cells in E14.5 Rag1 +/+ Flt3 fl/fl and Rag1 cre/+ Flt3 fl/fl embryos (n = 8–11 embryos per genotype in 2 experiments). (F) Mean percentages (±SD of total fetal thymus cells) of early thymic progenitor (ETP) and Double Negative 2 (DN2) cells in E14.5 Rag1 +/+ Flt3 fl/fl and Rag1 cre/+ Flt3 fl/fl embryos (n = 4–7 embryos per genotype in 1 experiment). (G–I) Mean percentages (±SD) contribution of CD45.2 cells to (G) LTHSCs, CD48+ CD150 MPPs and CLPs, (H) ProB cells, PreB cells, and IgM+ B cells in bone marrow and (I) ETP, DN2 and Double Negative 3 (DN3) cells in thymus of lethally‐irradiated CD45.1 mice transplanted with 2 × 106 cells unfractionated E14.5 FL cells from Rag1 +/+ Flt3 fl/fl (CD45.2) or Rag1 cre/+ Flt3 fl/fl (CD45.2) mice (n = 5 per genotype) together with 2 × 106 cells unfractionated E14.5 FL competitor cells from wild type CD45.1 embryos, analysed 8 weeks post‐transplantation. *P < 0·05; **P < 0·01; ***P < 0·001.
Figure 4
Figure 4
Role of FLT3 in generation of distinct subsets of B cells. (A) Representative fluorescence‐activated cell sorting (FACS)profiles of Follicular B2 cells (CD19+ CD93 CD5 CD43 CD23+ CD1d), Marginal Zone B cells (MZB: CD19+ CD93 CD23‐CD1d+) and B1a cells (CD19+ CD93 CD5+ CD43+ CD23 CD1d) in spleen in 12‐week‐old Rag1 +/+ Flt3 fl/fl and Rag1 cre/+ Flt3 fl/fl mice (numbers in gates represent percentages of total spleen cells). (B) Mean percentages (±SD of total spleen cells) of follicular B2, MZB and B1a cells in 12‐week‐old Rag1 +/+ Flt3 fl/fl and Rag1 cre/+ Flt3 fl/fl mice (n = 6 mice per genotype in 2 experiments). (C) Representative FACS profiles of B2 cells (CD19+ CD5 CD43 CD23+ CD11b) and B1a cells (CD19+ CD5+ CD43+ CD23) in the peritoneal cavity (PC) of 12‐week‐old Rag1 +/+ Flt3 fl/fl and Rag1 cre/+ Flt3 fl/fl mice (numbers in gates represent percentages of total PC cells). (D) Mean percentages (±SD of total PC cells) B2 cells and B1a cells of 12‐week‐old Rag1 +/+ Flt3 fl/fl and Rag1 cre/+ Flt3 fl/fl mice (n = 6 mice per genotype in 2 experiments). (E–F) Mean percentages (±SD) contribution of CD45.2 cells to (E) follicular B2 cells, MZB cells and B1a cells in the spleen and to (F) B2 cells and B1a cells in the PC of CD45.1 wild type (WT) mice transplanted with 2 × 106 unfractionated E14.5 FL cells from Rag1 +/+ Flt3 fl/fl (CD45.2) or Rag1 cre/+ Flt3 fl/fl (CD45.2) mice (n = 2–5 per genotype) together with 2 × 106 cells unfractionated E14.5 FL WT CD45.1 competitor cells, analysed 8 weeks post‐transplantation.

Similar articles

Cited by

References

    1. Adolfsson, J. , Borge, O.J. , Bryder, D. , Theilgaard‐Monch, K. , Astrand‐Grundstrom, I. , Sitnicka, E. , Sasaki, Y. & Jacobsen, S.E. (2001) Upregulation of Flt3 expression within the bone marrow Lin(‐)Sca1(+)c‐kit(+) stem cell compartment is accompanied by loss of self‐renewal capacity. Immunity, 15, 659–669. - PubMed
    1. Adolfsson, J. , Mansson, R. , Buza‐Vidas, N. , Hultquist, A. , Liuba, K. , Jensen, C.T. , Bryder, D. , Yang, L. , Borge, O.J. , Thoren, L.A. , Anderson, K. , Sitnicka, E. , Sasaki, Y. , Sigvardsson, M. & Jacobsen, S.E. (2005) Identification of Flt3+ lympho‐myeloid stem cells lacking erythro‐megakaryocytic potential a revised road map for adult blood lineage commitment. Cell, 121, 295–306. - PubMed
    1. Almarza, E. , Segovia, J.C. , Guenechea, G. , Gomez, S.G. , Ramirez, A. & Bueren, J.A. (2004) Regulatory elements of the vav gene drive transgene expression in hematopoietic stem cells from adult mice. Experimental Hematology, 32, 360–364. - PubMed
    1. Annesley, C.E. & Brown, P. (2014) The biology and targeting of FLT3 in pediatric leukemia. Frontiers in Oncology, 4, 263. - PMC - PubMed
    1. Armstrong, S.A. , Mabon, M.E. , Silverman, L.B. , Li, A. , Gribben, J.G. , Fox, E.A. , Sallan, S.E. & Korsmeyer, S.J. (2004) FLT3 mutations in childhood acute lymphoblastic leukemia. Blood, 103, 3544–3546. - PubMed

Publication types

MeSH terms