. 2018 Dec 31;14(12):e1007856.
doi: 10.1371/journal.pgen.1007856. eCollection 2018 Dec.

Bayesian multiple logistic regression for case-control GWAS

Affiliations

Bayesian multiple logistic regression for case-control GWAS

Saikat Banerjee et al. PLoS Genet. .

Abstract

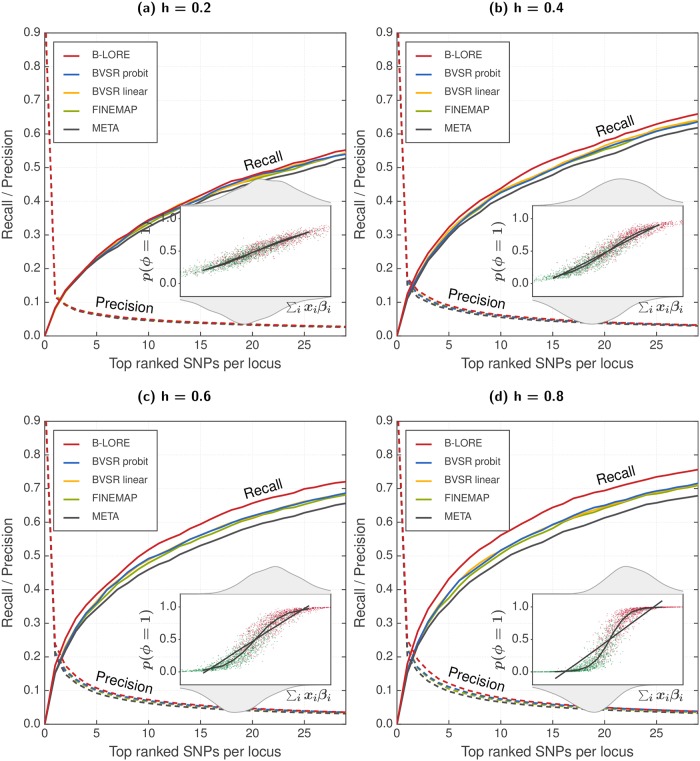
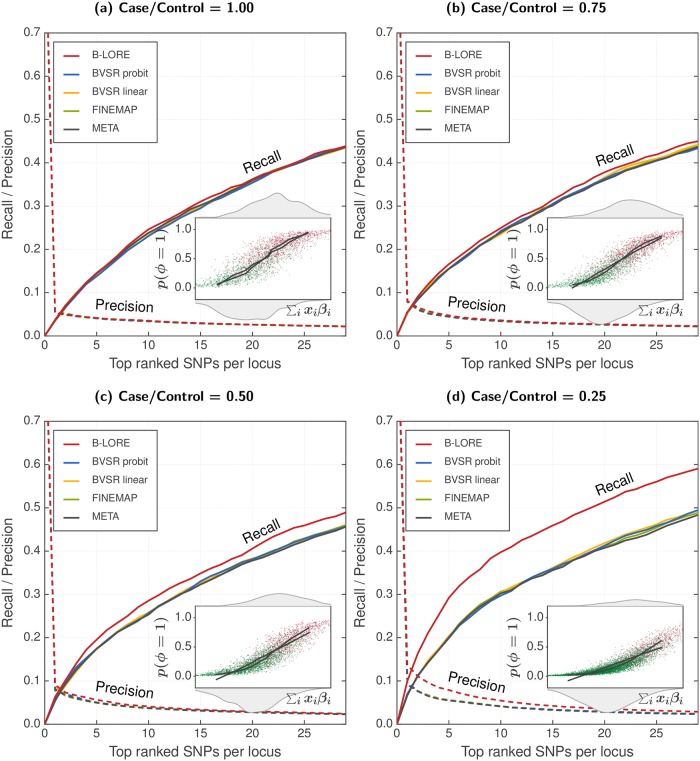
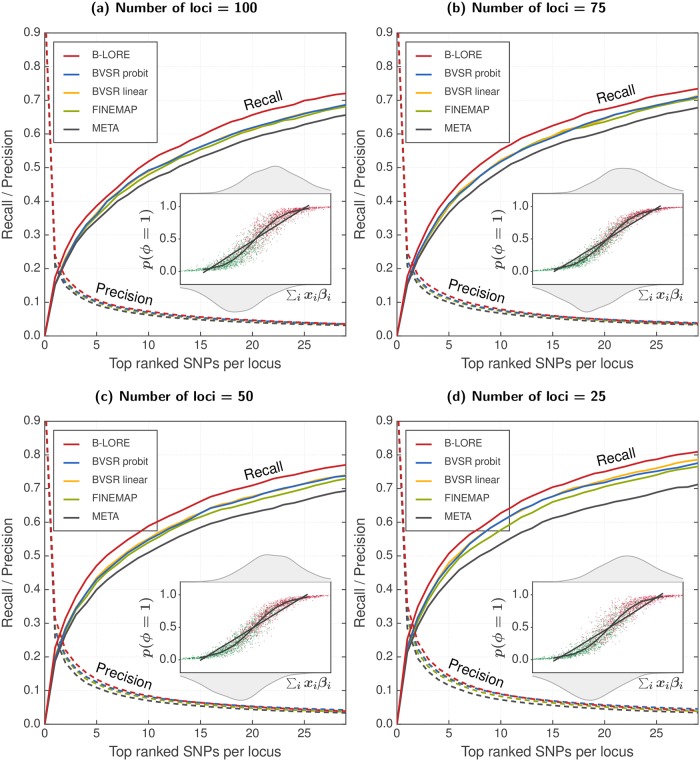
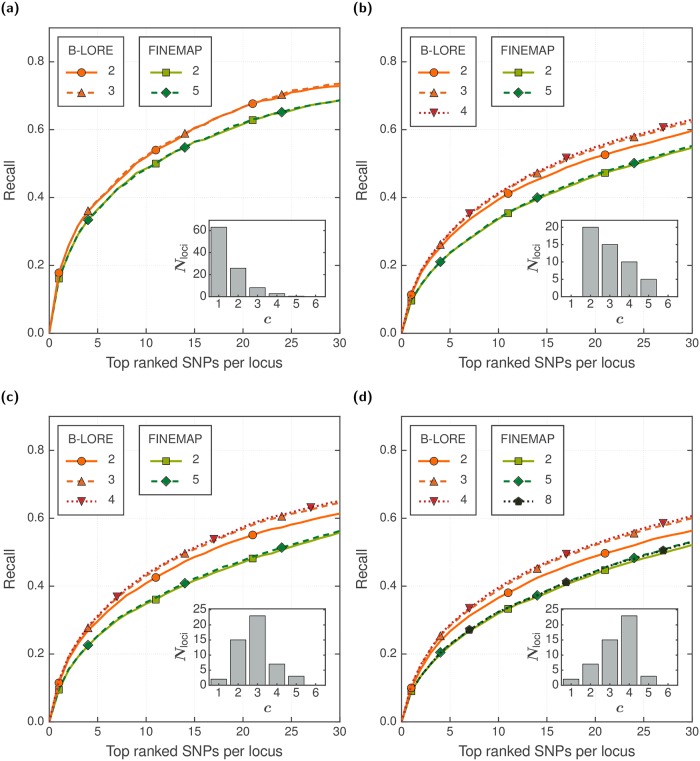
Genetic variants in genome-wide association studies (GWAS) are tested for disease association mostly using simple regression, one variant at a time. Standard approaches to improve power in detecting disease-associated SNPs use multiple regression with Bayesian variable selection in which a sparsity-enforcing prior on effect sizes is used to avoid overtraining and all effect sizes are integrated out for posterior inference. For binary traits, the logistic model has not yielded clear improvements over the linear model. For multi-SNP analysis, the logistic model required costly and technically challenging MCMC sampling to perform the integration. Here, we introduce the quasi-Laplace approximation to solve the integral and avoid MCMC sampling. We expect the logistic model to perform much better than multiple linear regression except when predicted disease risks are spread closely around 0.5, because only close to its inflection point can the logistic function be well approximated by a linear function. Indeed, in extensive benchmarks with simulated phenotypes and real genotypes, our Bayesian multiple LOgistic REgression method (B-LORE) showed considerable improvements (1) when regressing on many variants in multiple loci at heritabilities ≥ 0.4 and (2) for unbalanced case-control ratios. B-LORE also enables meta-analysis by approximating the likelihood functions of individual studies by multivariate normal distributions, using their means and covariance matrices as summary statistics. Our work should make sparse multiple logistic regression attractive also for other applications with binary target variables. B-LORE is freely available from: https://github.com/soedinglab/b-lore.


Conflict of interest statement

The authors have declared that no competing interests exist.

Figures

Fig 1
Fig 1. Multiple logistic regression improves fine-mapping in case-control GWAS.
We simulated 13082 phenotypes using 100 loci of ∼200 SNPs, as described in the main text. We compared the ranking of SNPs at each locus using recall (solid lines, left y-axis) and precision (dotted lines, right y-axis), which were averaged over 100 loci and 20 simulation replicates. All methods were run with a maximum of two causal SNPs per locus. Panels (a)–(d) show the results at different heritabilities, hg2=0.2,0.4,0.6and0.8. Insets schematically compare the logistic model with the linear model. We plot the true ∑i xi βi from the simulation for each individual along the x-axis, and show the distribution of cases and controls on the top and bottom axes respectively. On the y-axis, we show the predicted probability of being causal using a logistic model (p(ϕ = 1), red for cases and green for controls). The black lines are quantile averages of the linear predictor and the logistic predictor. With increasing heritability, the predicted disease probability spreads away from 0.5, where the logistic model becomes increasingly better than the linear model to explain the data and B-LORE shows increasingly more recall over other methods. The improvement by B-LORE over other multi-SNP analyses is more significant than the improvement by multi-SNP over single-SNP analyses.
Fig 2
Fig 2. Multiple logistic regression improves power of GWAS with additional controls.
We simulated phenotypes with varying case/control ratio—(a) 1625/1625, (b) 1625/3250, (c) 1625/4875 and (d) 1625/6500 respectively—using 100 loci of ∼200 SNPs, as described in the main text. All simulations used hg2=0.4. We compared the ranking of SNPs at each locus using recall (solid lines, left y-axis) and precision (dotted lines, right y-axis), which were averaged over 100 loci and 20 simulation replicates. All methods were run with a maximum of two causal SNPs per locus. Insets schematically compare logistic model with linear model (see Fig 1 for details). B-LORE shows increasingly more recall over other methods with addition of more controls, i.e., decreasing case/control ratio, because the logistic function becomes increasingly better than the linear function to model the data.
Fig 3
Fig 3. The advantage of B-LORE does not depend on the number of loci used for estimation.
Panels (a)—(d) show results from simulations using 25, 50, 75 and 100 loci respectively. As described in the main text, we used 13082 samples and each locus had ∼200 SNPs. All simulations used total heritability of hg2=0.6 and hence the heritability per locus is different for the different panels. We compared the ranking of SNPs at each locus using recall (solid lines, left y-axis) and precision (dotted lines, right y-axis), which were averaged over the loci and the simulation replicates. All methods were run with a maximum of two causal SNPs per locus. Different panels show the results at different number of loci. Insets schematically compare logistic model with linear model in one simulation (see Fig 1 for details). The heritability per locus increases when the number of loci is reduced. Multiple regression becomes increasingly better than single SNP analysis, but the advantage of B-LORE over other multiple regression methods does not change with the number of loci. Note also that the comparison between logistic model and the linear model in the insets does not change with the number of loci.
Fig 4
Fig 4. Effect of number of causal SNPs in B-LORE fine-mapping accuracy.
We simulated 13082 phenotypes using 100 loci of ∼200 SNPs, as described in the main text. Panels (a)—(d) show the results using different hypothetical distributions of true causal SNPs in each simulation The distributions of the true causal SNPs were generated ad hoc and are shown in the inset of every panel. All simulations used hg2=0.6. We compared the ranking of SNPs at each locus by B-LORE and FINEMAP using recall (solid lines, left y-axis) averaged over the loci and the simulation replicates. Both methods were run with different number of causal SNPs allowed in the model (‖c1, see legends). FINEMAP was run on each locus separately and B-LORE was run on all loci together. For each method, we stopped increasing ‖c1 if the recall did not improve. The symbols are merely visual guides to distinguish between the different methods.
Fig 5
Fig 5. Association of genetic loci with CAD.
Comparison of ranking of 50 genetic loci using meta-analysis across 5 cohorts (GerMIFS I-V [–26]) with a total of 6234 cases and 6848 controls from white European ancestry. We first used meta-analysis of genome-wide SNPTEST summary statistics on these 5 small GWAS to select the top 50 loci and then applied B-LORE on these loci assuming a maximum of five causal SNPs per locus. On the x-axis of the scatter plot, we show the −log10(p) values obtained from META, and on the y-axis we show the probability of a locus being causal, obtained from B-LORE. The legend shows the classification of all the 50 CAD loci based on prior evidence of association in existing literature (see Real data analysis: GWAS for Coronary Artery Disease (CAD) and S1 Table). This literature-based classification gives a reasonable “ground truth” of causal and non-causal loci, despite our incomplete knowledge about true underlying association in reality.
Fig 6
Fig 6. Representative examples of fine-mapping in CAD-associated loci.
The top parts in A and B show the posterior inclusion probability (PIP) for each SNP to be causal as predicted by B-LORE. Below we plot the −log10(p) values for each SNP obtained from SNPTEST / META. The four best SNPs predicted by B-LORE and SNPTEST / META are marked by special symbols and annotated in the legends. At the bottom, we show the genes in the region and a heatmap describing the LD between the SNPs. (a): A known locus near SMAD3. (A SNP rs56062135 at 67.45Mb was found associated with CAD by the CARDIoGRAMplusC4D study [26]). The probability for finding at least one causal SNP in the locus is Prcausal = 0.999. (b): A novel locus discovered by B-LORE, with Prcausal = 0.976.

References

    1. Visscher PM, Wray NR, Zhang Q, Sklar P, McCarthy MI, Brown MA, et al. 10 Years of GWAS Discovery: Biology, Function, and Translation. The American Journal of Human Genetics. 2017;101(1):5–22. 10.1016/j.ajhg.2017.06.005 - DOI - PMC - PubMed
    1. MacArthur J, Bowler E, Cerezo M, Gil L, Hall P, Hastings E, et al. The new NHGRI-EBI Catalog of published genome-wide association studies (GWAS Catalog). Nucleic Acids Research. 2017;45(D1):896–901. 10.1093/nar/gkw1133 - DOI - PMC - PubMed
    1. Zhou X, Peter C, Matthew S. Polygenic modeling with Bayesian sparse linear mixed models. PLOS Genetics. 2013;9(2):1–14. 10.1371/journal.pgen.1003264 - DOI - PMC - PubMed
    1. Servin B, Stephens M. Imputation-based analysis of association studies: Candidate regions and quantitative traits. PLOS Genetics. 2007;3(7):1–13. 10.1371/journal.pgen.0030114 - DOI - PMC - PubMed
    1. Guan Y, Stephens M. Bayesian variable selection regression for genome-wide association studies and other large-scale problems. Annals of Applied Statistics. 2011;5(3):1780–1815. 10.1214/11-AOAS455 - DOI

Publication types