

A new aging measure captures morbidity and mortality risk across diverse subpopulations from NHANES IV: A cohort study
- PMID: 30596641
- PMCID: PMC6312200
- DOI: 10.1371/journal.pmed.1002718
A new aging measure captures morbidity and mortality risk across diverse subpopulations from NHANES IV: A cohort study
Erratum in
-
Correction: A new aging measure captures morbidity and mortality risk across diverse subpopulations from NHANES IV: A cohort study.PLoS Med. 2019 Feb 25;16(2):e1002760. doi: 10.1371/journal.pmed.1002760. eCollection 2019 Feb. PLoS Med. 2019. PMID: 30802240 Free PMC article.
Abstract
Background: A person's rate of aging has important implications for his/her risk of death and disease; thus, quantifying aging using observable characteristics has important applications for clinical, basic, and observational research. Based on routine clinical chemistry biomarkers, we previously developed a novel aging measure, Phenotypic Age, representing the expected age within the population that corresponds to a person's estimated mortality risk. The aim of this study was to assess its applicability for differentiating risk for a variety of health outcomes within diverse subpopulations that include healthy and unhealthy groups, distinct age groups, and persons with various race/ethnic, socioeconomic, and health behavior characteristics.
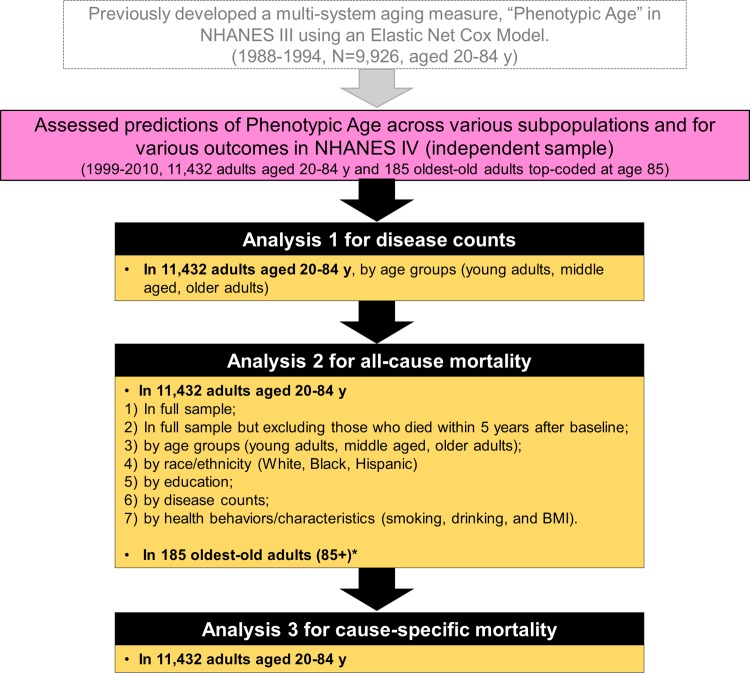
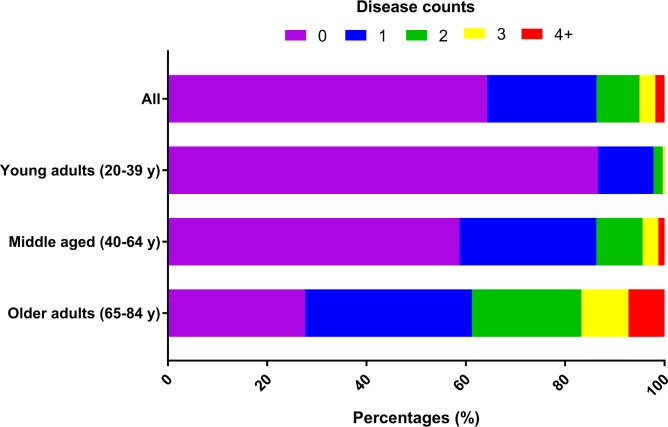
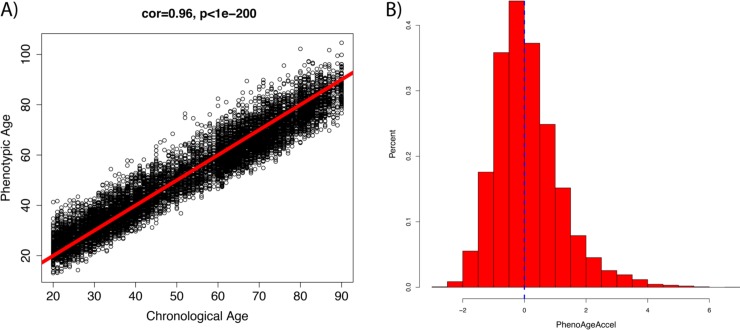
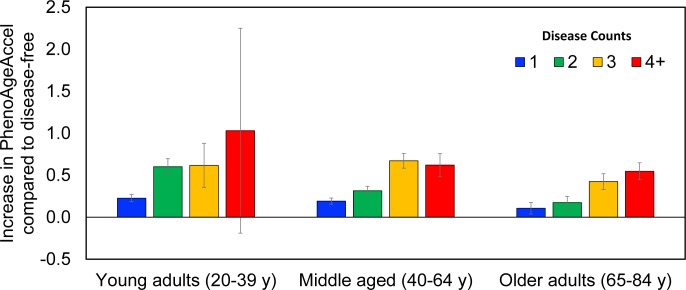
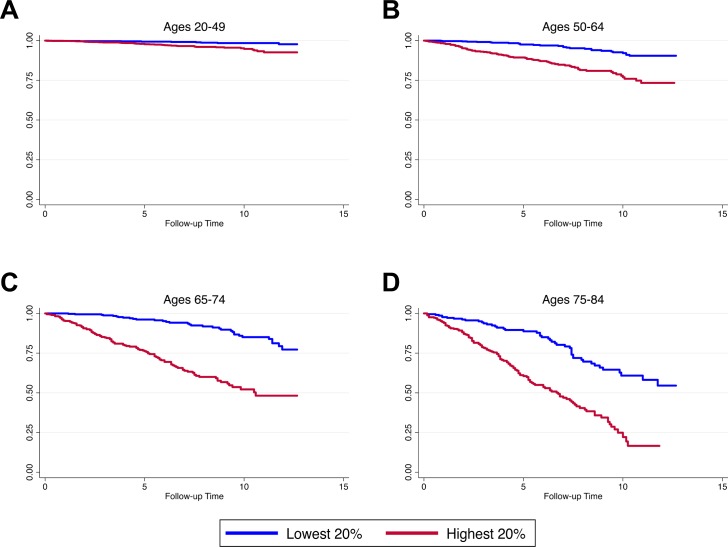
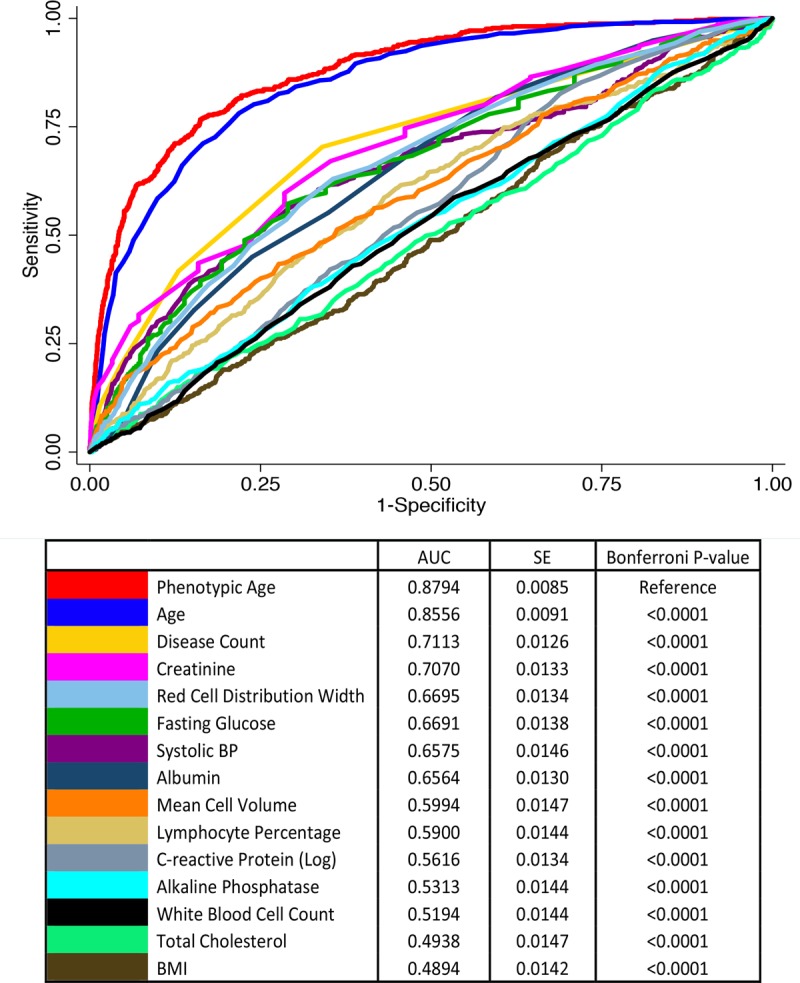
Methods and findings: Phenotypic Age was calculated based on a linear combination of chronological age and 9 multi-system clinical chemistry biomarkers in accordance with our previously established method. We also estimated Phenotypic Age Acceleration (PhenoAgeAccel), which represents Phenotypic Age after accounting for chronological age (i.e., whether a person appears older [positive value] or younger [negative value] than expected, physiologically). All analyses were conducted using NHANES IV (1999-2010, an independent sample from that originally used to develop the measure). Our analytic sample consisted of 11,432 adults aged 20-84 years and 185 oldest-old adults top-coded at age 85 years. We observed a total of 1,012 deaths, ascertained over 12.6 years of follow-up (based on National Death Index data through December 31, 2011). Proportional hazard models and receiver operating characteristic curves were used to evaluate all-cause and cause-specific mortality predictions. Overall, participants with more diseases had older Phenotypic Age. For instance, among young adults, those with 1 disease were 0.2 years older phenotypically than disease-free persons, and those with 2 or 3 diseases were about 0.6 years older phenotypically. After adjusting for chronological age and sex, Phenotypic Age was significantly associated with all-cause mortality and cause-specific mortality (with the exception of cerebrovascular disease mortality). Results for all-cause mortality were robust to stratifications by age, race/ethnicity, education, disease count, and health behaviors. Further, Phenotypic Age was associated with mortality among seemingly healthy participants-defined as those who reported being disease-free and who had normal BMI-as well as among oldest-old adults, even after adjustment for disease prevalence. The main limitation of this study was the lack of longitudinal data on Phenotypic Age and disease incidence.
Conclusions: In a nationally representative US adult population, Phenotypic Age was associated with mortality even after adjusting for chronological age. Overall, this association was robust across different stratifications, particularly by age, disease count, health behaviors, and cause of death. We also observed a strong association between Phenotypic Age and the disease count an individual had. These findings suggest that this new aging measure may serve as a useful tool to facilitate identification of at-risk individuals and evaluation of the efficacy of interventions, and may also facilitate investigation into potential biological mechanisms of aging. Nevertheless, further evaluation in other cohorts is needed.
Conflict of interest statement
The authors have declared that no competing interests exist.
Figures
References
-
- Ferrucci L, Hesdorffer C, Bandinelli S, Simonsick EM. Frailty as a nexus between the biology of aging, environmental conditions and clinical geriatrics. Public Health Rev. 2010;32(2):475.
-
- Benetos A, Okuda K, Lajemi M, Kimura M, Thomas F, Skurnick J, et al. Telomere length as an indicator of biological aging: the gender effect and relation with pulse pressure and pulse wave velocity. Hypertension. 2001;37(2 Pt 2):381–5. - PubMed
Publication types
MeSH terms
Grants and funding
LinkOut - more resources
Full Text Sources
Other Literature Sources
Medical
