

Comparative study for haplotype block partitioning methods - Evidence from chromosome 6 of the North American Rheumatoid Arthritis Consortium (NARAC) dataset
- PMID: 30596705
- PMCID: PMC6312333
- DOI: 10.1371/journal.pone.0209603
Comparative study for haplotype block partitioning methods - Evidence from chromosome 6 of the North American Rheumatoid Arthritis Consortium (NARAC) dataset
Abstract
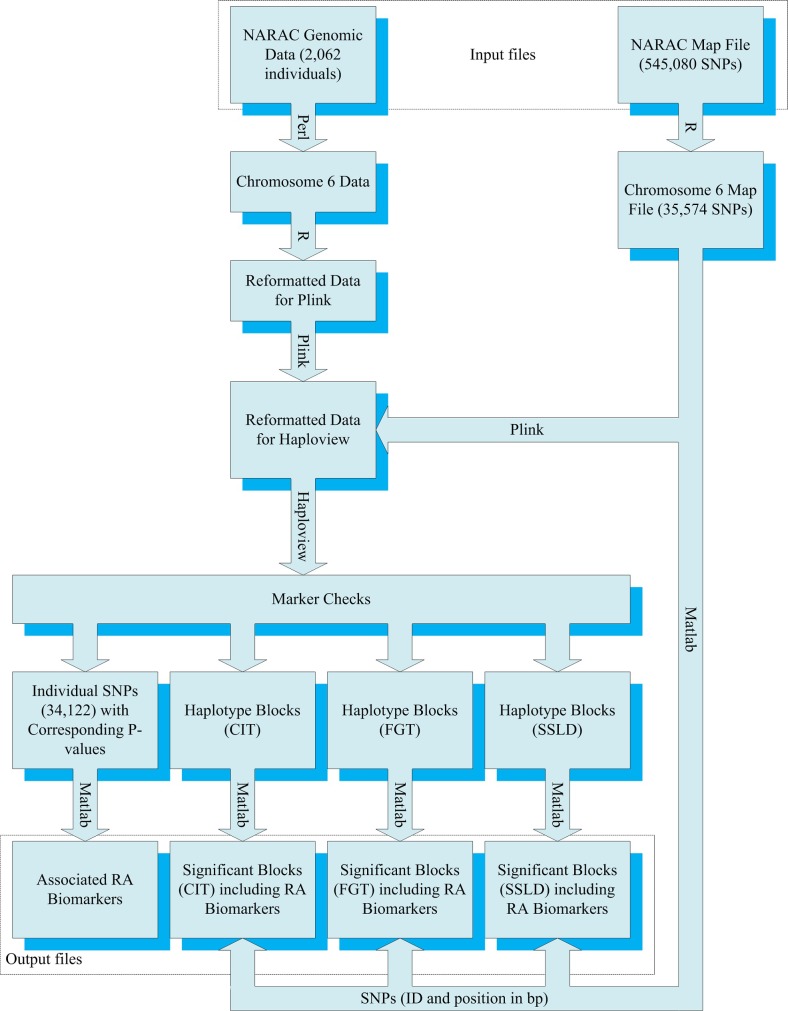
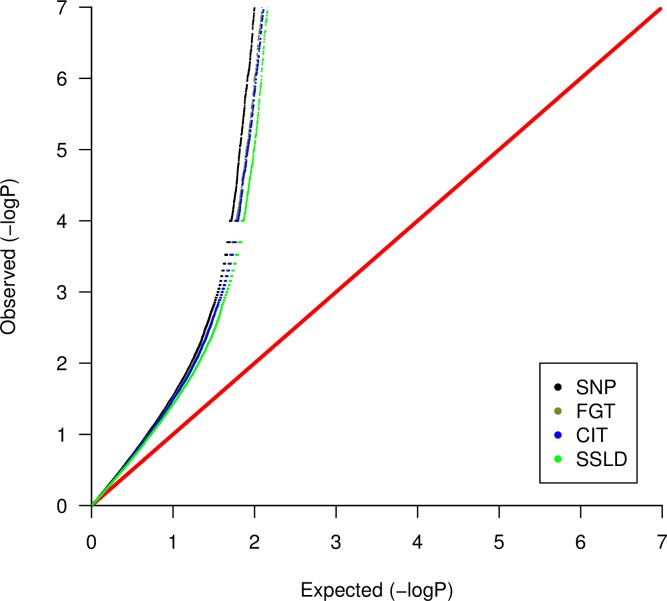
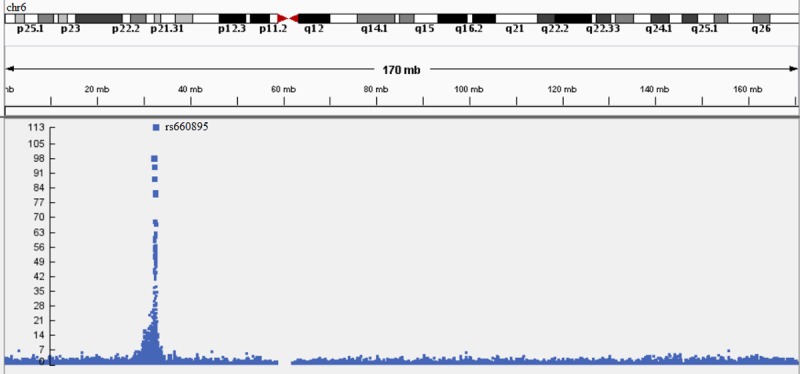
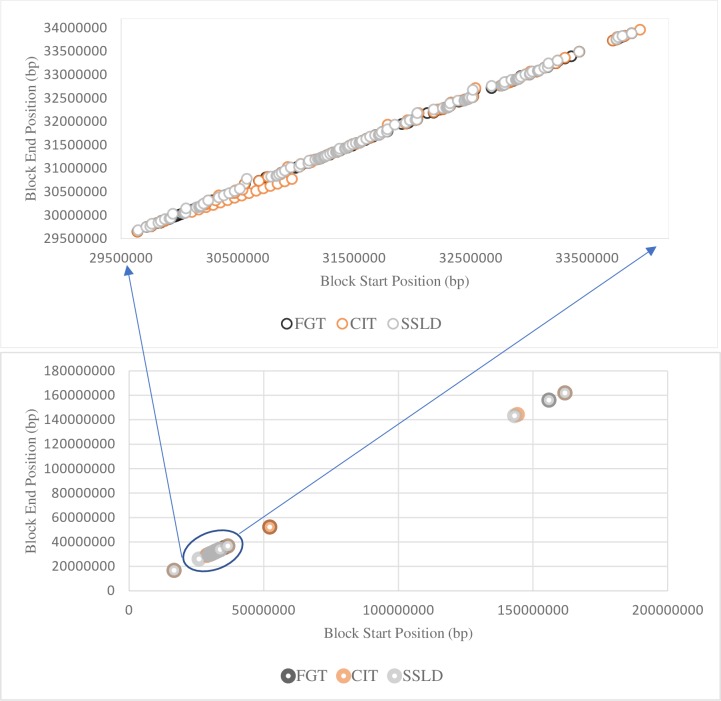
Haplotype-based methods compete with "one-SNP-at-a-time" approaches on being preferred for association studies. Chromosome 6 contains most of the known genetic biomarkers for rheumatoid arthritis (RA) disease. Therefore, chromosome 6 serves as a benchmark for the haplotype methods testing. The aim of this study is to test the North American Rheumatoid Arthritis Consortium (NARAC) dataset to find out if haplotype block methods or single-locus approaches alone can sufficiently provide the significant single nucleotide polymorphisms (SNPs) associated with RA. In addition, could we be satisfied with only one method of the haplotype block methods for partitioning chromosome 6 of the NARAC dataset? In the NARAC dataset, chromosome 6 comprises 35,574 SNPs for 2,062 individuals (868 cases, 1,194 controls). Individual SNP approach and three haplotype block methods were applied to the NARAC dataset to identify the RA biomarkers. We employed three haplotype partitioning methods which are confidence interval test (CIT), four gamete test (FGT), and solid spine of linkage disequilibrium (SSLD). P-values after stringent Bonferroni correction for multiple testing were measured to assess the strength of association between the genetic variants and RA susceptibility. Moreover, the block size (in base pairs (bp) and number of SNPs included), number of blocks, percentage of uncovered SNPs by the block method, percentage of significant blocks from the total number of blocks, number of significant haplotypes and SNPs were used to compare among the three haplotype block methods. Individual SNP, CIT, FGT, and SSLD methods detected 432, 1,086, 1,099, and 1,322 associated SNPs, respectively. Each method identified significant SNPs that were not detected by any other method (Individual SNP: 12, FGT: 37, CIT: 55, and SSLD: 189 SNPs). 916 SNPs were discovered by all the three haplotype block methods. 367 SNPs were discovered by the haplotype block methods and the individual SNP approach. The P-values of these 367 SNPs were lower than those of the SNPs uniquely detected by only one method. The 367 SNPs detected by all the methods represent promising candidates for RA susceptibility. They should be further investigated for the European population. A hybrid technique including the four methods should be applied to detect the significant SNPs associated with RA for chromosome 6 of the NARAC dataset. Moreover, SSLD method may be preferred for its favored benefits in case of selecting only one method.
Conflict of interest statement
The authors have declared that no competing interests exist.
Figures
References
-
- Peise E., Fabregat-Traver D. and Bientinesi P., "High performance solutions for big-data GWAS," Parallel Computing, vol. 42, pp. 75–87, 2015.
-
- Su S. C., Kuo C. C. and Chen T., "Single nucleotide polymorphism data analysis—state-of-the-art review on this emerging field from a signal processing viewpoint," IEEE Signal Process Mag, vol. 24, pp. 75–82, 2007.
Publication types
MeSH terms
Grants and funding
LinkOut - more resources
Full Text Sources
