. 2019 Feb 28;47(4):1786-1796.
doi: 10.1093/nar/gky1282.

Differential regulation of RNA polymerase III genes during liver regeneration

Affiliations

Differential regulation of RNA polymerase III genes during liver regeneration

Meghdad Yeganeh et al. Nucleic Acids Res. .

Abstract

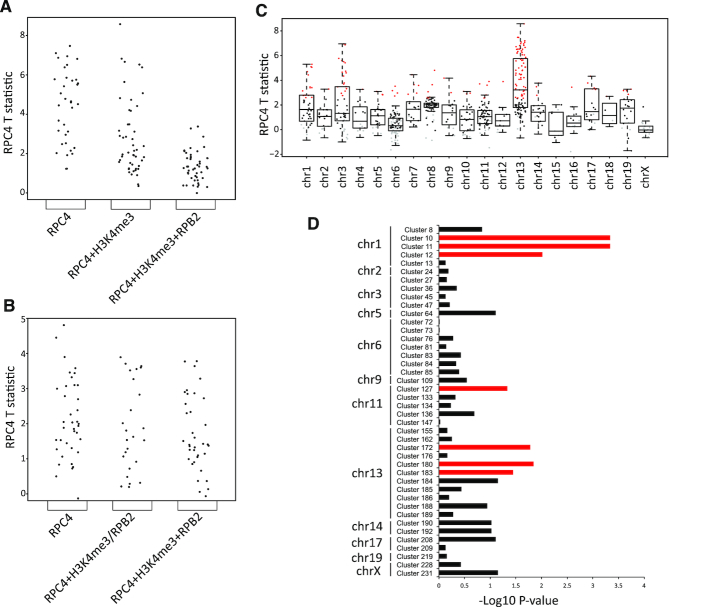
Mouse liver regeneration after partial hepatectomy involves cells in the remaining tissue synchronously entering the cell division cycle. We have used this system and H3K4me3, Pol II and Pol III profiling to characterize adaptations in Pol III transcription. Our results broadly define a class of genes close to H3K4me3 and Pol II peaks, whose Pol III occupancy is high and stable, and another class, distant from Pol II peaks, whose Pol III occupancy strongly increases after partial hepatectomy. Pol III regulation in the liver thus entails both highly expressed housekeeping genes and genes whose expression can adapt to increased demand.


Figures

Figure 1.
Figure 1.
(A) Average tag density profiles for the factors indicated in the left, for the isolated tRNA gene groups (columns). The profiles were computed from replicate 2. (B) Scatterplots of RPC4 scores for isolated tRNA genes in replicate 1 and 2. The grouping into tRNA gene groups was done for each replicate independently (for H3K4me3, only replicate 2 was used). P-value < 2e–4 for the two comparisons in both replicates (see text), permutation based t test with 10000 permutations. Red and blue dots, genes with and without associated CpG islands, respectively. (C) As in B, but the orange and green dots indicate genes >2.65 kb and <2.65 kb, respectively, from TSS or poly A site of Pol II genes.
Figure 2.
Figure 2.
(A) Distribution of RPC4 scores for Pol III genes across time and replicates. Dots represent Pol III genes, and their distribution is summarized with their median (thicker horizontal bar), lower/upper quartile (box) and ±1.5 times the interquartile range (end of whiskers). Genes with an RPC4 occupancy score below the cutoff in all time points and replicates are not shown. (B) Plot of T statistics estimated for the TP0 to TP36 transition as a function of the average RPC4 score across replicates at TP0. A positive value of the T statistic indicates a score increase from TP0 to TP36. Red and blue dots, loci with an associated FDR<0.05, with blue dots indicating loci with an RPC4 score below cutoff at TP0. Black dots, loci with an associated FDR >0.05. Gray dots, loci with scores below the cutoff at both TP0 and TP36. (C) RT-qPCR quantification (normalized to Actb mRNA level) of indicated precursor tRNAs, relative to the values at TP0. Error bars represent ± SD. n = 3. The P-values were calculated using Student's t-test. (D) RT-qPCR quantification (normalized to Actb mRNA level) of the indicated mRNAs, relative to the values at TP0. Error bars and P-values as in C. (E) RT-qPCR quantification of Polr3g relative to Polr3gl mRNA. Error bars as in C.
Figure 3.
Figure 3.
(A) Distribution of H3K4me3 scores around Pol III genes across time. Dots represent isolated Pol III loci whose H3K4me3 scores are above the cutoff. (B) Distribution of RPB2 scores around Pol III genes across time and replicates. Dots represent isolated Pol III loci whose RPB2 scores are above the cutoff. (C) Scatterplot of RPC4 scores T statistic and H3K4me3 fold change from TP0 to TP36. All Pol III loci are shown (n = 646). (D) Plot of RPB2 scores T statistic estimated for the transition TP0 to TP36 as a function of the RPB2 average score, across replicates, at TP0. RPB2 scores were computed in a region of ±1 kb around Pol III gene TSS. A positive value of the T statistic indicates an increase of score from TP0 to TP36. Red dots and black dots, genes with an associated FDR< and >0.05, respectively; grey dots, genes with RPB2 scores below cut-off. (E) Scatterplot of RPC4 and RPB2 scores T statistic, from TP0 to TP36. All Pol III loci are shown (n = 646). (F) Scatterplot of RPC4 T statistic and fold change of RPB2 occupancy at nearby Pol II TSS (±250 bp of the Pol II TSS). The Pol III loci considered (both isolated and not isolated) had RPC4 scores above the cutoff and were within 2.65 kb of a Pol II TSS with a corresponding RPB2 peak (n = 52).
Figure 4.
Figure 4.
(A) Scatterplot of RPC4 T statistic (between TP0 and TP36) for the indicated groups of isolated tRNA genes (RPC4 peak only, n = 35; RPC4 + H3K4me3 peaks, n = 48); RPC4 + H3K4me3+RPB2 peaks (n = 46). There are significant differences between groups (see text for P-values). (B) Scatterplot of T statistic (between TP0 and TP36) for the indicated groups of isolated SINEs (RPC4 peak only, n = 41; RPC4+H3K4me3 peaks, n = 11; RPC4 + RPB2 peaks, n = 14; RPC4 + H3K4me3 + RPB2 peaks, n = 38). There was no significant difference between various groups (RPC4 only versus RPC4+H3K4me3/RPB2, P-value = 0.2417; RPC4 versus RPC4 + H3K4me3 + RPB2, P-value = 0.1018; RPC4 + H3K4me3/RPB2 versus RPC4 + H3K4me3 + RPB2, P-value = 0.9975). (C) RPC4 T statistic for TP0 to TP36 transition across different chromosomes. Red dots, loci with significant changes, grey dots, loci with RPC4 scores below cutoff. (D) Comparison of RPC4 occupancy fold change distribution between tRNA genes in clusters and outside clusters on the same chromosome. Red bars indicate clusters with KS test P-value <0.05.

References

    1. James Faresse N., Canella D., Praz V., Michaud J., Romascano D., Hernandez N.. Genomic study of RNA polymerase II and III SNAPc-bound promoters reveals a gene transcribed by both enzymes and a broad use of common activators. PLos Genet. 2012; 8:e1003028. - PMC - PubMed
    1. Canella D., Bernasconi D., Gilardi F., LeMartelot G., Migliavacca E., Praz V., Cousin P., Delorenzi M., Hernandez N., Cycli X.C.. A multiplicity of factors contributes to selective RNA polymerase III occupancy of a subset of RNA polymerase III genes in mouse liver. Genome Res. 2012; 22:666–680. - PMC - PubMed
    1. Canella D., Praz V., Reina J.H., Cousin P., Hernandez N.. Defining the RNA polymerase III transcriptome: genome-wide localization of the RNA polymerase III transcription machinery in human cells. Genome Res. 2010; 20:710–721. - PMC - PubMed
    1. Orioli A., Praz V., Lhote P., Hernandez N.. Human MAF1 targets and represses active RNA polymerase III genes by preventing recruitment rather than inducing long-term transcriptional arrest. Genome Res. 2016; 26:624–635. - PMC - PubMed
    1. Van Bortle K., Phanstiel D.H., Snyder M.P.. Topological organization and dynamic regulation of human tRNA genes during macrophage differentiation. Genome Biol. 2017; 18:180. - PMC - PubMed

Publication types

MeSH terms