. 2019 Apr 1:189:1-18.
doi: 10.1016/j.neuroimage.2018.12.054. Epub 2018 Dec 28.

Task activations produce spurious but systematic inflation of task functional connectivity estimates

Affiliations

Task activations produce spurious but systematic inflation of task functional connectivity estimates

Michael W Cole et al. Neuroimage. .

Abstract

Most neuroscientific studies have focused on task-evoked activations (activity amplitudes at specific brain locations), providing limited insight into the functional relationships between separate brain locations. Task-state functional connectivity (FC) - statistical association between brain activity time series during task performance - moves beyond task-evoked activations by quantifying functional interactions during tasks. However, many task-state FC studies do not remove the first-order effect of task-evoked activations prior to estimating task-state FC. It has been argued that this results in the ambiguous inference "likely active or interacting during the task", rather than the intended inference "likely interacting during the task". Utilizing a neural mass computational model, we verified that task-evoked activations substantially and inappropriately inflate task-state FC estimates, especially in functional MRI (fMRI) data. Various methods attempting to address this problem have been developed, yet the efficacies of these approaches have not been systematically assessed. We found that most standard approaches for fitting and removing mean task-evoked activations were unable to correct these inflated correlations. In contrast, methods that flexibly fit mean task-evoked response shapes effectively corrected the inflated correlations without reducing effects of interest. Results with empirical fMRI data confirmed the model's predictions, revealing activation-induced task-state FC inflation for both Pearson correlation and psychophysiological interaction (PPI) approaches. These results demonstrate that removal of mean task-evoked activations using an approach that flexibly models task-evoked response shape is an important preprocessing step for valid estimation of task-state FC.

Keywords: Computational modeling; Functional connectivity; Method validation; Networks; fMRI.


Figures

Figure 1 –
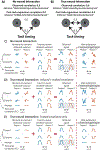
Figure 1 –. Illustration of the possibility that task-evoked activations are problematic for proper task-state FC inferences.
A) Graph depicting a scenario with no true neural interaction between A and B. A and B both increase their activity in response to task events, but they do not interact either directly or indirectly. The task event timing nonetheless acts as a confounder to create an artefactual correlation between the neural populations (‘original correlation’). Regressing out the mean task activation (the first-order effect of task) and estimating FC on the residuals (the second-order effect of task; ‘post-task-regression correlation’) removes this artifactual correlation. B) Even with a true positive, the task-evoked activity inflates the FC estimate relative to the ground truth interaction. C) An illustration (with artificial time series) of signal components underlying the “no true interaction” scenario. “Induced activity” is moment-to-moment variance in brain activity that is not time-locked to task timing. “Evoked activity” is event-to-event (e.g., block-to-block or trial-to-trial) variance in the brain activity that is time-locked to each task event onset. Note that evoked activity always varies in amplitude event-to-event in practice (due to the inherent noisiness of brain processes). Subtracting the mean evoked response from the timeseries before computing the correlation corrects for the inflation. D) An illustration of the “true interaction” scenario. E) A hypothetical example with only minimal induced variance, illustrating that “true” evoked covariance can drive corrected task-state FC results even after removing mean evoked responses. This illustrates that removing the mean evoked response does not remove all time-locked signals, but rather only those that are 100% consistent in amplitude with the mean across task events. While this could reduce effect sizes in theory, removing mean evoked responses is unlikely to remove evoked covariance of interest, given that neural processes are inherently variable across events.
Figure 2 –
Figure 2 –. Minimal model: fMRI task-state FC inflation is primarily driven by HRF convolution (temporal autocorrelation), and inflation is corrected by subtraction of mean evoked responses.
A) Two Gaussian random time series were generated to simulate spontaneous activity in two neural regions that are not “truly” interacting at the neural level. Their correlation is shown in the upper-left corner (as in all other panels). B) A “task” was simulated by adding activity in two task blocks. This increased the inter-region correlation substantially, indicating the critical role of rest-to-task state transitions in driving correlations. C) Simply isolating the task time points (removing the rest-to-task state transition) removed the correlation inflation. D) The identical time series in panel A convolved with a standard HRF to simulate the fMRI BOLD response. E) An HRF-convolved version of the time series in panel B. F) Unlike the “neural” time series, isolating task time points in the “fMRI” time series did not remove the correlation inflation. G) Removing the block start and stop transients reduced the correlation inflation, but it was still substantially inflated. H) The mean evoked response for each region. I) Subtracting the mean evoked response from each region completely removed the correlation inflation in the “fMRI” data.
Figure 3 –
Figure 3 –. The neural mass model, with fMRI simulation and “no connectivity zone” to test for false positives.
A) Three structural communities were constructed (100 nodes each), with the first community split into two communities via synaptic connectivity. The first and second structural communities had random connectivity (10% density), while the third community had no connections with the rest of the network. Connections to/from the third community acted as tests for false positives in subsequent simulations (the “no connectivity zone”). B) We simulated fMRI by convolving the input time series of each unit with a hemodynamic response function (HRF) and downsampling (every 785 ms). Spontaneous activity without task stimulation was used to produce this FC matrix. T-tests vs. 0 were based on across-subject variance, with each “subject” being a random initialization of the synaptic connectivity matrix and spontaneous activity. Note the low false positive rate (0.81%) (i.e. the lack of significant connections showing up in the ground truth “no connectivity zone”). C) Two populations of 25 nodes (indicated by yellow stars) were stimulated simultaneously across 6 task blocks. Two completely unconnected communities were stimulated to test for false positives. Note the increase in false positive connections in the “no connectivity zone” (41%). D) T-tests indicated an inflated false positive rate of 40% when comparing task FC to rest FC. Note that without fMRI simulation (i.e., no HRF or downsampling) the false positive rate was 1.99%.
Figure 4 –
Figure 4 –. Testing task-timing regression approaches to reduce false positive rate.
While some researchers investigating task FC fMRI ignore this problem, there are several standard approaches for attempting to reduce potential false positives. Critically, the 300-node computational model can provide a ground-truth scenario for testing the validity of these approaches. Note that all approaches are designed to leave moment-to-moment (and event-to-event) task-related variance in the time series, but to remove cross-event responses related to the task’s timing. Task vs. rest Pearson correlation differences (t-test p<0.01 thresholded) are shown. A) The 4 tested approaches are illustrated. The canonical HRF shape is what is typically used to reduce false positives in the literature, as with PPI. To assess whether the HRF shape mattered a “wrong” HRF was also used. The finite impulse response (FIR) and constrained basis set approaches are flexible, allowing them to fit the actual HRF shape. B) The canonical HRF shape task regression. There was a reduction from the no-regression condition (42.58%) but the remaining high false positive rate (20.34%) demonstrates that task regression with the canonical HRF is helpful but fails to correct the problem. Results were highly similar for the “flipped” HRF shape version (not shown). C) Task regression with the FIR approach eliminates the problem, with the false positive rate just below the expected detection rate of 1% (given our p<0.01 threshold). D) Task regression with a basis set of 5 regressors (accounting for 99.5% of the variance among 1000 plausible HRF shapes) was also successful in reducing the false positive rate (1.05%). E) False positive rates across six variants of the analyses. Since results were thresholded at p<0.01, any values above 1% can be considered false positives. F) False negative rates across five variants, with the pre-fMRI/neural variant treated as the “ground truth”. The entire 300 × 300 connectivity matrix was included in this analysis (rather than just the no connectivity zone). The fMRI simulation resulted in false negatives due to temporal smearing and downsampling, yet task regression reduced these false negatives.
Figure 5 –
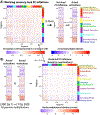
Figure 5 –. Analysis of empirical fMRI data reveals likely false positive rates for task-state FC estimates (with resting-state FC as a control for spontaneous correlations).
A) The regions used for data analysis, as defined by Glasser et al. (2016). Colors reflect functional network assignments used for FC matrix visualization (Spronk et al., 2017) in subsequent figures. These assignments were used solely for visualization – results were not affected by the chosen network assignments. Colors match the network labels in Figure 6. B) The cross-7-task average rate of significant task-state FC increases from resting-state FC are shown (using Pearson correlation, FDR corrected for multiple comparisons, p<0.05). To the extent that the FIR approach eliminates false positives (demonstrated in the neural mass model), the percentages suggest a false positive rate of 65.5% without task-regression preprocessing, 49.2% with canonical HRF and 17.3% with constrained basis set model approaches. There were 2.9 times more significant FC increases without task regression compared to when FIR task regression was used. Note that resting-state FC is used here simply as a baseline (to control for FC driven by spontaneous activity) rather than as the ground truth FC.
Figure 6 –
Figure 6 –. Estimated FC inflation for each of the 7 tasks.
Task-evoked activation-based FC inflation was estimated by contrasting no-regression from FIR-regressed task FC estimates. Only statistically significant (p<0.05, FDR corrected) differences are shown for each task. Each FC matrix is shown with the name of each task and the percentage of connections (of the entire 360 × 360 FC matrix) that were significantly different between the no-regression and the FIR-regressed task FC estimates. Note that all tasks involved visual stimuli except for the language task.
Figure 7 –
Figure 7 –. Task-to-task FC comparison: 2-back vs. 0-back (N-back working memory task).
A) 2-back vs. 0-back FC differences, with no task regression preprocessing (p<0.05, FDR corrected for multiple comparisons). B) Identical to panel A, but with constrained basis set task regression preprocessing. C) Identical to panel A, but with canonical HRF task regression preprocessing. Note the visual similarity to the no-task-regression results. D) Identical to panel A, but with FIR task regression preprocessing.
Figure 8 –
Figure 8 –. Visualizing the relationship between task co-activation and task FC inflation.
A) Task-state FC inflation is shown (left) by subtracting the group-mean FIR-regressed task FC matrix from the group-mean non-regressed task FC matrix. An example task – the HCP “Working memory” task (which involves visual stimuli and button pressing) – is used for illustration (with no thresholding). The FC inflation values were summed (after taking the absolute value) by region to summarize the degree to which each region showed FC inflation. This was then compared with the task-evoked activation pattern (estimated using a standard GLM with a canonical HRF shape), showing a significant correspondence (Spearman rank rho=0.49, p<0.0001). This provides a way to visualize the degree to which co-activation patterns are likely influencing task FC patterns. B) The group-mean task activation pattern was used to predict likely inflation of task-state FC estimates driven by co-activations. This involved multiplying each activation with all others in a pairwise manner, converting the activation vector into a co-activation matrix. There was a significant similarity between the co-activation matrix and the task-state FC inflation (Spearman rank rho = 0.60, p<0.0001). This shows an alternative way to visualize the degree to which co-activation patterns are likely influencing task FC patterns.

Similar articles

Cited by

References

    1. Al-Aidroos N, Said CP, Turk-Browne NB, 2012. Top-down attention switches coupling between low-level and high-level areas of human visual cortex. Proceedings of the National Academy of Sciences 109, 14675–14680. doi:10.1073/pnas.1202095109 - DOI - PMC - PubMed
    1. Averbeck BB, Latham PE, Pouget A, 2006. Neural correlations, population coding and computation. Nat Rev Neurosci 7, 358–366. doi:10.1038/nrn1888 - DOI - PubMed
    1. Barch DM, Burgess GC, Harms MP, Petersen SE, Schlaggar BL, Corbetta M, Glasser MF, Curtiss S, Dixit S, Feldt C, Nolan D, Bryant E, Hartley T, Footer O, Bjork JM, Poldrack R, Smith S, Johansen-Berg H, Snyder AZ, Van Essen DC, Consortium, F.T.W.-M.H., 2013. Function in the human connectome: Task-fMRI and individual differences in behavior. NeuroImage 80, 169–189. doi:10.1016/j.neuroimage.2013.05.033 - DOI - PMC - PubMed
    1. Barral J, D Reyes A, 2016. Synaptic scaling rule preserves excitatory-inhibitory balance and salient neuronal network dynamics. Nat Neurosci. doi:10.1038/nn.4415 - DOI - PubMed
    1. Behzadi Y, Restom K, Liau J, Liu TT, 2007. A component based noise correction method (CompCor) for BOLD and perfusion based fMRI. NeuroImage 37, 90–101. doi:10.1016/j.neuroimage.2007.04.042 - DOI - PMC - PubMed

Publication types