. 2018 Dec 31;19(Suppl 10):914.
doi: 10.1186/s12864-018-5278-5.

Revealing transcription factor and histone modification co-localization and dynamics across cell lines by integrating ChIP-seq and RNA-seq data

Affiliations

Revealing transcription factor and histone modification co-localization and dynamics across cell lines by integrating ChIP-seq and RNA-seq data

Lirong Zhang et al. BMC Genomics. .

Abstract

Background: Interactions among transcription factors (TFs) and histone modifications (HMs) play an important role in the precise regulation of gene expression. The context specificity of those interactions and further its dynamics in normal and disease remains largely unknown. Recent development in genomics technology enables transcription profiling by RNA-seq and protein's binding profiling by ChIP-seq. Integrative analysis of the two types of data allows us to investigate TFs and HMs interactions both from the genome co-localization and downstream target gene expression.

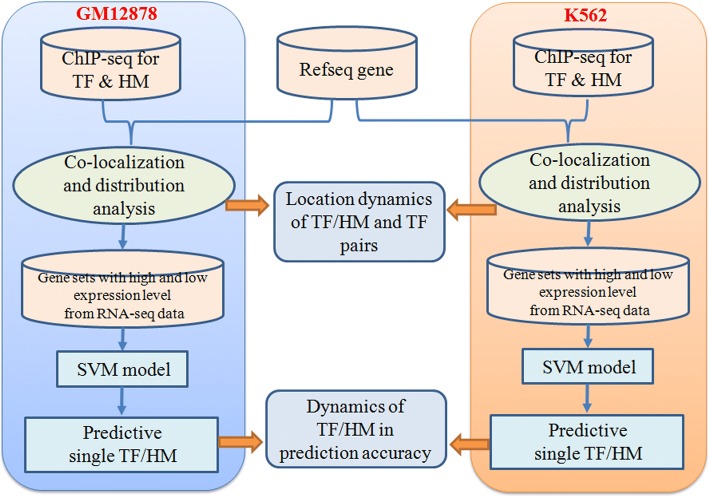
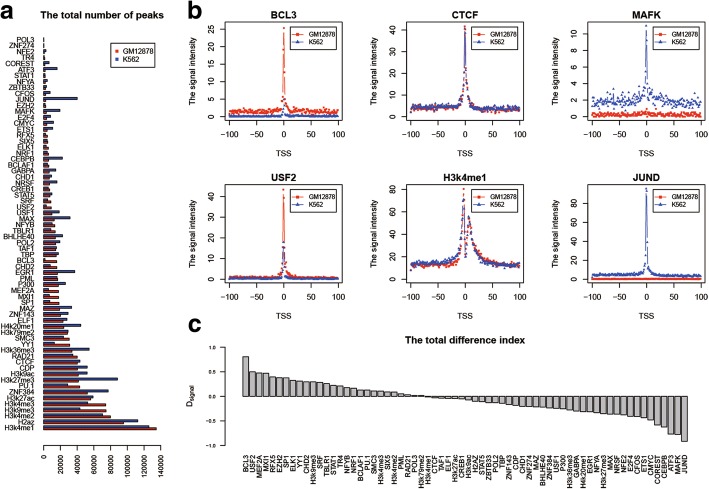
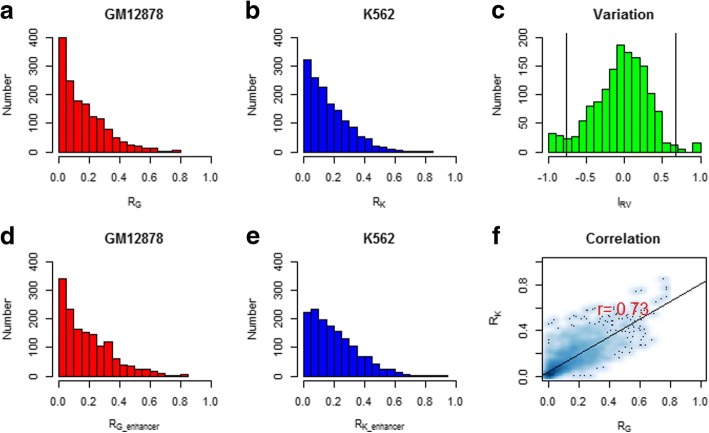
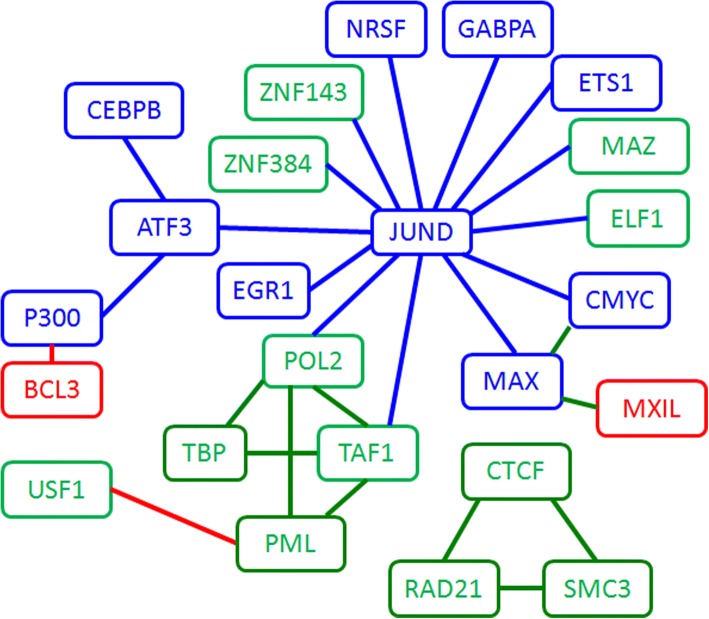
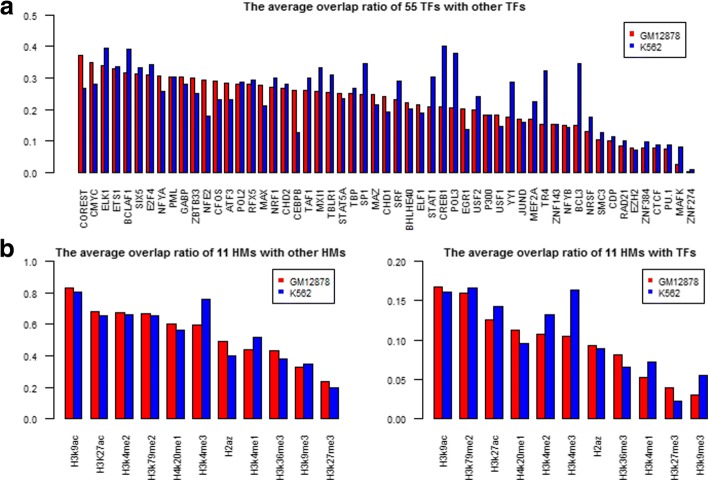
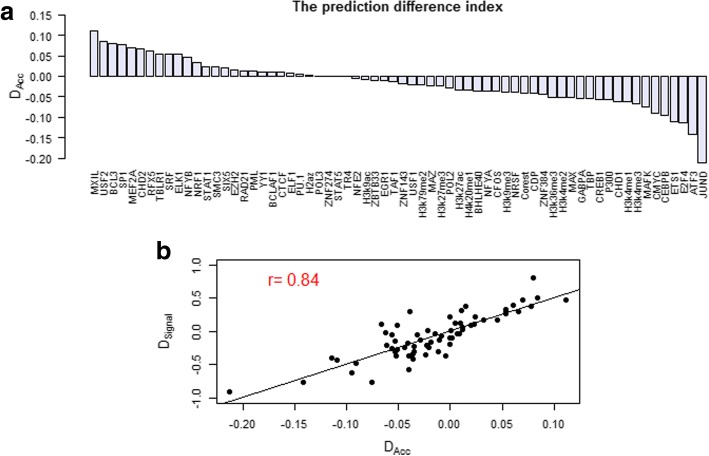
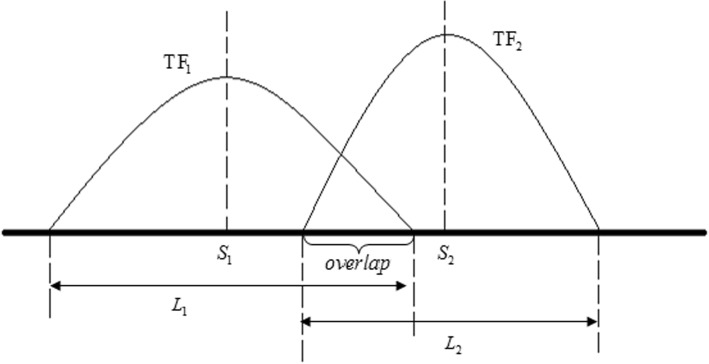
Results: We propose a integrative pipeline to explore the co-localization of 55 TFs and 11 HMs and its dynamics in human GM12878 and K562 by matched ChIP-seq and RNA-seq data from ENCODE. We classify TFs and HMs into three types based on their binding enrichment around transcription start site (TSS). Then a set of statistical indexes are proposed to characterize the TF-TF and TF-HM co-localizations. We found that Rad21, SMC3, and CTCF co-localized across five cell lines. High resolution Hi-C data in GM12878 shows that they associate most of the Hi-C peak loci with a specific CTCF-motif "anchor" and supports that CTCF, SMC3, and RAD2 co-localization serves important role in 3D chromatin structure. Meanwhile, 17 TF-TF pairs are highly dynamic between GM12878 and K562. We then build SVM models to correlate high and low expression level of target genes with TF binding and HM strength. We found that H3k9ac, H3k27ac, and three TFs (ELF1, TAF1, and POL2) are predictive with the accuracy about 85~92%.

Conclusion: We propose a pipeline to analyze the co-localization of TF and HM and their dynamics across cell lines from ChIP-seq, and investigate their regulatory potency by RNA-seq. The integrative analysis of two level data reveals new insight for the cooperation of TFs and HMs and is helpful in understanding cell line specificity of TF/HM interactions.

Keywords: Co-localization; Dynamics; Histone modification; Transcription factor.


Conflict of interest statement

Ethics approval and consent to participate

Not applicable.

Consent for publication

Not applicable.

Competing interests

The authors declare that they have no competing interests.

Publisher’s Note

Springer Nature remains neutral with regard to jurisdictional claims in published maps and institutional affiliations.

Figures

Fig. 1
Fig. 1
The two-step integrative pipeline to analyze matched ChIP-seq and RNA-seq data
Fig. 2
Fig. 2
The dynamics of TF and HM localization between GM12878 and K562. a The peak numbers of 55 TFs and 11 HMs in two cell lines. The X-axis is the number of peaks, and the Y-axis represents the name of TF/HM. b The signal intensity of six factors in a 40 kb DNA region which was separated into 200 bins flanking TSS in two cell lines. Each bin is 200 bp in size. The X-axis is the relative position of bins, and the Y-axis is the signal intensity of a given TF/HM. c The total difference index of 55 TFs and 11 HMs between GM12878 and K562. The X-axis represents the name of TF/HM, and the Y-axis is the total difference index
Fig. 3
Fig. 3
The overlap analysis of TF pairs in GM12878 and K562. The distribution of the overlap ratio for 1485 TF pairs in GM12878 ((a) for genome-wide and (d) for enhancer region) and K562 ((b) for genome-wide and (e) for enhancer region). The X-axis is the value of the overlap ratio, and the Y-axis is the number of TF pairs. c The distribution of the relative variation index IRV. The X-axis is the value of the relative variation index, and the Y-axis is the number of TF pairs. The left and right lines located the position with μ ± 2σ. And μ is the mean and σ is the standard deviation of the relative variation index IRV. f The scatter plot and the Pearson correlation coefficient of the overlap ratio for 1485 TF pairs between two cell lines. The X-axis and Y-axis are the overlap ratios of TF pairs in GM12878 and K562 respectively. Here RG and RK indicate the overlap ratios of TF pairs in GM12878 and K562 respectively
Fig. 4
Fig. 4
The interaction network among TFs. The node color labels the TF type (Red: GM12878_rich_factor; Blue: K562_rich_factor; Green: unbiased_factor) and the edge color indicate the specificity of TF pairs in different cell lines (Red: GM12878_specificity_TF pairs; blue: K562_specificity_TF pairs; Green: unbiased_TF pairs)
Fig. 5
Fig. 5
The average overlap ratio of TFs and HMs. a The average overlap ratio of 55 TFs in two cell lines. b The average overlap ratio of 11 HMs with other HMs (left) or 55 TFs (right). The X-axis represents the name of TFs/HMs, and The Y-axis represents the average overlap ratio
Fig. 6
Fig. 6
The prediction difference index for TFs/HMs. a The rank list of the prediction difference index DAcc for 66 factors. The X-axis represents the name of TF/HM, and the Y-axis represents the prediction difference index. b The correlation properties between the prediction difference index DAcc and the total difference index Dsignal. The X-axis is the prediction difference index, and the Y-axis is the total difference index
Fig. 7
Fig. 7
The schematic diagram of the overlap state between TF1 and TF2. There are two peaks from TF1 and TF2 respectively. L1 and L2 are the peak widths, and S1 and S2 are the peak centres of TF1 and TF2 respectively

Similar articles

Cited by

References

    1. Hu ZH, Gallo SM. Identification of interacting transcription factors regulating tissue gene expression in human. BMC Genomics. 2010;11:49. doi: 10.1186/1471-2164-11-49. - DOI - PMC - PubMed
    1. Veerla S, Ringner M, Hoglund M. Genome-wide transcription factor binding site/promoter databases for the analysis of gene sets and co-occurrence of transcription factor binding motifs. BMC Genomics. 2010;11:145. doi: 10.1186/1471-2164-11-145. - DOI - PMC - PubMed
    1. Costa IG, Roider HG, do Rego TG, de Carvalho Fde A. Predicting gene expression in T cell differentiation from histone modifications and transcription factor binding affinities by linear mixture models. BMC Bioinformatics. 2011;12(Suppl 1):S29. doi: 10.1186/1471-2105-12-S1-S29. - DOI - PMC - PubMed
    1. Gong W, Koyano-Nakagawa N, Li T, Garry DJ. Inferring dynamic gene regulatory networks in cardiac differentiation through the integration of multi-dimensional data. BMC Bioinformatics. 2015;16:74. doi: 10.1186/s12859-015-0460-0. - DOI - PMC - PubMed
    1. Farnham PJ. Insights from genomic profiling of transcription factors. Nat Rev Genet. 2009;10(9):605–616. doi: 10.1038/nrg2636. - DOI - PMC - PubMed

Substances

LinkOut - more resources