

Human-Disease Phenotype Map Derived from PheWAS across 38,682 Individuals
- PMID: 30598166
- PMCID: PMC6323551
- DOI: 10.1016/j.ajhg.2018.11.006
Human-Disease Phenotype Map Derived from PheWAS across 38,682 Individuals
Abstract
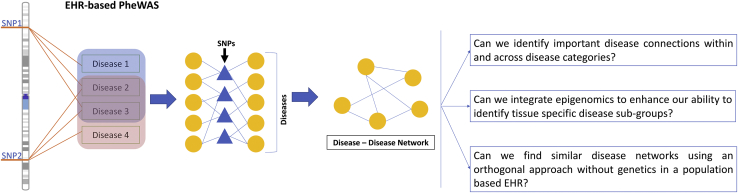
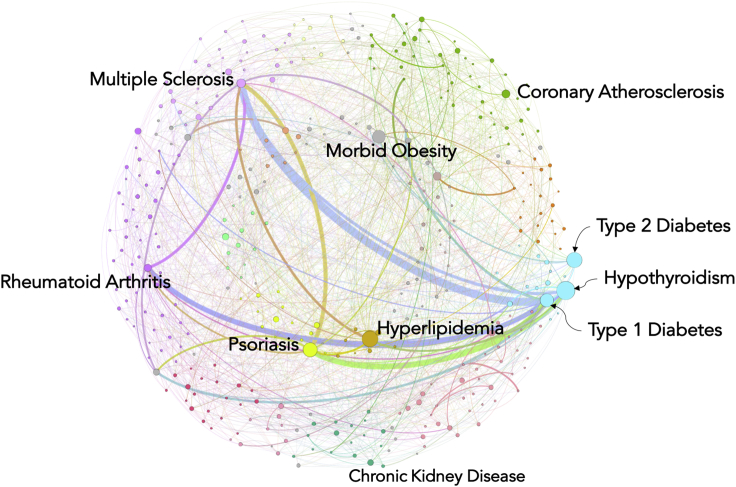
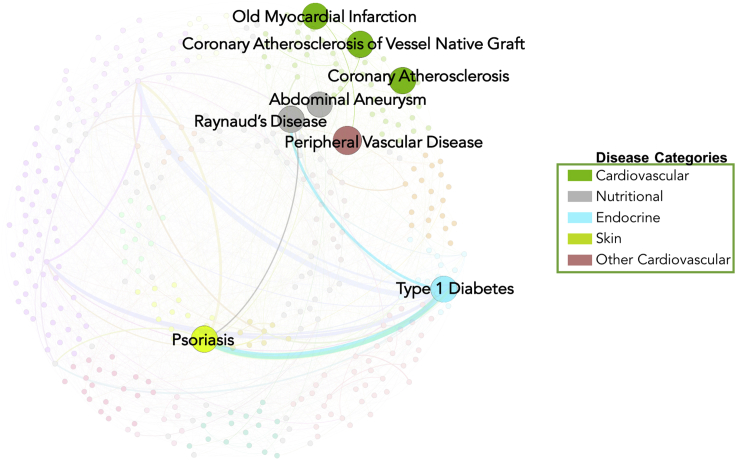
Phenome-wide association studies (PheWASs) have been a useful tool for testing associations between genetic variations and multiple complex traits or diagnoses. Linking PheWAS-based associations between phenotypes and a variant or a genomic region into a network provides a new way to investigate cross-phenotype associations, and it might broaden the understanding of genetic architecture that exists between diagnoses, genes, and pleiotropy. We created a network of associations from one of the largest PheWASs on electronic health record (EHR)-derived phenotypes across 38,682 unrelated samples from the Geisinger's biobank; the samples were genotyped through the DiscovEHR project. We computed associations between 632,574 common variants and 541 diagnosis codes. Using these associations, we constructed a "disease-disease" network (DDN) wherein pairs of diseases were connected on the basis of shared associations with a given genetic variant. The DDN provides a landscape of intra-connections within the same disease classes, as well as inter-connections across disease classes. We identified clusters of diseases with known biological connections, such as autoimmune disorders (type 1 diabetes, rheumatoid arthritis, and multiple sclerosis) and cardiovascular disorders. Previously unreported relationships between multiple diseases were identified on the basis of genetic associations as well. The network approach applied in this study can be used to uncover interactions between diseases as a result of their shared, potentially pleiotropic SNPs. Additionally, this approach might advance clinical research and even clinical practice by accelerating our understanding of disease mechanisms on the basis of similar underlying genetic associations.
Keywords: DiscovEHR study; EHR-based population study; PheWAS; electronic health record; human disease network.
Copyright © 2018 The Author(s). Published by Elsevier Inc. All rights reserved.
Figures
References
-
- Tyler A.L., Crawford D.C., Pendergrass S.A. The detection and characterization of pleiotropy: Discovery, progress, and promise. Brief. Bioinform. 2016;17:13–22. - PubMed
-
- Cronin R.M., Field J.R., Bradford Y., Shaffer C.M., Carroll R.J., Mosley J.D., Bastarache L., Edwards T.L., Hebbring S.J., Lin S. Phenome-wide association studies demonstrating pleiotropy of genetic variants within FTO with and without adjustment for body mass index. Front. Genet. 2014;5:250. - PMC - PubMed
-
- Hall M.A., Verma A., Brown-Gentry K.D., Goodloe R., Boston J., Wilson S., McClellan B., Sutcliffe C., Dilks H.H., Gillani N.B. Detection of pleiotropy through a phenome-wide association study (PheWAS) of epidemiologic data as part of the Environmental Architecture for Genes Linked to Environment (EAGLE) study. PLoS Genet. 2014;10:e1004678. - PMC - PubMed
Publication types
MeSH terms
Grants and funding
LinkOut - more resources
Full Text Sources
