. 2019 Feb 7;73(3):413-428.e7.
doi: 10.1016/j.molcel.2018.11.010. Epub 2018 Dec 28.

RIPK1 and Caspase-8 Ensure Chromosome Stability Independently of Their Role in Cell Death and Inflammation

Affiliations

RIPK1 and Caspase-8 Ensure Chromosome Stability Independently of Their Role in Cell Death and Inflammation

Gianmaria Liccardi et al. Mol Cell. .

Abstract

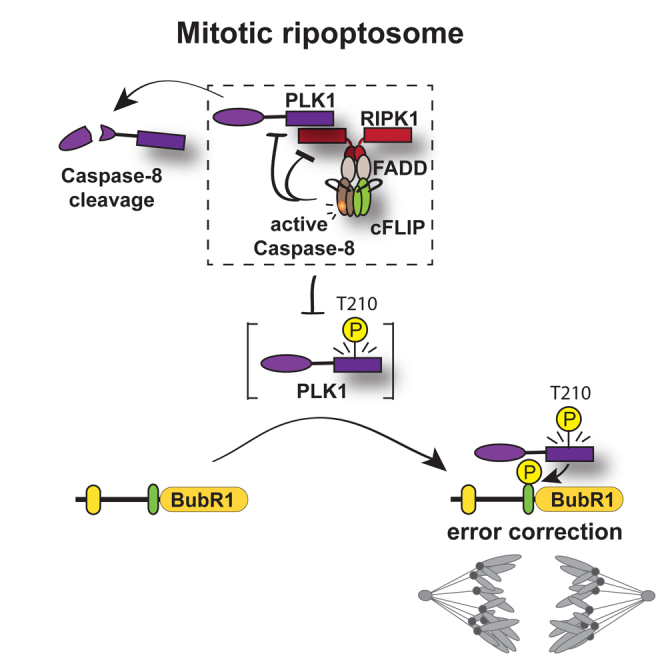
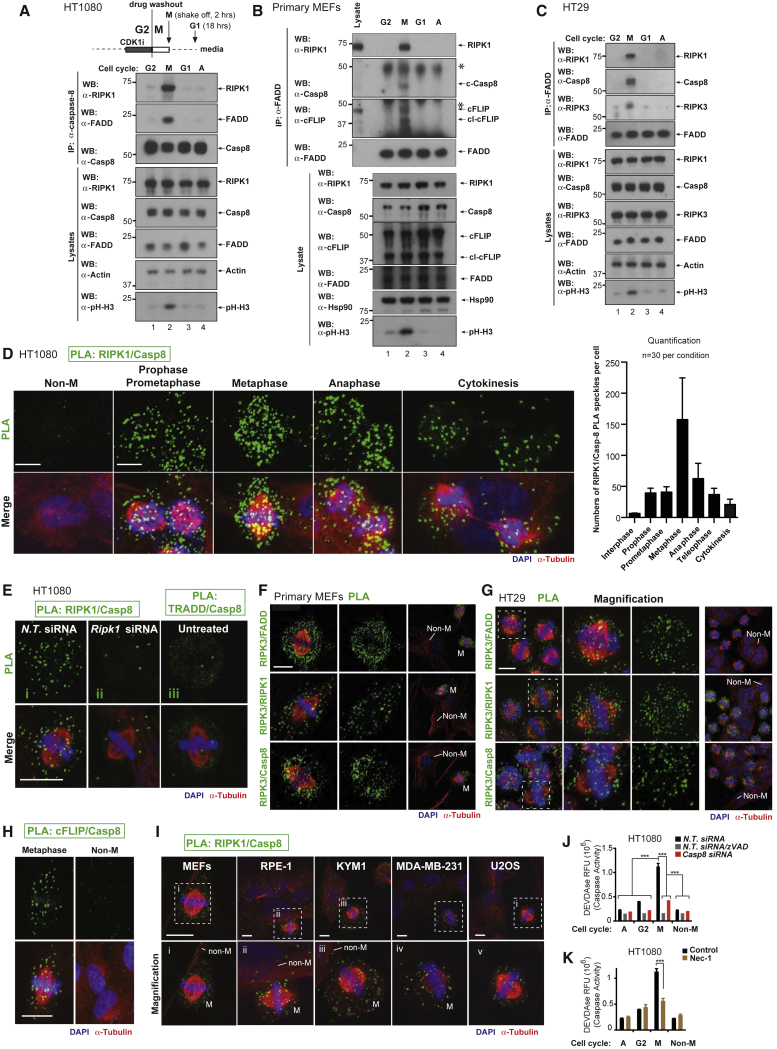
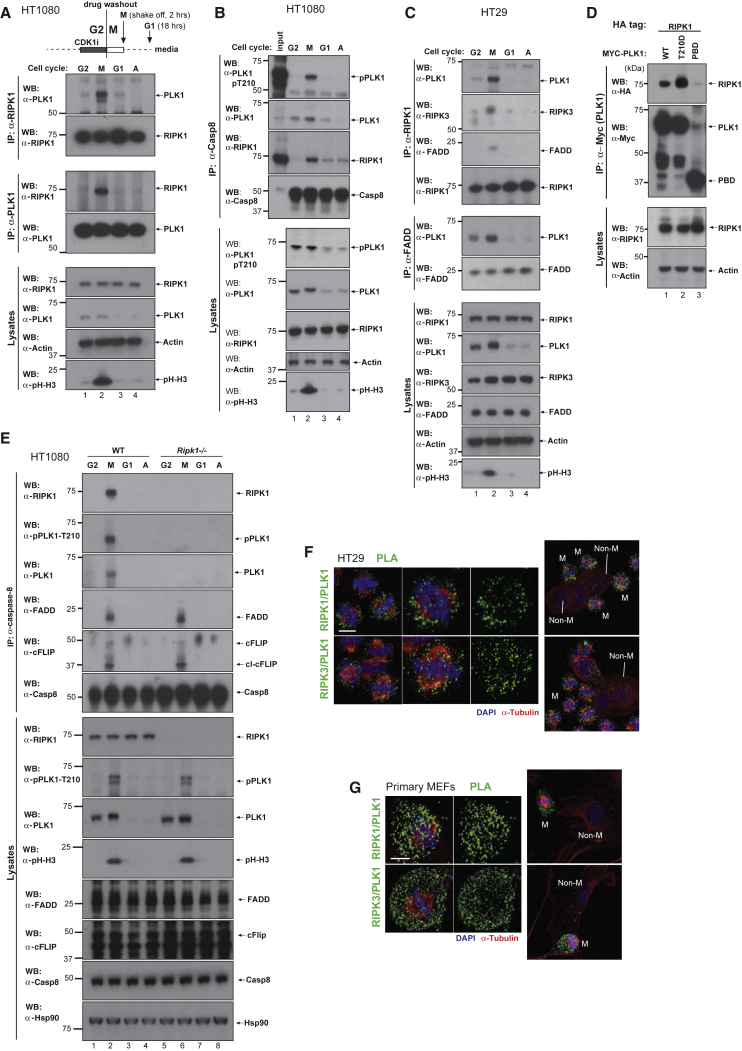
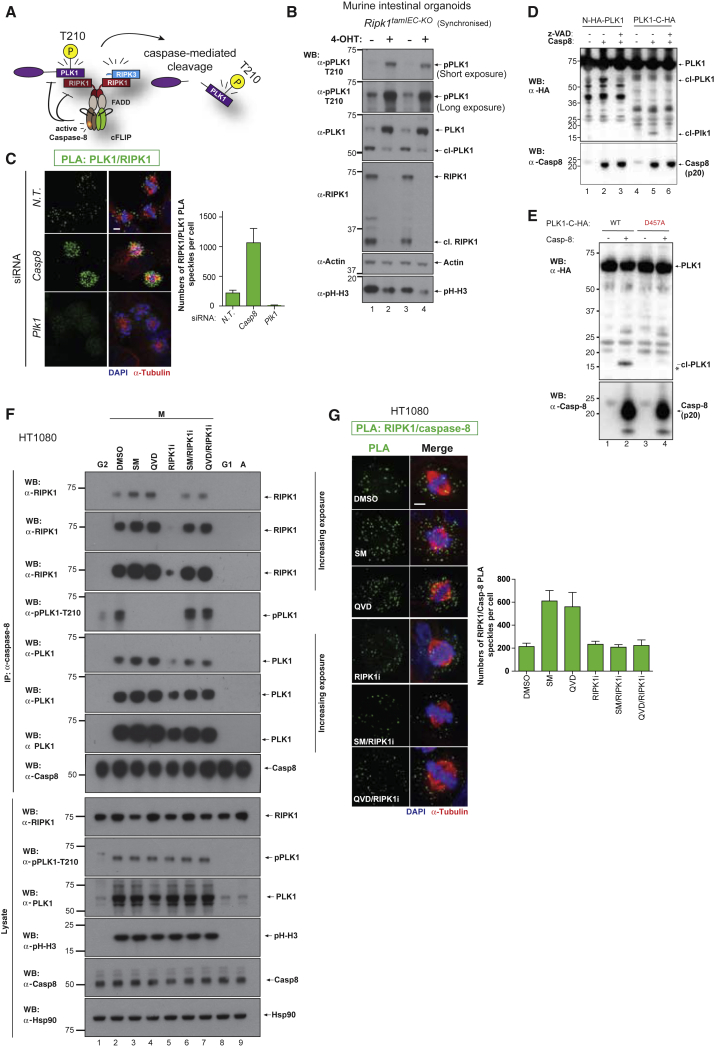
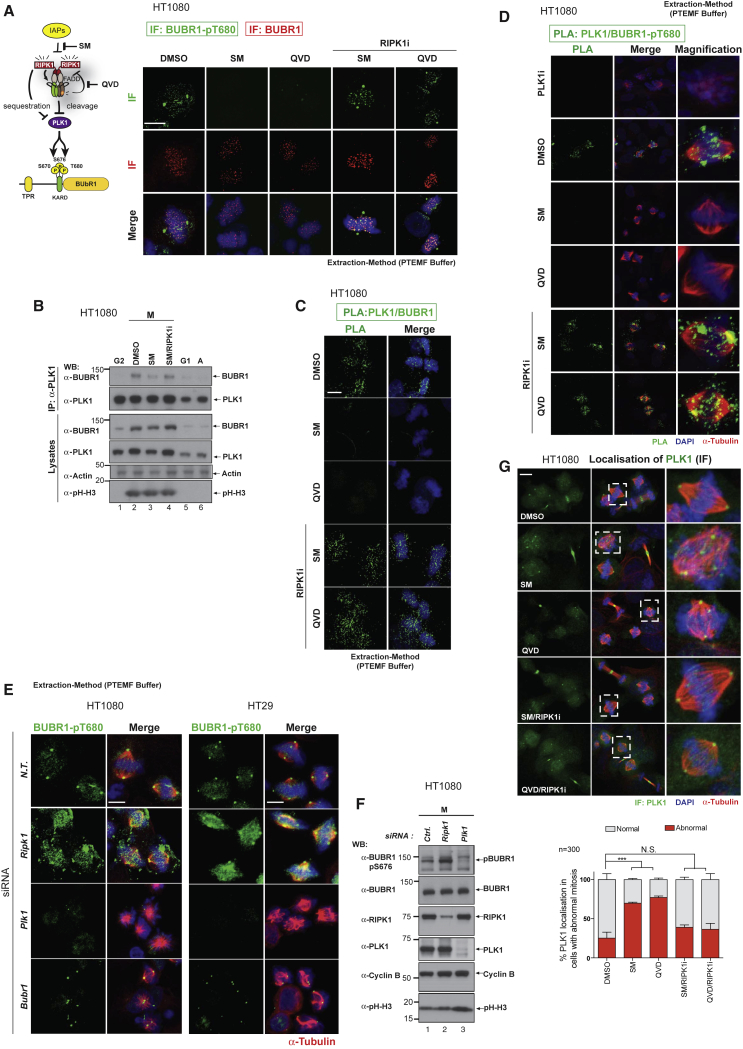
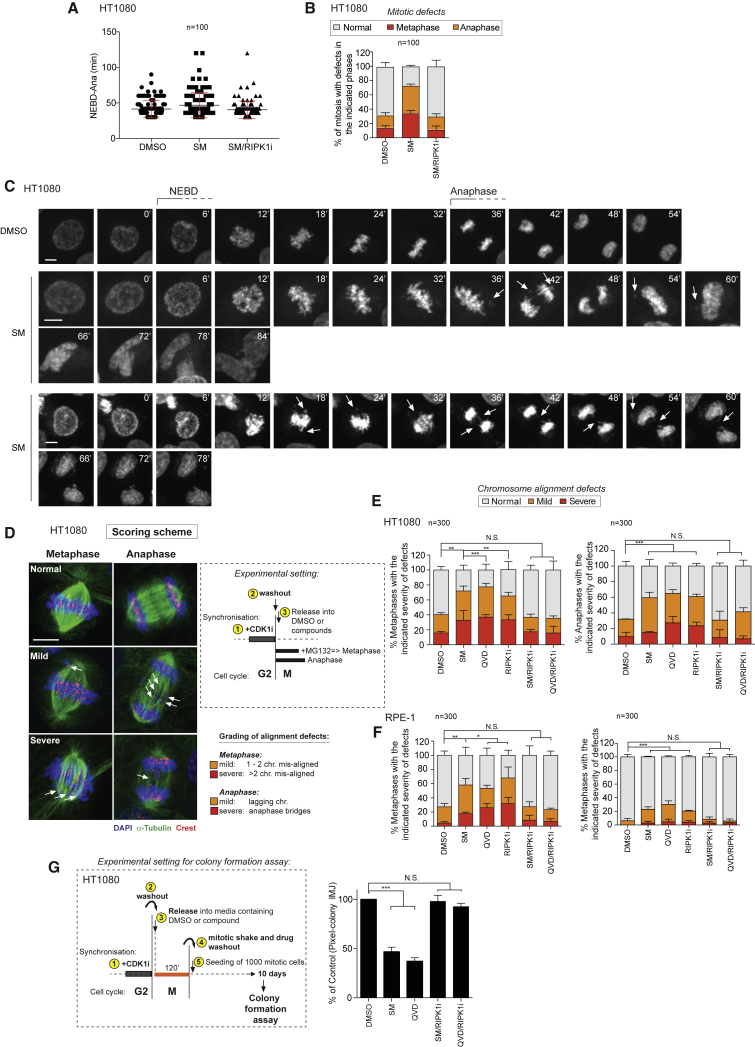
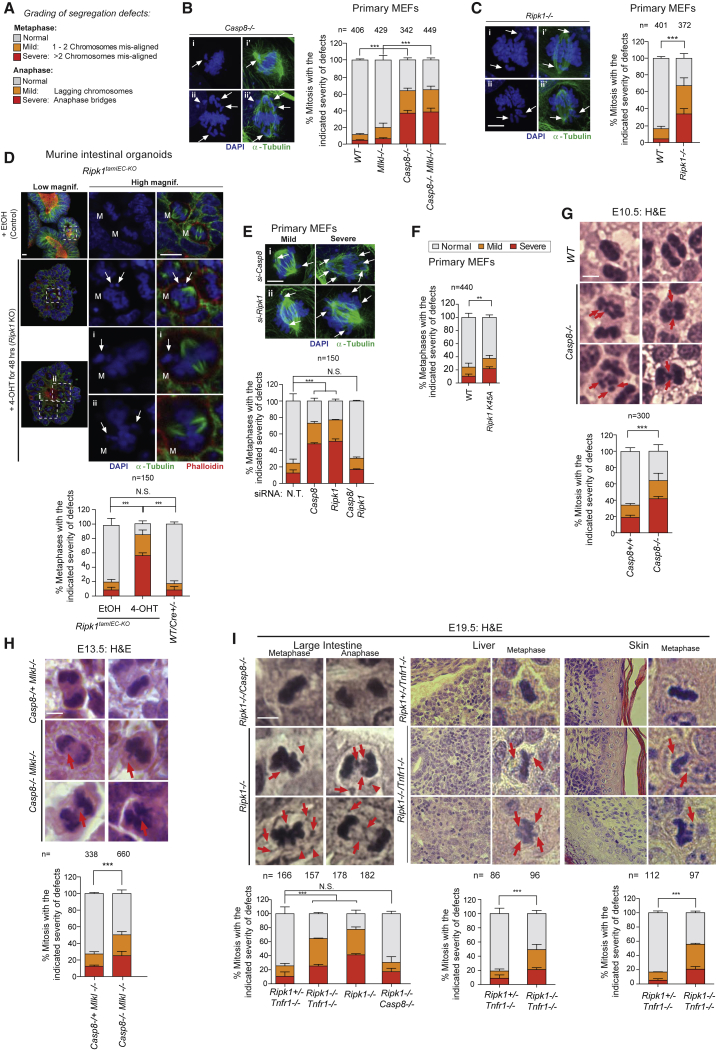
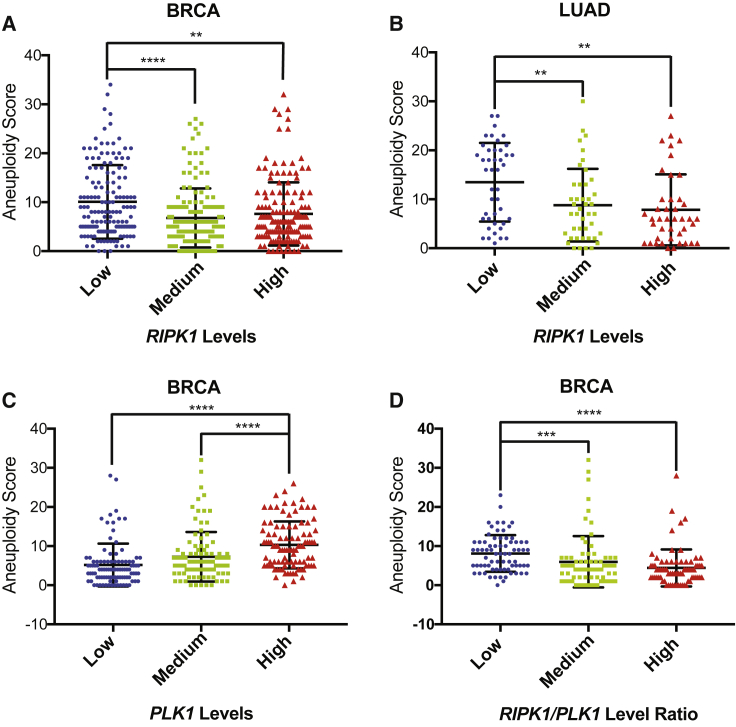
Receptor-interacting protein kinase (RIPK) 1 functions as a key mediator of tissue homeostasis via formation of Caspase-8 activating ripoptosome complexes, positively and negatively regulating apoptosis, necroptosis, and inflammation. Here, we report an unanticipated cell-death- and inflammation-independent function of RIPK1 and Caspase-8, promoting faithful chromosome alignment in mitosis and thereby ensuring genome stability. We find that ripoptosome complexes progressively form as cells enter mitosis, peaking at metaphase and disassembling as cells exit mitosis. Genetic deletion and mitosis-specific inhibition of Ripk1 or Caspase-8 results in chromosome alignment defects independently of MLKL. We found that Polo-like kinase 1 (PLK1) is recruited into mitotic ripoptosomes, where PLK1's activity is controlled via RIPK1-dependent recruitment and Caspase-8-mediated cleavage. A fine balance of ripoptosome assembly is required as deregulated ripoptosome activity modulates PLK1-dependent phosphorylation of downstream effectors, such as BUBR1. Our data suggest that ripoptosome-mediated regulation of PLK1 contributes to faithful chromosome segregation during mitosis.

Keywords: BUBR1; PLK1; RIPK1; cancer; caspase-8; cell cycle; cell death; chromosomal instability; mitosis; ripoptosome.


Figures

None
Graphical abstract
Figure 1
Figure 1
The Ripoptosome Forms During Normal Mitosis (A–C) Human HT1080 (A), MEFs (B), and HT29 (C) cells were synchronized, and lysates from asynchronous or synchronized cells were immunoprecipitated with anti-Casp8 (HT1080) or anti-FADD (MEFs, HT29) antibodies. Immunoblot analysis using the indicated antibodies is shown. The synchronization scheme and collection points are indicated above. (D) In situ PLA detection of RIPK1 and Casp8 in HT1080 cells. Green dots indicate PLA signals of RIPK1/Casp8 complexes. The panel on the right shows quantifications of RIPK1/Casp8 PLA speckles (mean ± SD from three independent experiments). In each experiment, 10 cells were counted for each mitotic stage. Scale bars: 10 μm. (E–G) In situ PLA detection using antibodies against the indicated proteins. Green dots indicate proximity signals of RIPK1/Casp8 or TRADD/Casp8 in HT1080 (E), RIPK3/FADD, RIPK3/RIPK1, or RIPK3/Casp8 in MEFs (F) or HT29 (G). Scale bars: 10 μm. (H) In situ PLA detection of cFLIP and Casp8 in HT1080 cells. Green dots indicate proximity signals between cFLIP and Casp8. Scale bars: 10 μm. (I) In situ PLA detection of RIPK1 and Casp8 in the indicated cell lines. Green dots indicate PLA signals of RIPK1/Casp8 complexes. Scale bars: 10 μm. (J and K) DEVDase caspase activity analysis using CDK1i-synchronized and released HT1080 cells treated with the indicated conditions.
Figure 2
Figure 2
RIPK1 Interacts with PLK1 (A) HT1080 cells were synchronized with CDK1i and released. Lysates from asynchronous or synchronized HT1080 cells were immunoprecipitated with anti-RIPK1 or anti-PLK1 antibodies. Immunoblot analysis using the indicated antibodies is shown. (B) HT1080 cells were synchronized with CDK1i and released. Lysates from asynchronous or synchronized HT1080 cells were immunoprecipitated with anti-Casp8 antibody. Immunoblot analysis using the indicated antibodies is shown. (C) Lysates from synchronized and released HT29 cells were immunoprecipitated with anti-RIPK1 or anti-FADD antibodies. Immunoblot analysis using the indicated antibodies is shown. (D) The indicated constructs were co-expressed in HEK293T cells. Myc-immunoprecipitation was performed and RIPK1 interaction was assessed via western blot. (E) HT1080 cells were synchronized with CDK1i and released. Lysates from asynchronous or synchronized HT1080 cells were immunoprecipitated with anti-Casp8 antibody. Immunoblot analysis using the indicated antibodies is shown. (F) In situ PLA detection of PLK1/RIPK1 or PLK1/RIPK3 in CDK1i-synchronized and released HT29. Green dots indicate PLA speckles. Scale bars: 10 μm (G) In situ PLA detection of PLK1/RIPK1 or PLK1/RIPK3 in CDK1i-synchronized and released MEFs. Green dots indicate PLA speckles. Scale bars: 10 μm
Figure 3
Figure 3
RIPK1 Negatively Regulates PLK1 (A) Schematic representation of RIPK1- and Casp8-mediated regulation of PLK1. (B) Immunoblots of primary intestinal organoids from two Ripk1fl/fl,IEC-creERTM animals. Organoids were treated with ETOH (vehicle control) or 4-OHT, synchronized with CDK1i, and released into media. Cells were lysed and analyzed by immunoblotting with the indicated antibodies. (C) In situ PLA detection of PLK1 and RIPK1 in HT1080 cells, following Casp8 or Plk1 siRNA. Green dots indicate PLA signals between PLK1 and RIPK1. Graph shows quantifications of RIPK1/PLK1 PLA speckles (mean ± SD). 15 cells were counted for each condition. Scale bars: 10 μm. (D and E) In vitro cleavage assay. Purified HA-tagged PLK1 construct and recombinant Casp8 were incubated for 1 h. Immunoblots analysis using the indicated antibodies is shown. (F) HT1080 cells were synchronized with CDK1i and released in media containing the indicated drugs. Lysates from asynchronous or synchronized HT1080 cells were immunoprecipitated with anti-Casp8 antibody. Immunoblot analysis using the indicated antibodies is shown. (G) In situ PLA detection of Casp8/RIPK1 in CDK1i-synchronized and released HT1080 cells treated with the indicated agents. Green dots indicate PLA speckles. Scale bars: 10 μm.
Figure 4
Figure 4
RIPK1 Negatively Regulates PLK1-Mediated Phosphorylation of BUBR1 (A) Scheme illustrating how mitotic ripoptosome interacts and modulates PLK1 and how pharmacological inhibition regulates such interaction and downstream substrate activation. Immunofluorescence analysis using anti-BUBR1 or anti-BUBR1-pT680 antibodies. HT1080 cells were synchronized with CDK1i and released into media containing the indicated agents. Scale bars: 10 μm. (B) HT1080 cells were synchronized with CDK1i and released. Lysates from asynchronous or synchronized HT1080 cells were immunoprecipitated with anti-PLK1 antibody. Immunoblot analysis using the indicated antibodies is shown. (C and D) In situ PLA detection of PLK1/BUBR1 (C) or PLK1/BUBR1-pT680 (D) in synchronized HT1080 cells, treated with the indicated agents. Scale bars: 10 μm. (E) Immunofluorescence analysis using anti-BUBR1-pT680 antibodies (under extraction conditions) in CDK1i-synchronized HT1080 (left) and HT29 (right) cells under the indicated RNAi conditions. Cells were released for 30 min, after which MG132 was added for 90 min to arrest cells in metaphase. N.T. indicates non-targeting RNAi Control oligos. Scale bars: 10 μm. (F) Western blot analysis of phosphorylated BUBR1 following knockdown of Control (Ctrl), Ripk1, or Plk1 in CDK1i-synchronized and released HT1080 cells. (G) CDK1i-synchronized HT1080 cells were released into media containing the indicated agents. Cells were released for 30 min, after which MG132 was added for 90 min to arrest cells in metaphase. Only cells presenting mitotic abnormalities were scored for PLK1 localization. Images show representative examples of PLK1 mis-localization. Scale bars: 10 μm.
Figure 5
Figure 5
Hyper-Activation of RIPK1 Induces Chromosome Mis-Alignment (A) Asynchronized HT1080 cells were pre-incubated for 2 hr with 10 nM SIR-DNA and then treated with the indicated compounds. Mitotic duration of HT1080 assessed by quantifying the time elapsed between nuclear envelope breakdown (NEBD) and anaphase onset following treatment with the indicated agents. (B) Mitotic abnormalities detected in cells imaged by advanced spinning disc confocal microscopy time lapse to determine mitotic timing. Graphs show the percentage of mitotic abnormalities recorded in 100 mitosis per condition. (C) Example of mitotic cells visualized during advance spinning confocal time lapse. Frames were acquired every 6 min. (D) Scheme depicting experimental procedure for synchronization and release of cells during mitosis in indicated drugs. Examples of chromosome alignment defects to illustrate the scoring system. Scale bars: 10 μm. (E and F) CDK1i-synchronized HT1080 (E) and RPE-1 (F) cells were released into media containing the indicated agents. For the analysis in metaphases, cells were released for 30 min, after which MG132 was added for 90 min to arrest cells in metaphase. Anaphases were scored after 2 hr release. Graphs indicate the number (n) of mitosis scored from 3 independent experiments. Statistical analysis was performed via the two-way ANOVA multiple comparison analysis with p < 0.05, ∗∗p < 0.01, ∗∗∗p < 0.001. Total number of abnormalities was considered in determining statistical significance. Scale bars: 10 μm. (G) Long-term colony formation assay of CDK1i-synchronized HT1080 cells that were released into media containing the indicated drugs for 2 hr. Mitotic cells were collected by shake off, washed, and 1,000 cells were re-plated for clonogenic assay in the absence of drug. Graphs show the mean ± SE of three independent experiments, normalized to control. Two-way ANOVA multiple comparison analysis with p < 0.05, ∗∗p < 0.01, ∗∗∗p < 0.001.
Figure 6
Figure 6
Cells from Ripk1 and Casp8 Knockout Animals Harbor Defects in Chromosome Alignment (A) Grading of segregation defects. (B and C) Chromosome alignment defects of the indicated primary MEFs. Images show representative phenotypes. Cells were released for 30 min after which 10 μM MG132 was added for 90 min to arrest cells in metaphase. Graphs indicate the number (n) of mitosis scored from 3 independent experiments. Statistical analysis was performed via the two-way ANOVA multiple comparison analysis with p < 0.05, ∗∗p < 0.01, ∗∗∗p < 0.001. Total amount of abnormalities was considered in determining statistical significance Scale bars: 10 μm. (D) Primary intestinal organoids from Ripk1fl/fl,IEC-creERTM animals. Organoids were treated with ETOH (vehicle control) or 4-OHT, synchronized with CDK1i, released into media, and scored for alignment defects. Cells were released for 30 min, after which 10 μM MG132 was added for 90 min to arrest cells in metaphase. Graphs indicate the number (n) of mitosis scored from 3 independent experiments. Statistical analysis was performed via the two-way ANOVA multiple comparison analysis with p < 0.05, ∗∗p < 0.01, ∗∗∗p < 0.001. Arrows indicate misaligned chromosomes. Total amount of abnormalities was considered in determining statistical significance. Scale bars: 10 μm. (E) Chromosome alignment defects of the indicated primary MEFs following knockdown of indicated genes. Images show representative phenotypes. Cells were released for 30 min after which 10 μM MG132 was added for 90 min to arrest cells in metaphase. Graphs indicate the number (n) of mitosis scored from 3 independent experiments. Statistical analysis was performed via the two-way ANOVA multiple comparison analysis with p < 0.05, ∗∗p < 0.01, ∗∗∗p < 0.001. Total amount of abnormalities was considered in determining statistical significance Scale bars: 10 μm. (F) Chromosome alignment defects of the indicated primary MEFs following knockdown of indicated genes. Images show representative phenotypes. Cells were released for 30 min after which 10 μM MG132 was added for 90 min to arrest cells in metaphase. Graphs indicate the number (n) of mitosis scored from 3 independent experiments. Statistical analysis was performed via the two-way ANOVA multiple comparison analysis with p < 0.05, ∗∗p < 0.01, ∗∗∗p < 0.001. Total amount of abnormalities was considered in determining statistical significance Scale bars: 10 μm. (G–I) Hemotoxylin- and eosin-stained sections of embryos of the indicated age and genotypes. Mitotic abnormalities were scored throughout the entire embryo (G and H) and the large intestine, liver and skin (I). The graph indicates the SE of mitotic abnormalities scored from three (G and H) and two embryos (I). Total amount of abnormalities was considered in determining statistical significance.
Figure 7
Figure 7
Ripk1 mRNA Levels Correlate with Aneuploidy in Human Cancers (A–D) Bioinformatics analyses of aneuploidy scores in association with RIPK1 mRNA expression (A–B), PLK1 mRNA expression (C), or the normalized ratio of the two (D) in breast (A, C, D) and lung (B) cancer patients. BRCA: breast cancer; LUAD: lung adenocarcinoma. ∗∗p < 0.01; ∗∗∗p < 0.001; ∗∗∗∗p < 0.0001. (A) n: 461; (B) n: 128; (C) n: 293; (D) n: 218.

References

    1. Anderton H., Bandala-Sanchez E., Simpson D.S., Rickard J.A., Ng A.P., Di Rago L., Hall C., Vince J.E., Silke J., Liccardi G., Feltham R. RIPK1 prevents TRADD-driven, but TNFR1 independent, apoptosis during development. Cell Death Differ. 2018 - PMC - PubMed
    1. Baker D.J., Jeganathan K.B., Cameron J.D., Thompson M., Juneja S., Kopecka A., Kumar R., Jenkins R.B., de Groen P.C., Roche P., van Deursen J.M. BubR1 insufficiency causes early onset of aging-associated phenotypes and infertility in mice. Nat. Genet. 2004;36:744–749. - PubMed
    1. Bakhoum S.F., Swanton C. Chromosomal instability, aneuploidy, and cancer. Front. Oncol. 2014;4:161. - PMC - PubMed
    1. Berger S.B., Kasparcova V., Hoffman S., Swift B., Dare L., Schaeffer M., Capriotti C., Cook M., Finger J., Hughes-Earle A. Cutting Edge: RIP1 kinase activity is dispensable for normal development but is a key regulator of inflammation in SHARPIN-deficient mice. J. Immunol. 2014;192:5476–5480. - PMC - PubMed
    1. Berger S.B., Harris P., Nagilla R., Kasparcova V., Hoffman S., Swift B., Dare L., Schaeffer M., Capriotti C., Ouellette M. Characterization of GSKʹ963: a structurally distinct, potent and selective inhibitor of RIP1 kinase. Cell Death Discov. 2015;1:15009. - PMC - PubMed

Publication types

MeSH terms