. 2019 Feb:40:457-470.
doi: 10.1016/j.ebiom.2018.12.058. Epub 2018 Dec 29.

Comprehensive molecular and immunological characterization of hepatocellular carcinoma

Affiliations

Comprehensive molecular and immunological characterization of hepatocellular carcinoma

Shu Shimada et al. EBioMedicine. 2019 Feb.

Abstract

Background: Hepatocellular carcinoma (HCC) is a heterogeneous disease with various etiological factors, and ranks as the second leading cause of cancer-related mortality worldwide due to multi-focal recurrence. We herein identified three major subtypes of HCC by performing integrative analysis of two omics data sets, and clarified that this classification was closely correlated with clinicopathological factors, immune profiles and recurrence patterns.

Methods: In the test study, 183 tumor specimens surgically resected from HCC patients were collected for unsupervised clustering analysis of gene expression signatures and comparative analysis of gene mutations. These results were validated by using genome, methylome and transcriptome data of 373 HCC patients provided from the Cancer Genome Atlas Network. In addition, omics data were obtained from pairs of primary and recurrent HCC.

Findings: Comprehensive molecular evaluation of HCC by multi-platform analysis defined three major subtypes: (1) mitogenic and stem cell-like tumors with chromosomal instability; (2) CTNNB1-mutated tumors displaying immune suppression; and (3) metabolic disease-associated tumors, which included an immunogenic subgroup characterized by macrophage infiltration and favorable prognosis. Although genomic and epigenomic analysis explicitly distinguished between HCC with intrahepatic metastasis (IM) and multi-centric HCC (MC), the phenotypic similarity between the primary and recurrent tumors was not correlated to the IM/MC origin, but to the classification.

Interpretation: Identification of these HCC subtypes provides further insights into patient stratification as well as presents opportunities for therapeutic development. FUND: Ministry of Education, Culture, Sports, Science and Technology of Japan (16H02670 and 18K19575), Japan Agency for Medical Research and Development (JP15cm0106064, JP17cm0106518, JP18cm0106540 and JP18fk0210040).

Keywords: CTNNB1 mutation; Hepatocellular carcinoma; Hepatocellular carcinoma with intrahepatic metastasis; Immunogenic cancer; Integrative analysis; Metabolic disease associated cancer; Molecular classification; Multi-centric hepatocellular carcinoma.


Figures

Fig. 1
Fig. 1
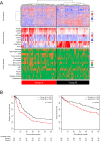
Comprehensive molecular classification of HCC in the TMDU test study identifying three molecular subtypes. (a) Transcriptomic classification of HCC. Unsupervised hierarchical clustering analysis of gene expression identified two groups; Group A (red, n = 94) and B (black, n = 89). The panel of molecular features is a heatmap displaying the relative expression levels of genes specifically upregulated in Group A or B. (b) Kaplan-Meier analysis of patients stratified by group. (c) Genomic and transcriptomic classification of HCC. Genome analysis divided Group B into HCC samples with (MS2) or without (MS3) CTNNB1 mutations which were detected only in Group B. MS1 (red, n = 17), MS2 (green, n = 6) and MS3 (blue, n = 10). (For interpretation of the references to colour in this figure legend, the reader is referred to the web version of this article.)
Fig. 1
Fig. 1
Comprehensive molecular classification of HCC in the TMDU test study identifying three molecular subtypes. (a) Transcriptomic classification of HCC. Unsupervised hierarchical clustering analysis of gene expression identified two groups; Group A (red, n = 94) and B (black, n = 89). The panel of molecular features is a heatmap displaying the relative expression levels of genes specifically upregulated in Group A or B. (b) Kaplan-Meier analysis of patients stratified by group. (c) Genomic and transcriptomic classification of HCC. Genome analysis divided Group B into HCC samples with (MS2) or without (MS3) CTNNB1 mutations which were detected only in Group B. MS1 (red, n = 17), MS2 (green, n = 6) and MS3 (blue, n = 10). (For interpretation of the references to colour in this figure legend, the reader is referred to the web version of this article.)
Fig. 2
Fig. 2
Comprehensive molecular classification of HCC in the TCGA validation study. Hierarchical clustering analysis with the gene set used in Fig. 1 could separate 373 HCCs into the MS1 (red, n = 114), MS2 (green, n = 74) and MS3 (blue, n = 185) as defined in Fig. 1c. (For interpretation of the references to colour in this figure legend, the reader is referred to the web version of this article.)
Fig. 3
Fig. 3
Summary of molecular classification of HCC. (a) Comparison of aggregate scores with gene sets associated with the previously defined molecular classifications of HCC in the TMDU test study (upper) and TCGA validation study (lower). (b) Schematic representation of molecular subtypes.
Fig. 4
Fig. 4
Immunological evaluation of primary HCC. (a) Hierarchical clustering analysis of aggregate scores with immune-related gene sets in the TCGA validation study. (b) Kaplan-Meier analysis of patients stratified by molecular subtype and immune class. (c) Cumulative CIBERSORT score for various types of immune cells in each sample. Horizontal lines show the median values. (d) CIBERSORT score for immune cells in each molecular subtype. Boxes in violin plots represent the interquartile range (range from the 25th to the 75th percentile), and horizontal lines show the median values.
Fig. 4
Fig. 4
Immunological evaluation of primary HCC. (a) Hierarchical clustering analysis of aggregate scores with immune-related gene sets in the TCGA validation study. (b) Kaplan-Meier analysis of patients stratified by molecular subtype and immune class. (c) Cumulative CIBERSORT score for various types of immune cells in each sample. Horizontal lines show the median values. (d) CIBERSORT score for immune cells in each molecular subtype. Boxes in violin plots represent the interquartile range (range from the 25th to the 75th percentile), and horizontal lines show the median values.
Fig. 5
Fig. 5
Molecular evaluation of recurrent HCC. (a) Genomic landscape of the gIM (orange, n = 8) and gMC pairs (lime, n = 10). Genes commonly mutated in more than two pairs are shown. White, gray and black bars represent primary, recurrent and re-recurrent HCC, respectively. (b) Density plots of genes which were frequently methylated in HCC and differentially done among the molecular subtypes in the gIM and gMC pairs. (c) Subtype transition between primary and recurrent HCC. The criteria for the determination of subtypes are described in Supplementary Table S6. Upper (light) and lower (dark) bars shows the gIM and gMC, respectively. (For interpretation of the references to colour in this figure legend, the reader is referred to the web version of this article.)

References

    1. Llovet J.M., Zucman-Rossi J., Pikarsky E., Sangro B., Schwartz M., Sherman M. Hepatocellular carcinoma. Nat Rev Dis Primers. 2016;2:16018. - PubMed
    1. de Bono J.S., Ashworth A. Translating cancer research into targeted therapeutics. Nature. 2010;467(7315):543–549. - PubMed
    1. Collins F.S., Varmus H. A new initiative on precision medicine. N Engl J Med. 2015;372(9):793–795. - PMC - PubMed
    1. Guichard C., Amaddeo G., Imbeaud S., Ladeiro Y., Pelletier L., Maad I.B. Integrated analysis of somatic mutations and focal copy-number changes identifies key genes and pathways in hepatocellular carcinoma. Nat Genet. 2012;44(6):694–698. - PMC - PubMed
    1. Fujimoto A., Totoki Y., Abe T., Boroevich K.A., Hosoda F., Nguyen H.H. Whole-genome sequencing of liver cancers identifies etiological influences on mutation patterns and recurrent mutations in chromatin regulators. Nat Genet. 2012;44(7):760–764. - PubMed

Substances