

Analysis of research intensity on infectious disease by disease burden reveals which infectious diseases are neglected by researchers
- PMID: 30598444
- PMCID: PMC6329976
- DOI: 10.1073/pnas.1814484116
Analysis of research intensity on infectious disease by disease burden reveals which infectious diseases are neglected by researchers
Abstract
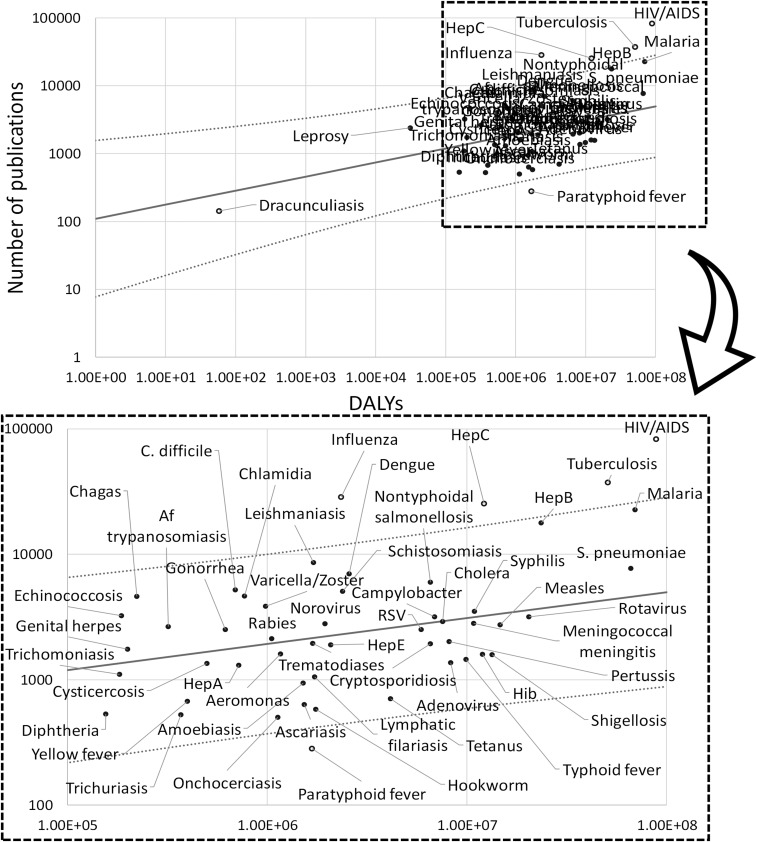
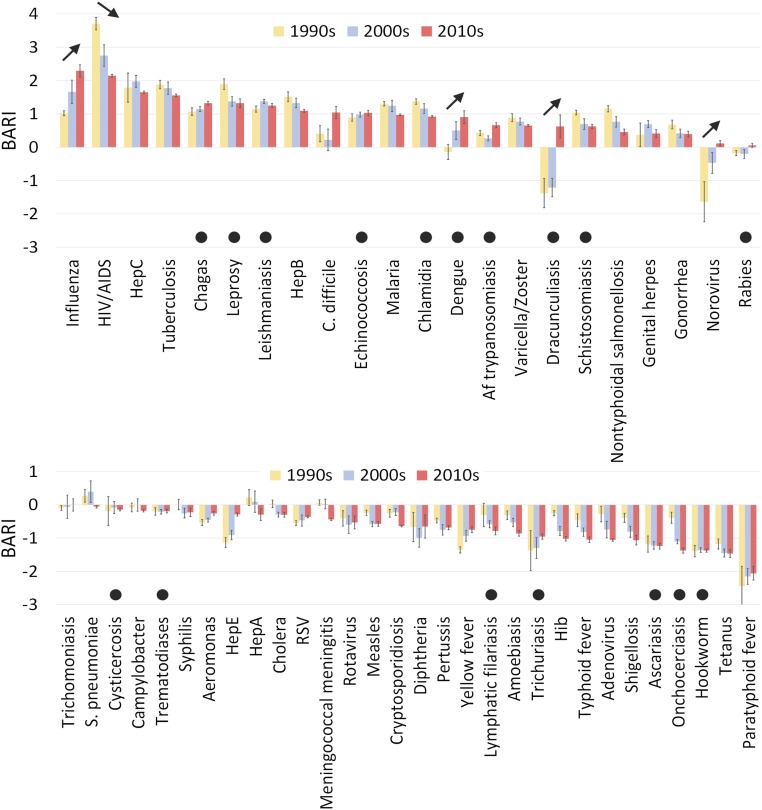
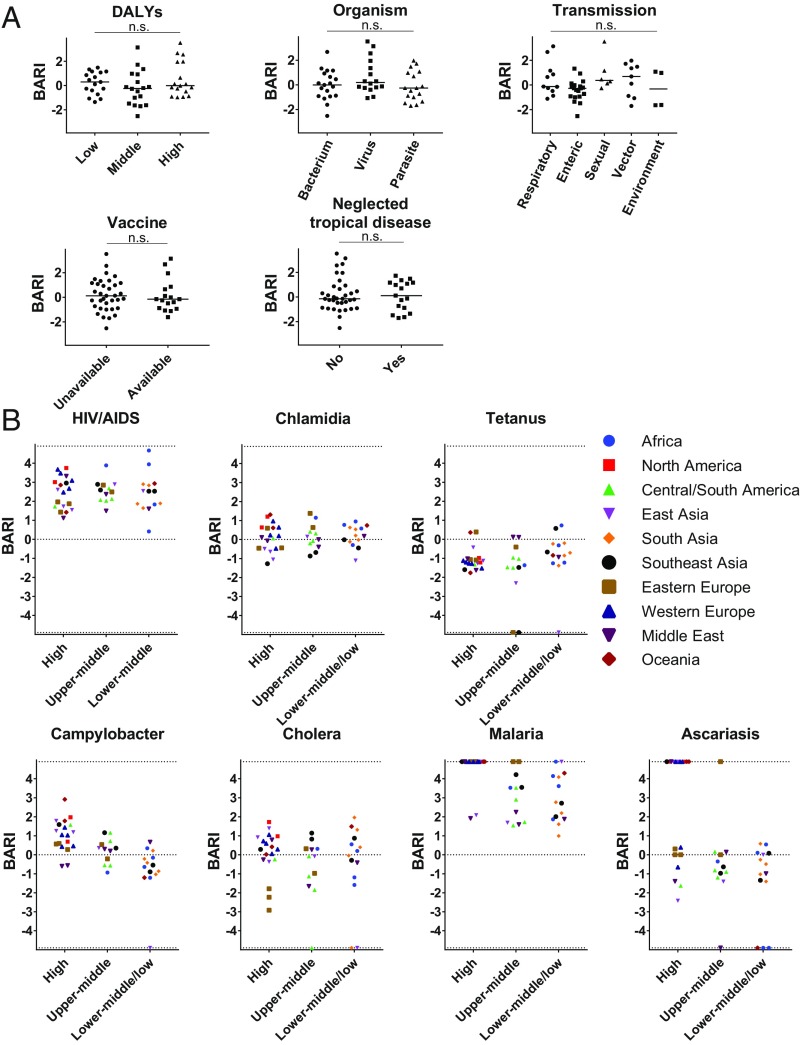
Infectious diseases are associated with considerable morbidity and mortality worldwide. Although human, financial, substantial, and time resources are limited, it is unknown whether such resources are used effectively in research to manage diseases. The correlation between the disability-adjusted life years to represent disease burden and number of publications as a surrogate for research activity was investigated to measure burden-adjusted research intensity for 52 infectious diseases at global and country levels. There was significantly low research intensity for paratyphoid fever and high intensity for influenza, HIV/acquired immunodeficiency syndrome, hepatitis C, and tuberculosis considering their disease burden. We identified the infectious diseases that have received the most attention from researchers and those that have been relatively disregarded. Interestingly, not all so-called neglected tropical diseases were subject to low burden-adjusted research intensity. Analysis of the intensity of infectious disease research at a country level revealed characteristic patterns. These findings provided a basis for further discussion of the more appropriate allocation of resources for research into infectious diseases.
Keywords: epidemiology; infectious diseases; neglected tropical diseases; philology; public health.
Conflict of interest statement
The author declares no conflict of interest.
Figures
Similar articles
-
The burden of infectious disease among inmates of and releasees from US correctional facilities, 1997.Am J Public Health. 2002 Nov;92(11):1789-94. doi: 10.2105/ajph.92.11.1789. Am J Public Health. 2002. PMID: 12406810 Free PMC article.
-
[Infectious diseases in Poland in 2005].Przegl Epidemiol. 2007;61(2):177-87. Przegl Epidemiol. 2007. PMID: 17956029 Polish.
-
Spatiotemporal and Seasonal Trends of Class A and B Notifiable Infectious Diseases in China: Retrospective Analysis.JMIR Public Health Surveill. 2023 Apr 27;9:e42820. doi: 10.2196/42820. JMIR Public Health Surveill. 2023. PMID: 37103994 Free PMC article.
-
The global fight against HIV/AIDS, tuberculosis, and malaria: current status and future perspectives.Am J Clin Pathol. 2009 Jun;131(6):844-8. doi: 10.1309/AJCP5XHDB1PNAEYT. Am J Clin Pathol. 2009. PMID: 19461091 Review.
-
Infectious diseases in the Arabian Peninsula and Egypt.Clin Microbiol Infect. 2012 Nov;18(11):1068-80. doi: 10.1111/1469-0691.12010. Clin Microbiol Infect. 2012. PMID: 23066725 Review.
Cited by
-
Calibration of individual-based models to epidemiological data: A systematic review.PLoS Comput Biol. 2020 May 11;16(5):e1007893. doi: 10.1371/journal.pcbi.1007893. eCollection 2020 May. PLoS Comput Biol. 2020. PMID: 32392252 Free PMC article.
-
The Role of Gram-Negative Bacteria in Urinary Tract Infections: Current Concepts and Therapeutic Options.Adv Exp Med Biol. 2021;1323:35-69. doi: 10.1007/5584_2020_566. Adv Exp Med Biol. 2021. PMID: 32596751 Review.
-
Paradigm shift required for translational research on the brain.Exp Mol Med. 2024 May;56(5):1043-1054. doi: 10.1038/s12276-024-01218-x. Epub 2024 May 1. Exp Mol Med. 2024. PMID: 38689090 Free PMC article. Review.
-
HIV research output in African Countries between 1986-2020.PLOS Glob Public Health. 2023 Jun 22;3(6):e0000544. doi: 10.1371/journal.pgph.0000544. eCollection 2023. PLOS Glob Public Health. 2023. PMID: 37347720 Free PMC article.
-
One Day in Denmark: Nationwide point-prevalence survey of human bacterial isolates and comparison of classical and whole-genome sequence-based species identification methods.PLoS One. 2022 Feb 11;17(2):e0261999. doi: 10.1371/journal.pone.0261999. eCollection 2022. PLoS One. 2022. PMID: 35148318 Free PMC article.
References
-
- Abajobir AA, et al. GBD 2016 DALYs and HALE Collaborators Global, regional, and national disability-adjusted life-years (DALYs) for 333 diseases and injuries and healthy life expectancy (HALE) for 195 countries and territories, 1990-2016: A systematic analysis for the Global Burden of Disease Study 2016. Lancet. 2017;390:1260–1344. - PMC - PubMed
-
- Lederberg J. Infectious history. Science. 2000;288:287–293. - PubMed
Publication types
MeSH terms
LinkOut - more resources
Full Text Sources
Medical
