. 2019 Feb;22(2):317-327.
doi: 10.1038/s41593-018-0301-3. Epub 2018 Dec 31.

Panoptic imaging of transparent mice reveals whole-body neuronal projections and skull-meninges connections

Affiliations

Panoptic imaging of transparent mice reveals whole-body neuronal projections and skull-meninges connections

Ruiyao Cai et al. Nat Neurosci. 2019 Feb.

Abstract

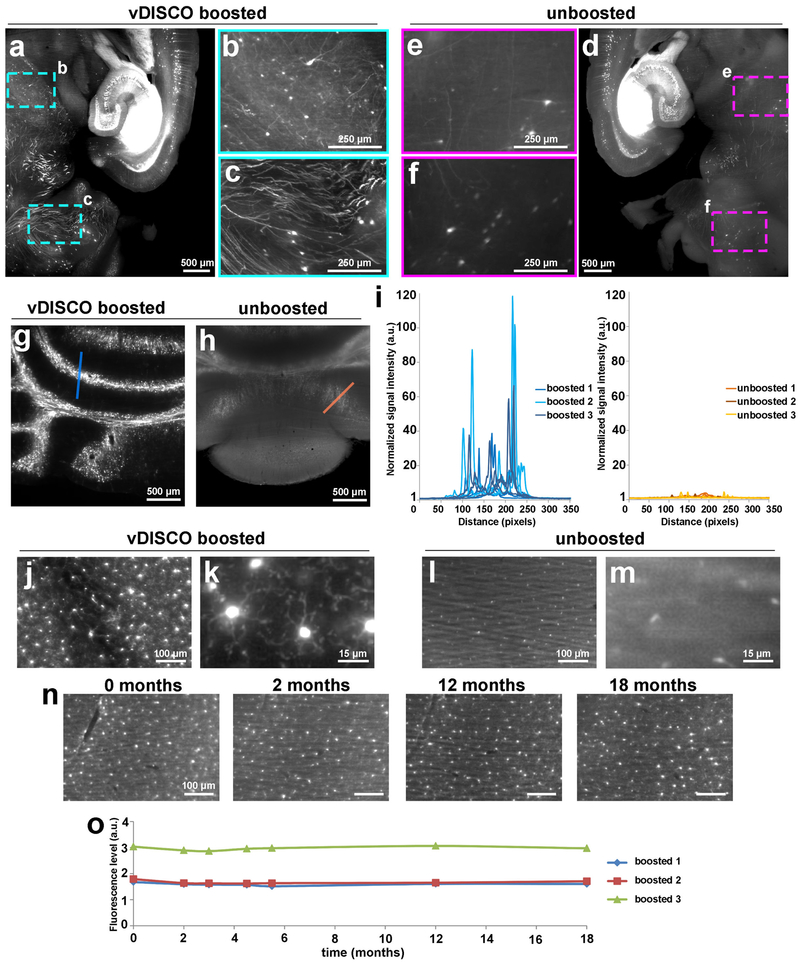
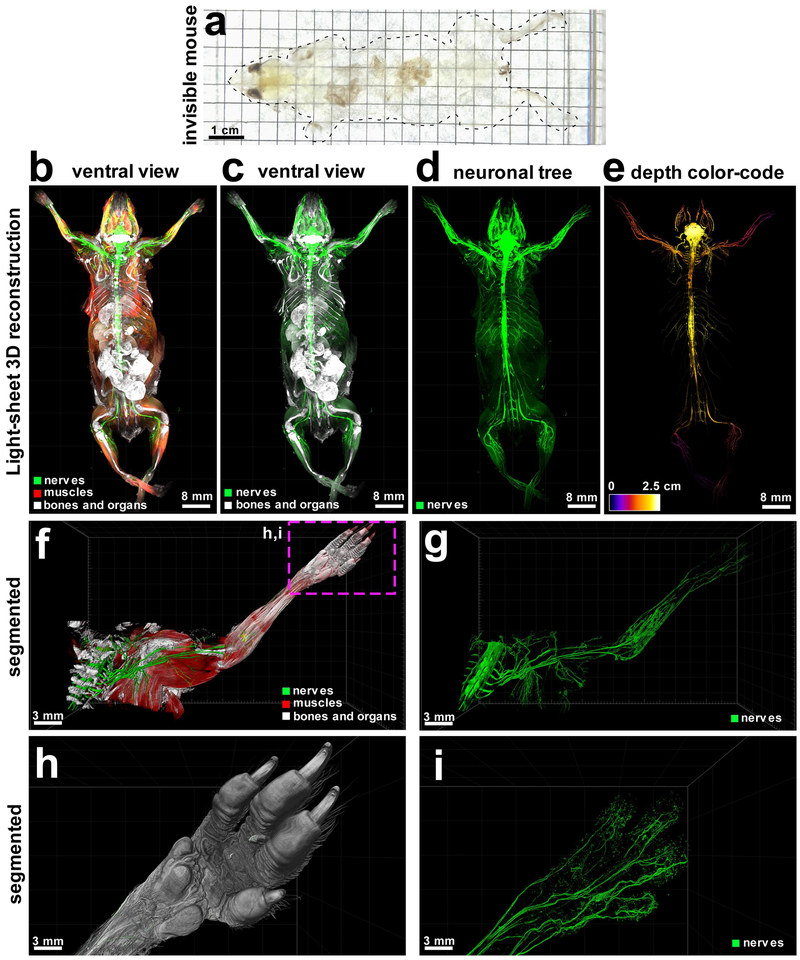
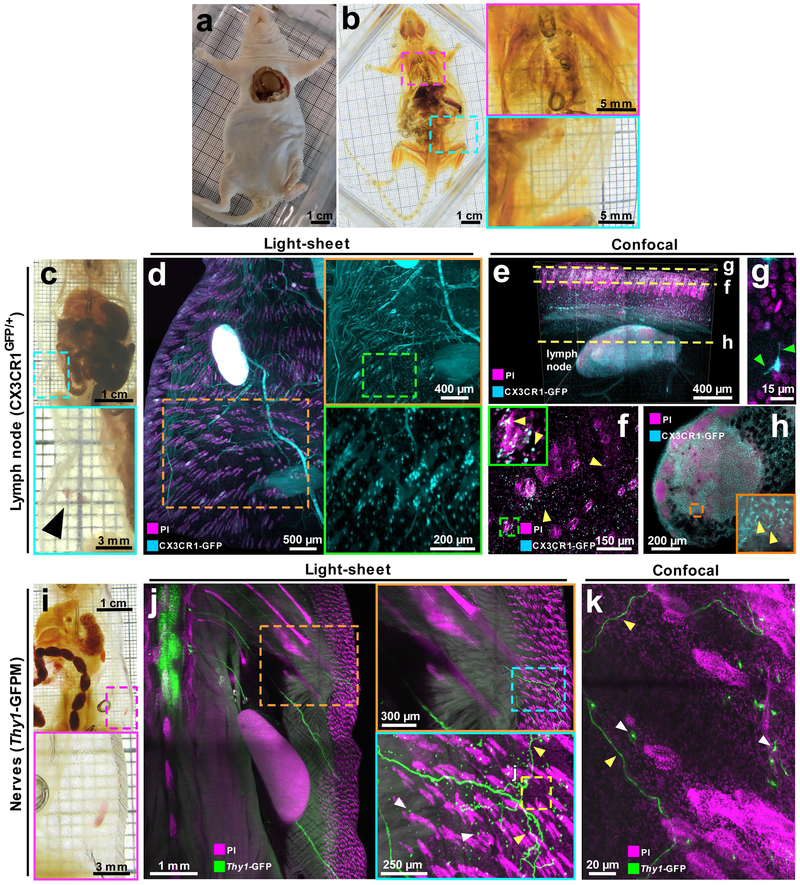
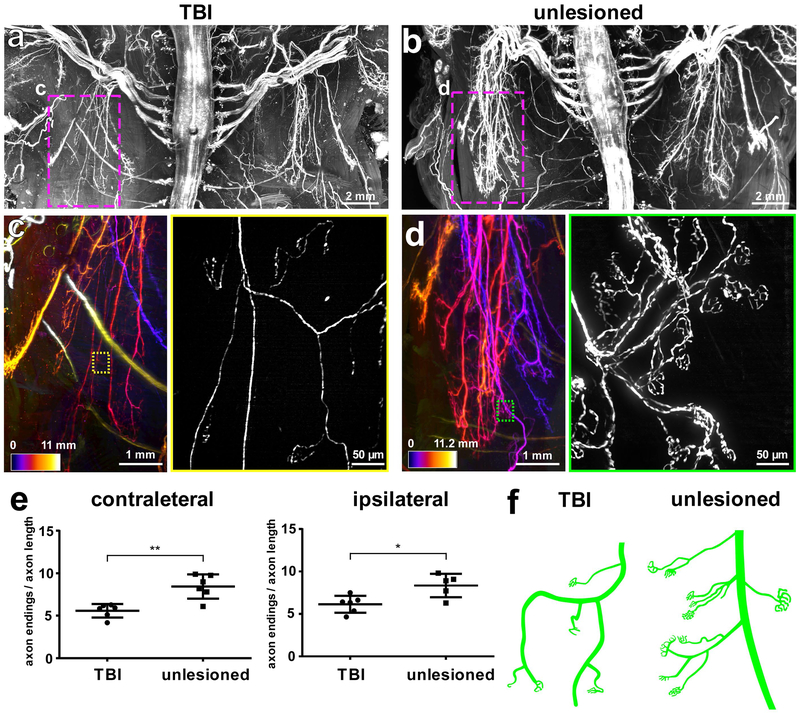
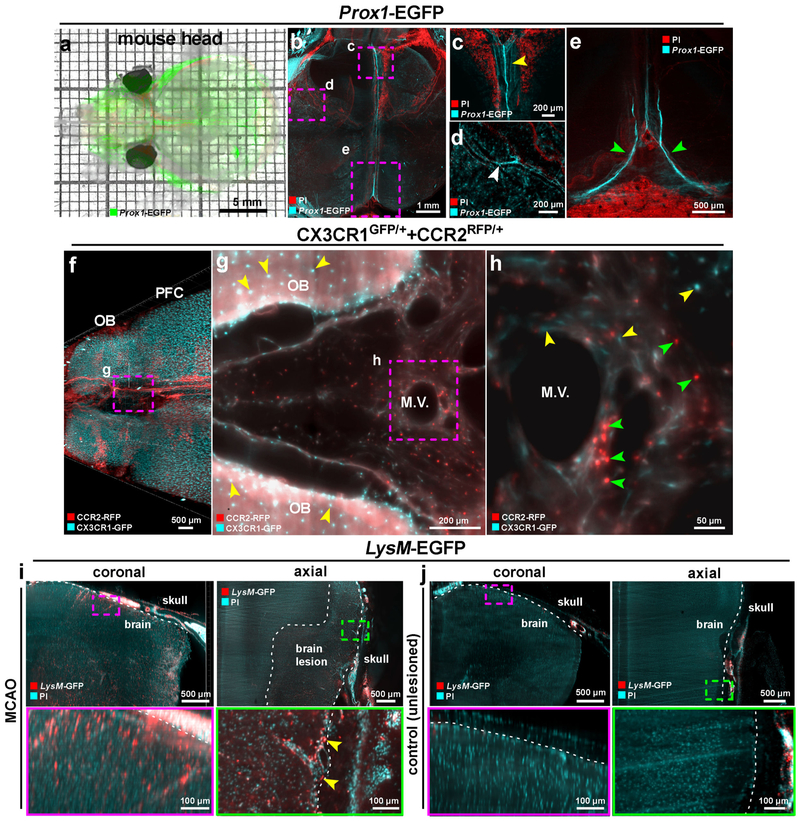
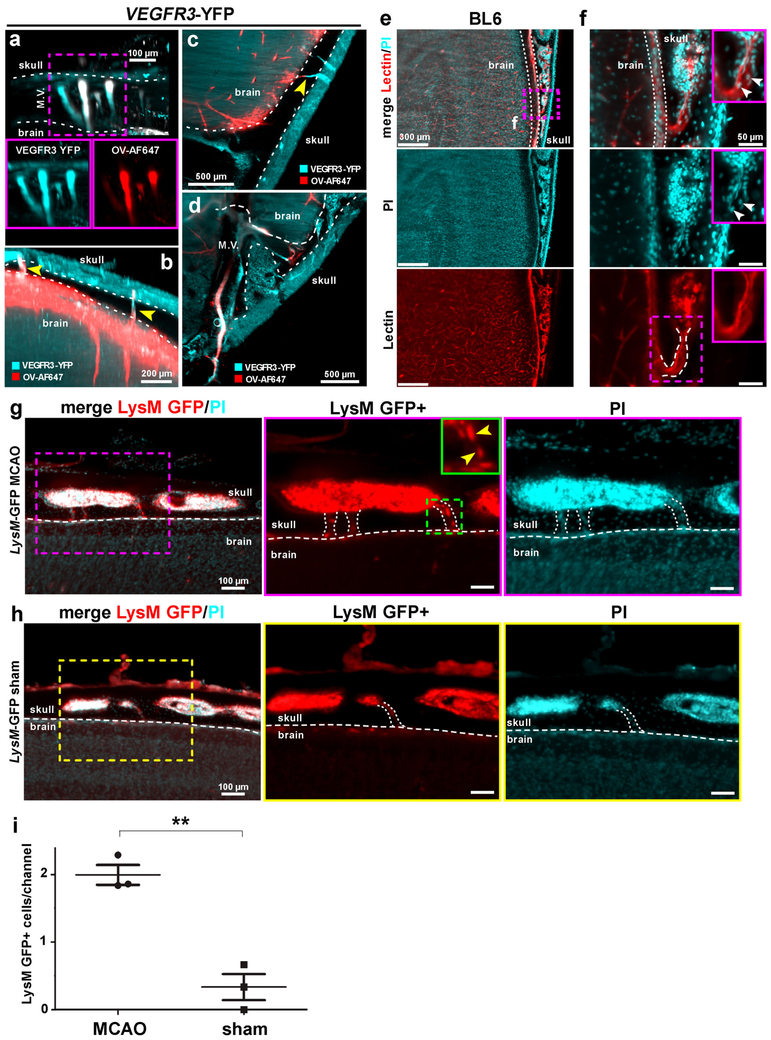
Analysis of entire transparent rodent bodies after clearing could provide holistic biological information in health and disease, but reliable imaging and quantification of fluorescent protein signals deep inside the tissues has remained a challenge. Here, we developed vDISCO, a pressure-driven, nanobody-based whole-body immunolabeling technology to enhance the signal of fluorescent proteins by up to two orders of magnitude. This allowed us to image and quantify subcellular details through bones, skin and highly autofluorescent tissues of intact transparent mice. For the first time, we visualized whole-body neuronal projections in adult mice. We assessed CNS trauma effects in the whole body and found degeneration of peripheral nerve terminals in the torso. Furthermore, vDISCO revealed short vascular connections between skull marrow and brain meninges, which were filled with immune cells upon stroke. Thus, our new approach enables unbiased comprehensive studies of the interactions between the nervous system and the rest of the body.


Figures

Figure 1
Figure 1. Enhancement and permanent preservation of the fluorescence signal with vDISCO
Signal quality comparison between vDISCO boosted (a) and unboosted (d) half brain samples coming from the same 11 months old Thy1-GFPM mouse. To achieve the best comparison between the two procedures, we divided the mouse brains in two halves for light-sheet microscopy imaging (one hemisphere boosted and imaged in far-red channel, the other hemisphere unboosted and imaged in the green channel for endogenous EGFP). The boosted hemisphere showed highly distinguishable cellular details (b,c) such as axonal projections not visible in the unboosted hemisphere (e,f) especially in the regions with dim GFP labeling in Thy1-GFPM mice, such as mid brain (b,e) and cerebellum (c,f) (representative images, repeated at least on 3 different samples). (g,h) Comparison of signal quality in cerebellum from the boosted (g) vs. unboosted (h) samples (repeated at least with 3 mice per group). (i) Plots of signal intensity profiles from boosted samples (left) vs. unboosted samples (right) along the blue and orange lines in panels g and h, respectively; n=3 brains for each group (2-6 months old Thy1-GFPM mice). (j-m) 4x and 25x magnification light-sheet microscopy images of the microglia from CX3CR1GFP/+ in boosted (j,k) vs. unboosted samples (l,m) showing the fine details of microglia ramifications obtained with vDISCO boosting (similar results repeated at least with 3 mice per group). (n) Representative light-sheet microscopy images of one of 3 CX3CR1GFP/+ mouse brains at 0, 2, 12 and 18 months after boosting, showing the preservation of the fluorescence signal over 18 months. (o) Fluorescence level quantifications in CX3CR1GFP/+ brains after boosting at different time points post-clearing (n=3 mice, 2-6 months old).
Figure 2
Figure 2. vDISCO panoptic imaging uncovers neuronal projections in intact mice
(a) An example of a transparent 6 weeks old mouse generated by vDISCO (similar results were observed from at least 20 independent mice). (b-e) 3D reconstruction of complete neuronal projections of a 6-weeks old Thy1-GFPM mouse obtained by light-sheet microscopy imaging (similar labelling and imaging results were achieved at least in 5 different mice; whole body reconstruction was performed on 2 mice). vDISCO boosted GFP+ neuronal structures are shown in green, bones and internal organs are prominent with PI labeling in white, and the muscles visualized by autofluorescence background imaging are in red (b-d). The depth color-coding shows the neuronal projections at different z-levels in the 2.5 cm thick whole mouse body (e). (f,g) High resolution 3D reconstruction views of the left torso and forelimb from the same animal in b-e. Details of innervation throughout muscles and bones are evident. (h,i) Surface reconstruction of the paw (h) and its nerves (i) from the marked region in f. See also Supplementary Video 2-4.
Figure 3
Figure 3. vDISCO panoptic imaging on mice with the intact skin
Adult NMRI nu/nu nude mouse (3-4 months old) (a) cleared with vDISCO method (b): the colored rectangles show zoom-in of the cleared lungs (magenta) and skin (cyan) in b (similar results were observed from 3 independent NMRI nu/nu mice). (c-h) vDISCO on 6 weeks old CX3CR1GFP/+ mouse with intact skin: (c) cleared body with the cyan rectangle showing visible inguinal lymph nodes (black arrow-head) through the transparent skin; (d) light-sheet images of CX3CR1GFP/+ mouse boosted with anti-GFP 647-nanobooster (cyan) and labeled with PI (magenta) showing CX3CR1 GFP+ cells (cyan) densely located in the lymph node and sparsely located in and under the skin such as around hair follicles (magenta). (e-h) confocal 1mm z-scan of the skin and lymph node in d with visible CX3CR1 GFP+ cells (cyan) and nuclei (magenta): (e) 3D rendering of the stack showing the skin and the lymph node beneath; (f) 2D image at the level of the skin with single CX3CR1 GFP+ cells in the tissue and in the hair follicles (yellow arrow-heads): the fine details of the ramifications of the immune cells at the surface of the skin are visible (green arrow-heads) (g); (h) 2D image of the lymph node with visible immune cells (yellow arrow-heads) in the organ. See also Supplementary Video 5. (i-k) vDISCO on 2 months old Thy1-GFPM mouse with intact skin: (i) cleared body with the magenta rectangle showing a visible inguinal lymph node through the skin; (j) light-sheet images of Thy1-GFPM mouse boosted with anti-GFP 647-nanobooster (green) and labeled with PI (magenta) showing Thy1-GFP expressing immune cells (white arrow-heads) and neuronal projections coming from the spinal cord and projecting to the rest of the body including the skin (green), the colored rectangles show zoom-in details of a neuronal projection (green fibers and yellow arrow-heads) projecting into the skin; (k) high magnification confocal image of the region in j (yellow dashed rectangle) showing details of the immune cells (white arrow-heads) and neuronal projections (green, yellow arrow-heads) into the skin of the animal. All the results from c to k were similarly observed in 2 independent mice per each mouse line.
Figure 4
Figure 4. TBI-induced peripheral nerve degeneration revealed by vDISCO panoptic imaging
Background equalized light-sheet microscopy maximum intensity projections of the torso from TBI-induced (a) vs. unlesioned control (b) Thy1-GFPM mice. (c,d) High magnification views of marked regions in a and b, showing the left thoracic peripheral nerve projections in the TBI (c) vs. control animal (d), the color-code indicates the z-depth of anatomical regions as given in the scale bars. The colored rectangles show the high magnification images of the marked regions in c and d, respectively, demostrating fewer intact peripheral nerve endings in TBI mice compared to controls (similar results were observed from 6 independent mice per group). (e) Quantification of axonal projection complexity expressed as number of peripheral nerve endings over length of axonal ramifications in TBI vs. control mice (3-5 months old) at the level of the contralateral side (left) and ipsilateral side (right) (mean ± s.d.; for the contralateral side: n=6 animals per group; for the ipsilateral side: n=6 and 5 mice for the TBI group and for the unlesioned group, respectively; statistical significance (**p = 0.003, *p = 0.03) was assessed by two tailed t-test). (f) Representative illustration showing the peripheral nerve ending morphology in TBI vs. control mice.
Figure 5
Figure 5. Visualizing meningeal vessels through intact skull by vDISCO panoptic imaging
(a) A representative 4 weeks old transparent Prox1-EGFP mouse head from 5 independent animals showing the labeled vessels underneath the skull. (b-e) The Prox1-EGFP mouse head showing the brain lymphatic vessels along the sagittal sinus, pterygopalatine artery and transverse sinus (yellow, white and green arrowheads in c, d and e, respectively). Bone structures become prominent with PI labeling (red). Single experiment. (f) 3D visualization of prefrontal cortex (PFC) and olfactory bulb (OB) in a 2 months old CX3CR1GFP/+ (cyan) and CCR2RFP/+ (red) double transgenic mouse (similar results were observed from 3 independent double transgenic mice). (g,h) High-magnification image of marked region in f showing CCR2 RFP+ cells (green arrowheads) and CX3CR1 GFP+ cells (yellow arrowheads) in meningeal vessels. See also Supplementary Video 7. (i,j) 6 months old LysM-EGFP transgenic mice with MCAO vs. unlesioned control showing the infiltration of immune cells in MCAO (similar results were observed from 4 independent mice per group). LysM GFP+ cells are shown in red and nucleus labeling by PI in cyan. Immune cells in the meningeal vessels of the injured mice were observed (yellow arrowheads). All images were obtained by light-sheet microscopy.
Figure 6
Figure 6. Uncovering skull – meninges connections (SMCs) through intact skull by vDISCO panoptic imaging
(a-d) A 6 months old VEGFR3-YFP mouse head in sagittal (a,b) and axial views (c,d) showing that injected CSF tracer (Ovalbumin-Alexa647, red) fills not only meningeal vessels but also some short skull-meninges connections (SMCs) between skull marrow and brain surface (b,c, yellow arrowheads) (representative images, single experiment). (e,f) Details of SMCs after whole mouse body PI and lectin labeling of a 3 weeks old C57BL/6 mouse processed by vDISCO: the SMCs from skull marrow to brain surface with a funnel-shape opening are marked with dashed lines in f. Cells in the channel are indicated by white arrow heads (similar results were observed from 5 independent mice). (g,h) 6 months old LysM-EGFP transgenic mice after MCAO (g) vs. sham control (h) showing increased numbers of LysM GFP+ cells (yellow arrow-heads) in the SMCs (marked with dashed lines) in MCAO (similar results were observed from 3 independent mice per group). LysM GFP+ cells are shown in red and nucleus labeling by PI in cyan. See also Supplementary Video 10. (i) Quantification of LysM GFP+ cells in the SMCs in MCAO vs. sham mice (mean ± SEM; n=3 animals per group; statistical significance (**p = 0.003) was assessed by two tailed t-test).

References

    1. Tuchin VV & Tuchin V Tissue optics: light scattering methods and instruments for medical diagnosis. Vol. 642 (SPIE press; Bellingham, 2007).
    1. Chung K et al. Structural and molecular interrogation of intact biological systems. Nature 497, 332–337, doi:10.1038/nature12107 (2013). - DOI - PMC - PubMed
    1. Yang B et al. Single-cell phenotyping within transparent intact tissue through whole-body clearing. Cell 158, 945–958, doi:10.1016/j.cell.2014.07.017 (2014). - DOI - PMC - PubMed
    1. Renier N et al. iDISCO: a simple, rapid method to immunolabel large tissue samples for volume imaging. Cell 159, 896–910, doi:10.1016/j.cell.2014.10.010 (2014). - DOI - PubMed
    1. Susaki EA et al. Whole-brain imaging with single-cell resolution using chemical cocktails and computational analysis. Cell 157, 726–739, doi:10.1016/j.cell.2014.03.042 (2014). - DOI - PubMed

Publication types