. 2019 Feb;3(2):293-301.
doi: 10.1038/s41559-018-0758-1. Epub 2018 Dec 31.

The dynamics of adaptive genetic diversity during the early stages of clonal evolution

Affiliations

The dynamics of adaptive genetic diversity during the early stages of clonal evolution

Jamie R Blundell et al. Nat Ecol Evol. 2019 Feb.

Abstract

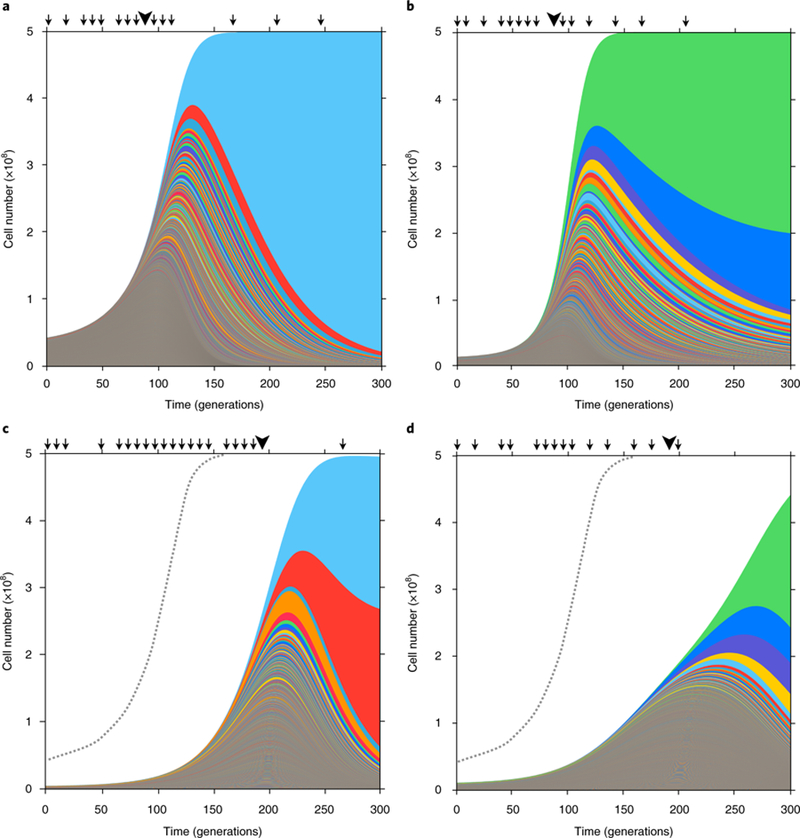
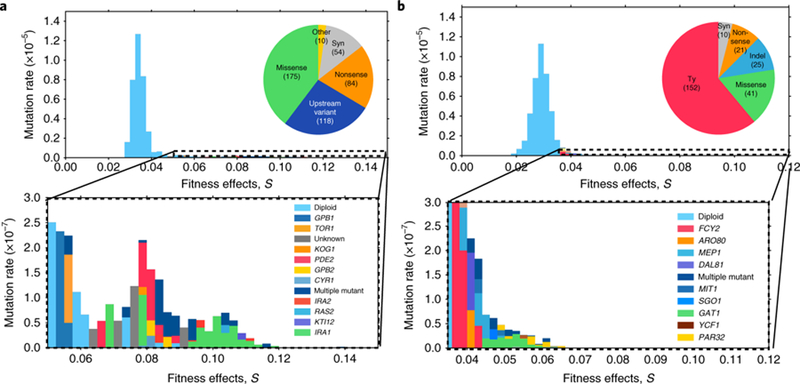
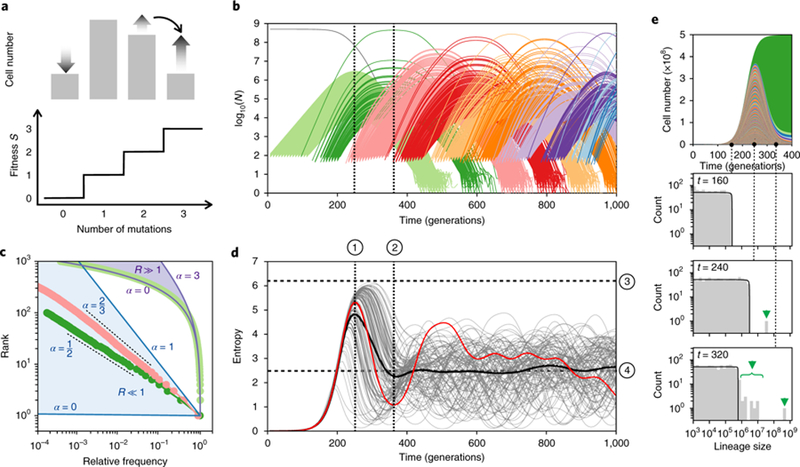
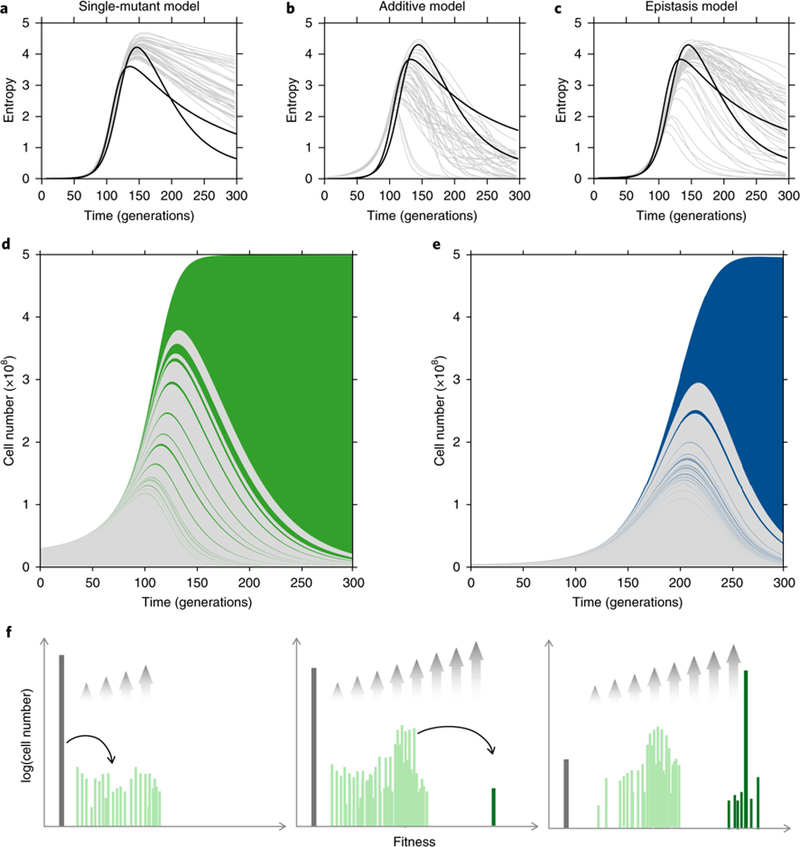
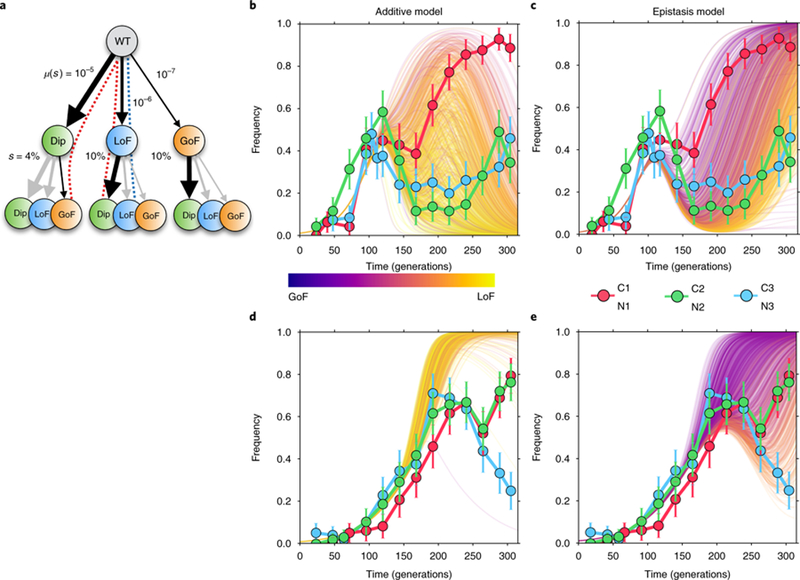
The dynamics of genetic diversity in large clonally evolving cell populations are poorly understood, despite having implications for the treatment of cancer and microbial infections. Here, we combine barcode lineage tracking, sequencing of adaptive clones and mathematical modelling of mutational dynamics to understand adaptive diversity changes during experimental evolution of Saccharomyces cerevisiae under nitrogen and carbon limitation. We find that, despite differences in beneficial mutational mechanisms and fitness effects, early adaptive genetic diversity increases predictably, driven by the expansion of many single-mutant lineages. However, a crash in adaptive diversity follows, caused by highly fit double-mutant 'jackpot' clones that are fed from exponentially growing single mutants, a process closely related to the classic Luria-Delbrück experiment. The diversity crash is likely to be a general feature of asexual evolution with clonal interference; however, both its timing and magnitude are stochastic and depend on the population size, the distribution of beneficial fitness effects and patterns of epistasis.


Figures

Fig. 1|
Fig. 1|. Muller plots of adaptive lineages.
a-d, The cell numbers of all adaptive lineages (colours) inferred from barcode sequencing (arrows) and whole-genome sequencing of picked clones (large arrowheads) of replicate evolutions in C-lim (a and b) and N-lim media (c and d). Colours are for visualization purposes only and do not represent lineages harbouring specific mutations.
Fig. 2|
Fig. 2|. Barcode-directed whole-genome sequencing of adaptive clones to find the mutational targets underlying the distribution of beneficial fitness effects (mDFE).
a, C-lim. b, N-lim. Most adaptive events are diploidizations (top, light blue), but high fitness effects are caused by mutations in or near genes (bottom, colour key). Each fitness bin is coloured according to the estimated rate of mutation of verified single mutants to each gene in that bin (S3). The colour key is roughly ordered from lowest to highest fitness effect of a mutational event. Pie charts indicate the mutational mechanisms of adaptive mutations.
Fig. 3|
Fig. 3|. The dynamics of adaptive genetic diversity in the fitness-staircase model.
a, The fitness-staircase model in the multiple-mutation regime. Clones with different numbers of mutations expand in the population concurrently. The distribution of cells containing different numbers of mutations changes through time, with the distribution at t ≈ 250 (from simulation in b) shown. Clones expand or contract in relation to their advantage over the mean population fitness. b, The trajectories of all unique adaptive clones (lines, coloured by fitness class) from a typical simulation with population size N= 5×10⁸, beneficial mutation rate U = 10−6 and additive fitness effects of size s = 0.05. c, The rank-frequency plot for single-(light green), double-(dark green) and triple-(pink) mutant clones averaged over 100 simulations, one instance of which is shown in b. Frequencies shown are relative to the first mutant to establish. Single mutants establish deterministically with a clone-size distribution that is approximately exponential (purple lines). Double and triple mutants establish stochastically with power-law clone-size distributions (dashed lines). Solid blue and purple lines indicate the limiting behaviours: no fitness difference between mutant classes (α ≈ 1, blue line), the Luria-Delbrück limit, and constant feeding (α ≈ 0). d, The entropy of all adaptive clones in the population over time for 100 simulations (grey lines). The particular simulation from b is highlighted in red and the mean of all 100 simulations is shown in black. Diversity approaches its steady state non-monotonically, reproducibly crashing below the long-term average and subsequently recovering to above long-term average levels. The parameter combinations that determine the positions of the various features labelled (1)-(4) are outlined in the text. e, The barcode trajectories from b and, beneath, their size distributions at three time points. At intermediate times, the largest barcode lineages are inconsistent with the single-mutant size distribution (black line) and, instead, are driven by anomalously large double mutants expanding within (and dominating) these lineages (green arrows). These are detectable before double mutants dominate the total population.
Fig. 4|
Fig. 4|. Exponential feeding of double mutants causes a diversity crash.
a-c, Shannon entropy of adaptive lineages from replicate experiments in C-lim (black lines) and stochastic simulations (grey lines) using a single-mutant model (a), additive model (b) or epistasis model (c). The entropy of adaptive clones closely tracks the entropy of adaptive lineages (Supplementary Figs. 9–14). d,e, Muller plots from Fig. 1 recoloured to depict single-mutant (grey) and early double-mutant (green and blue) adaptive lineages in C-lim (d) and N-lim (e). f, Schematic showing the statistical behaviour of the ancestor (grey), single-(light green) and double-(dark green) mutants. Grey arrows show the relative growth rates due to selection.
Fig. 5|
Fig. 5|. Simulations of diploid dynamics using the additive and ‘categorical’ epistasis models.
a, The simplified fitness landscape used for simulations in C-lim, where μ(s) indicates the mutation rates and s indicates the fitness effects, of Dip, LoF and GoF mutations. Greyed arrows are paths disallowed by the epistasis model. Dashed lines indicate the paths taken by the dominant clones in the additive (blue) and epistasis (red) models. b-e, The diploid trajectories in C-lim and N-lim predicted by the additive model (b and d, respectively) and the epistasis model (c and e, respectively) compared to the measured diploid trajectories (data points) from the three replicate populations in each condition. Colour scale indicates the extent to which the diploid rescue is driven by Dip + GoF (purple) versus LoF + Dip or Dip + LoF (yellow) mutants, with early rescue being more likely to be driven by Dip + GoF mutations. Error bars are one standard deviation.

References

    1. Desai MM, Walczak AM & Fisher DS Genetic diversity and the structure of genealogies in rapidly adapting populations. Genetics 193, 565–585 (2013). - PMC - PubMed
    1. Neher RA & Hallatschek O Genealogies of rapidly adapting populations. Proc. Natl Acad. Sci. USA 110, 437–442 (2013). - PMC - PubMed
    1. Nowell PC The clonal evolution of tumor cell populations. Science 194, 23–28 (1976). - PubMed
    1. Tenaillon O et al. Tempo and mode of genome evolution in a 50,000-generation experiment. Nature 536, 165–170 (2016). - PMC - PubMed
    1. Lang GI et al. Pervasive genetic hitchhiking and clonal interference in forty evolving yeast populations. Nature 500, 571–574 (2013). - PMC - PubMed

Publication types

LinkOut - more resources