

Vegetation trends over eleven years on mountain summits in NW Argentina
- PMID: 30598756
- PMCID: PMC6303700
- DOI: 10.1002/ece3.4602
Vegetation trends over eleven years on mountain summits in NW Argentina
Abstract
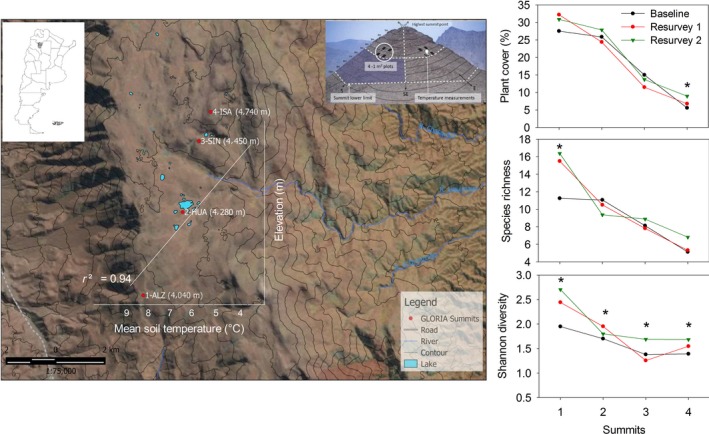
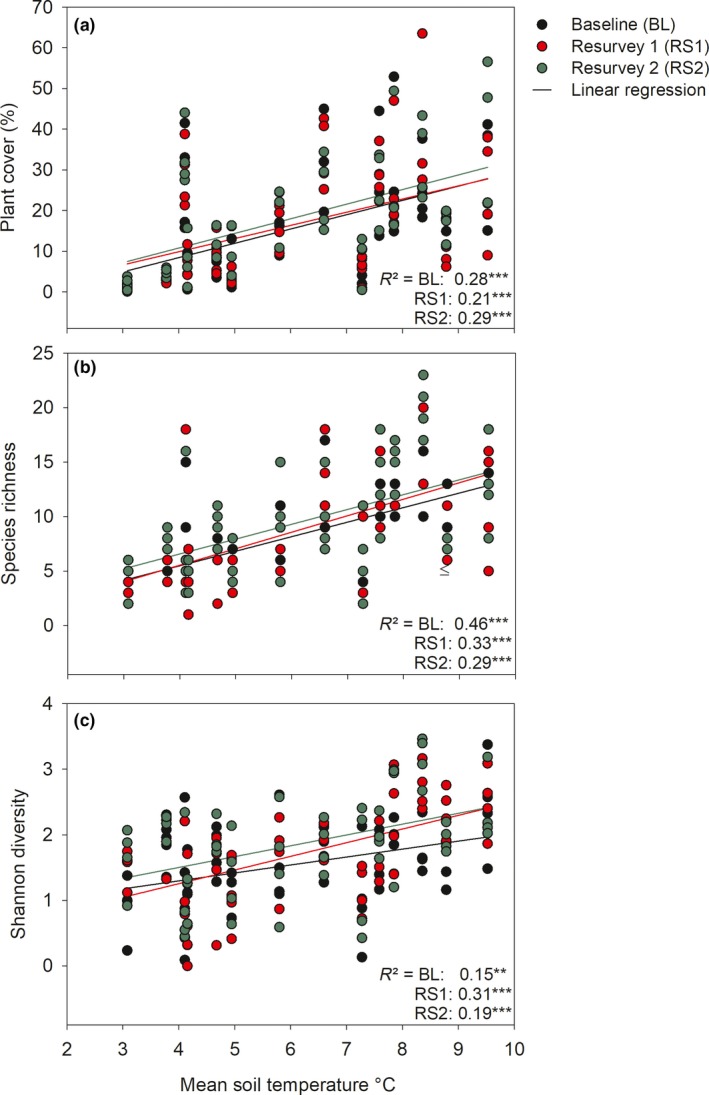
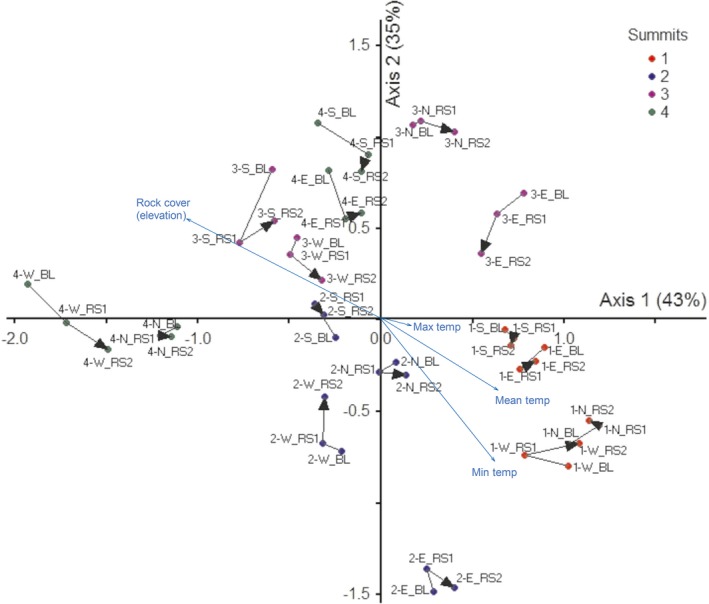
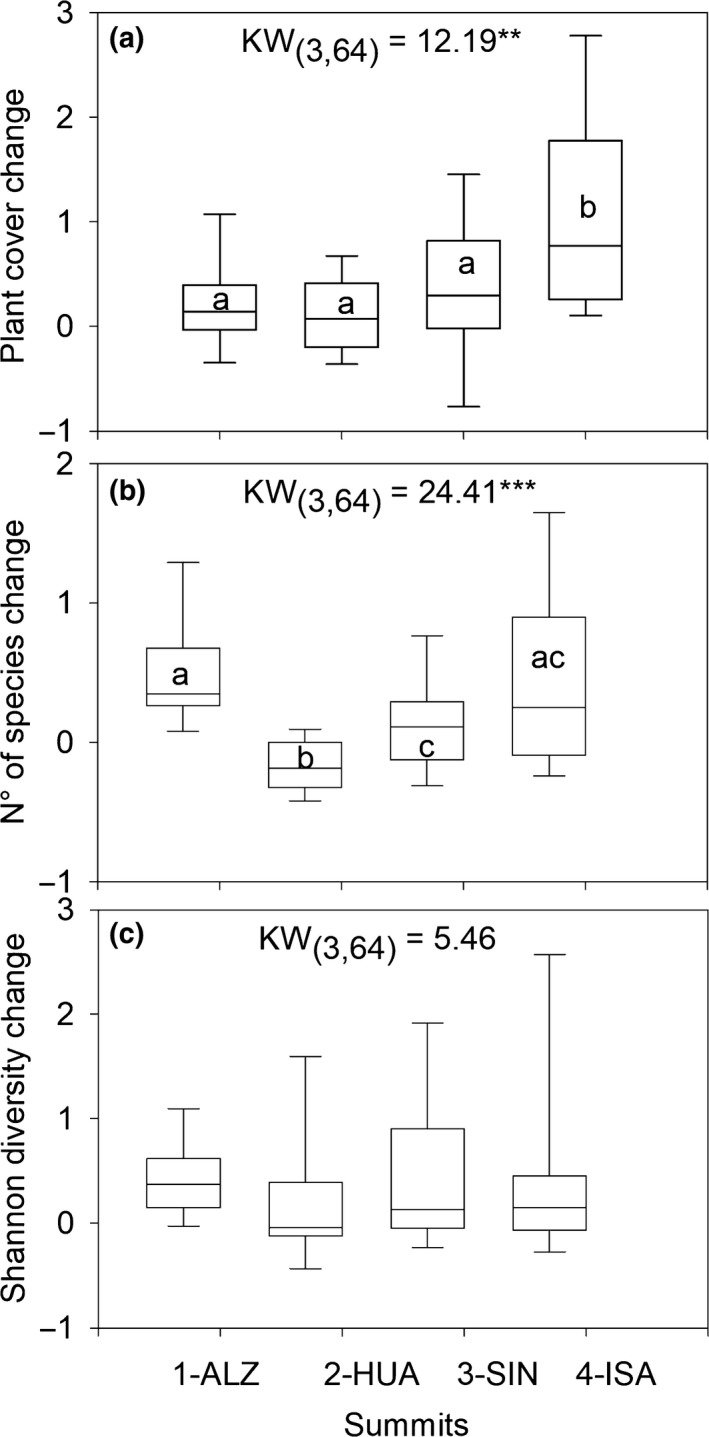
As global climate change leads to warmer and dryer conditions in the central Andes, alpine plant communities are forced to upward displacements following their climatic niche. Species range shifts are predicted to have major impacts on alpine communities by reshuffling species composition and abundances. Using a standardized protocol, we surveyed alpine plant communities in permanent plots on four high Andean summits in NW Argentina, which range from 4,040 to 4,740 m a.s.l. After a baseline survey in 2006-2008, we resurvey the same plots in 2012, and again in 2017. We found a significant decrease in plant cover, species richness, and diversity across the elevation gradient in the three censuses and a strong decrease in soil temperature along the elevation gradient. We found a high plant community turnover (37%-49%) among censuses, differentiating according to summits and aspects; major changes of community turnover were observed in the lowest summit (49%) and on the northern (47%) and western (46%) aspects. Temporal patterns in community changes were represented by increases in plant cover in the highest summit, in species richness in the lower summit, and in diversity (Shannon index) in the four summits, over time, together with increase in small herbs and non-tussock grasses. We suggest that the observed trend in plant community dynamics responds to short-term temperature and precipitation variability, which is influenced by El Niño Southern Oscillation (ENSO), and due to time lags in plant community response, it may take much longer than one decade for the observed trends to become stables and statistically significant. Our study provides an important foundation for documenting more profound changes in these subtropical alpine plant communities as global climate change continues.
Keywords: Andes; GLORIA initiative; climate change; community turnover; elevation gradient; plant diversity.
Figures
Similar articles
-
The Soil Microbiome of GLORIA Mountain Summits in the Swiss Alps.Front Microbiol. 2019 May 15;10:1080. doi: 10.3389/fmicb.2019.01080. eCollection 2019. Front Microbiol. 2019. PMID: 31156590 Free PMC article.
-
Early Evidence of Shifts in Alpine Summit Vegetation: A Case Study From Kashmir Himalaya.Front Plant Sci. 2020 Apr 24;11:421. doi: 10.3389/fpls.2020.00421. eCollection 2020. Front Plant Sci. 2020. PMID: 32391033 Free PMC article.
-
Snowbeds are more affected than other subalpine-alpine plant communities by climate change in the Swiss Alps.Ecol Evol. 2016 Sep 9;6(19):6969-6982. doi: 10.1002/ece3.2354. eCollection 2016 Oct. Ecol Evol. 2016. PMID: 28725374 Free PMC article.
-
Rapid changes in eastern Himalayan alpine flora with climate change.Am J Bot. 2019 Apr;106(4):520-530. doi: 10.1002/ajb2.1263. Epub 2019 Apr 1. Am J Bot. 2019. PMID: 30934119
-
Drivers of plant diversity, community composition, functional traits, and soil processes along an alpine gradient in the central Chilean Andes.Ecol Evol. 2024 Feb 9;14(2):e10888. doi: 10.1002/ece3.10888. eCollection 2024 Feb. Ecol Evol. 2024. PMID: 38343572 Free PMC article.
Cited by
-
Hydroclimate and vegetation variability of high Andean ecosystems.Front Plant Sci. 2023 Jan 20;13:1067096. doi: 10.3389/fpls.2022.1067096. eCollection 2022. Front Plant Sci. 2023. PMID: 36743541 Free PMC article.
-
Understanding climate change impacts on biome and plant distributions in the Andes: Challenges and opportunities.J Biogeogr. 2022 Aug;49(8):1420-1442. doi: 10.1111/jbi.14389. Epub 2022 Jun 3. J Biogeogr. 2022. PMID: 36247109 Free PMC article. Review.
-
Human populations in the world's mountains: Spatio-temporal patterns and potential controls.PLoS One. 2022 Jul 20;17(7):e0271466. doi: 10.1371/journal.pone.0271466. eCollection 2022. PLoS One. 2022. PMID: 35857800 Free PMC article.
References
-
- Anthelme, F. , Meneses, R. I. , Valero, N. N. H. , Pozo, P. , & Dangles, O. (2017). Fine nurse variations explain discrepancies in the stress‐interaction relationship in alpine regions. Oikos, 126(8), 1173–1183. 10.1111/oik.04248 - DOI
-
- Bates, D. , Kliegl, R. , Vasishth, S. , & Baayen, H. (2015). Parsimonious mixed models. arXiv preprint arXiv:1506.04967.
Associated data
LinkOut - more resources
Full Text Sources
Other Literature Sources
Research Materials
