. 2019 Jan 1;12(562):eaat6662.
doi: 10.1126/scisignal.aat6662.

Activation of atypical protein kinase C by sphingosine 1-phosphate revealed by an aPKC-specific activity reporter

Affiliations

Activation of atypical protein kinase C by sphingosine 1-phosphate revealed by an aPKC-specific activity reporter

Taketoshi Kajimoto et al. Sci Signal. .

Abstract

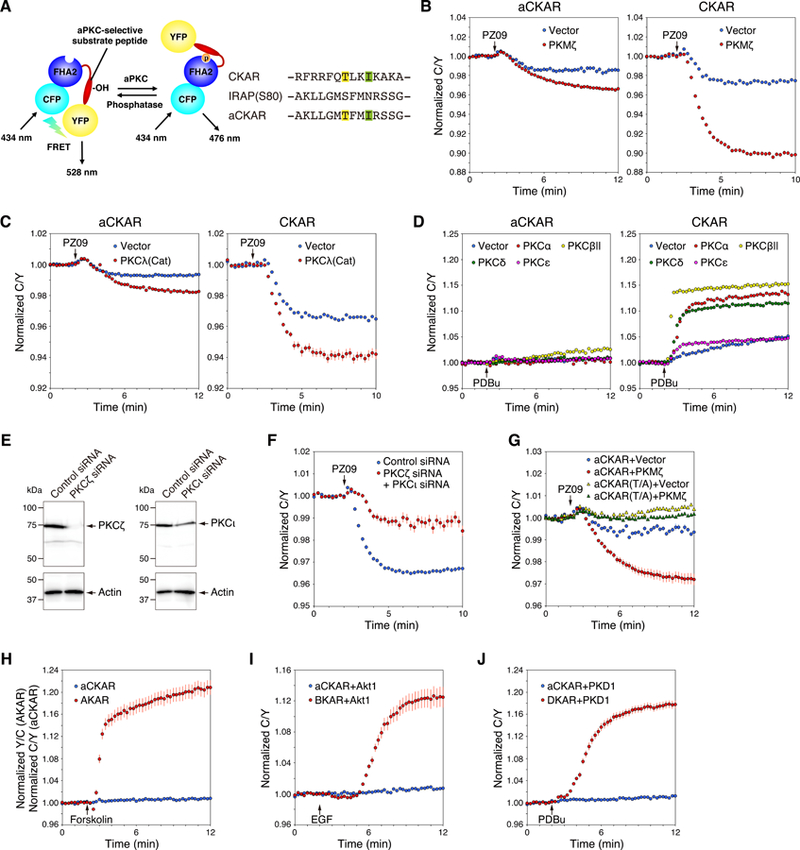
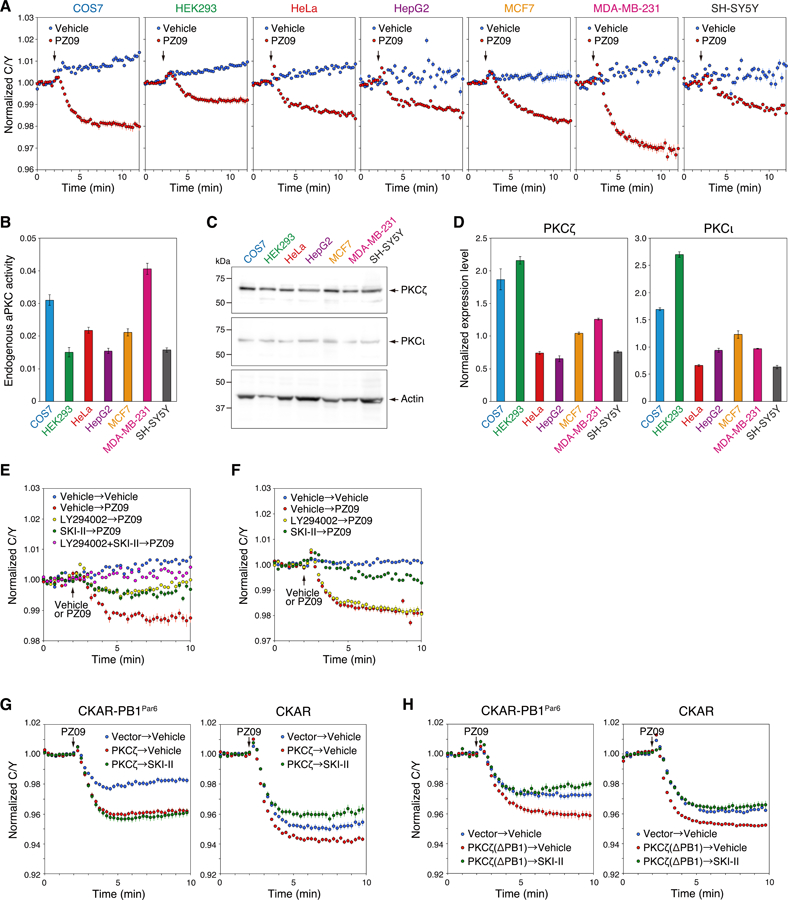
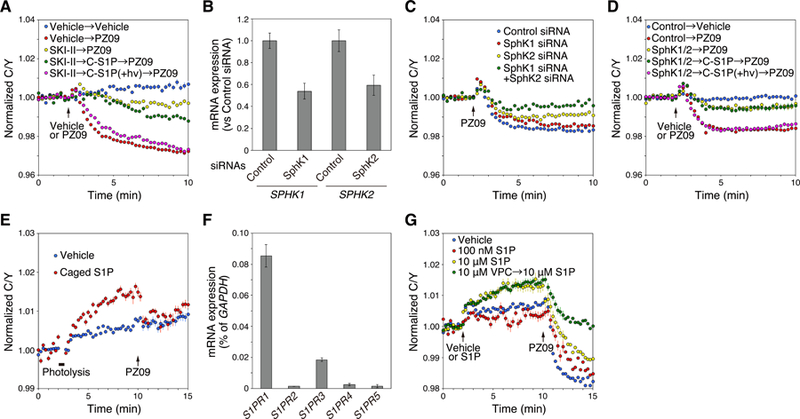
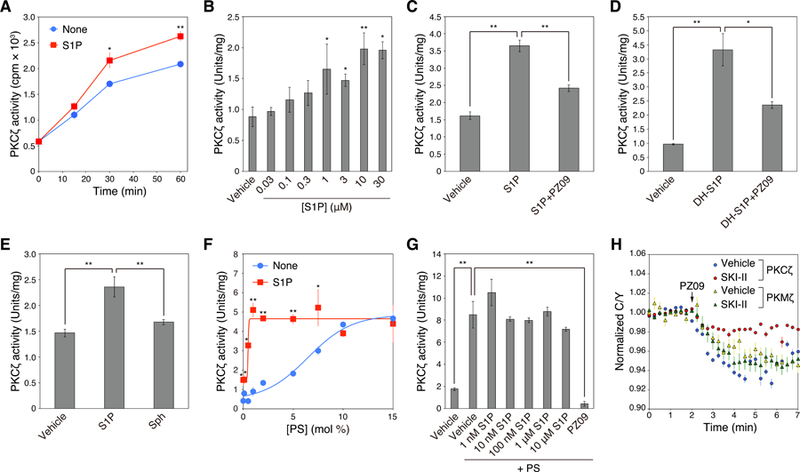
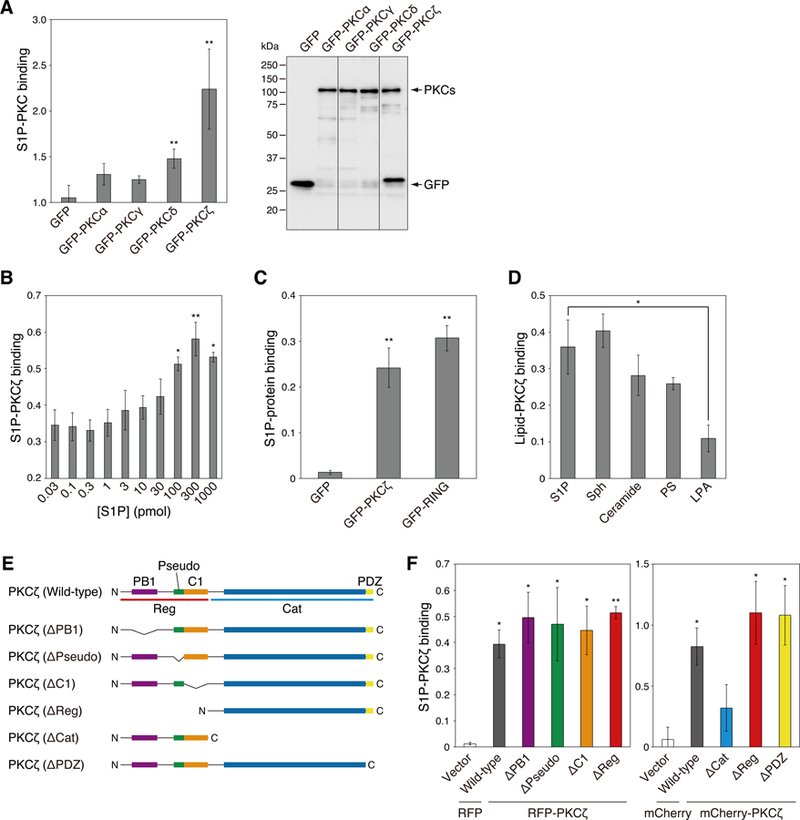
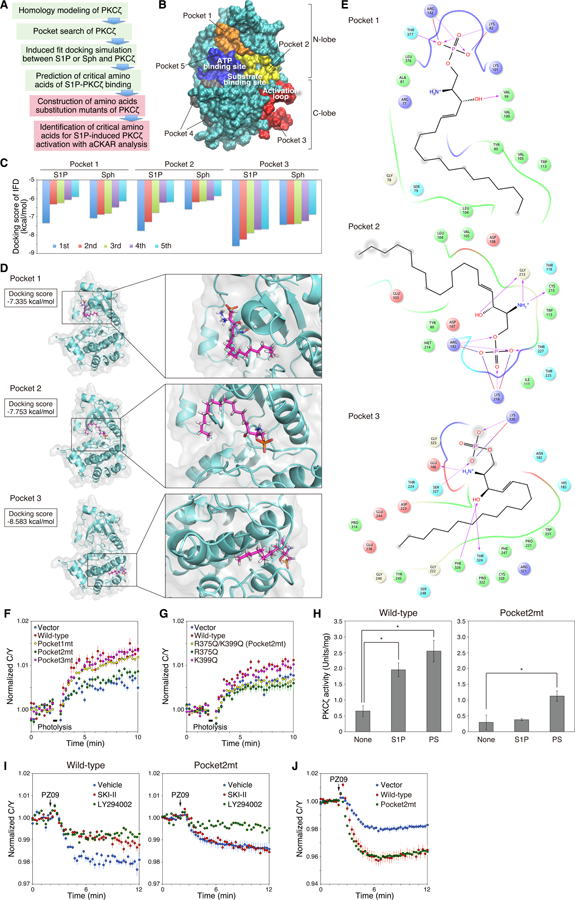
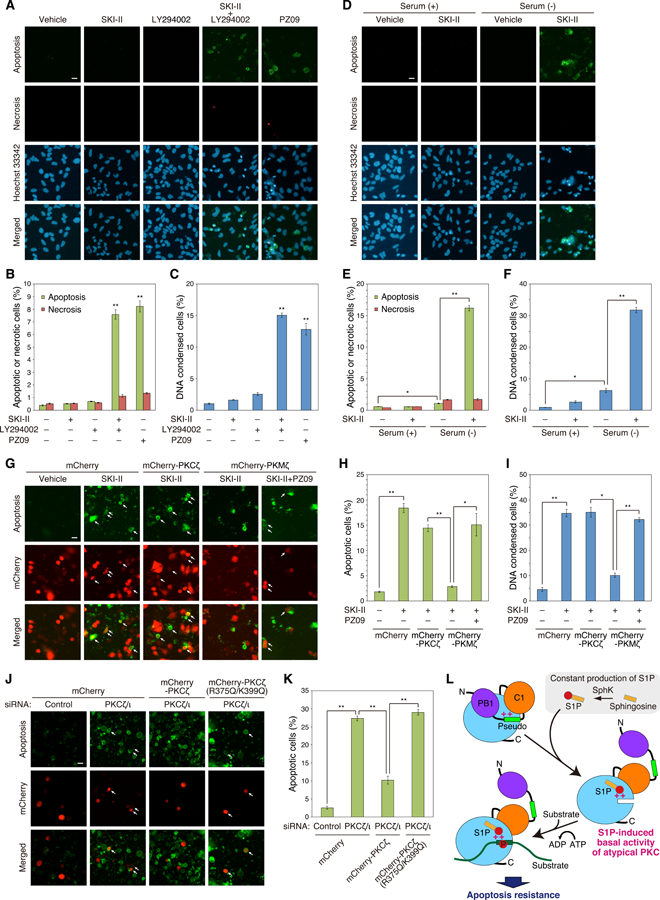
Atypical protein kinase C (aPKC) isozymes are unique in the PKC superfamily in that they are not regulated by the lipid second messenger diacylglycerol, which has led to speculation about whether a different second messenger acutely controls their function. Here, using a genetically encoded reporter that we designed, aPKC-specific C kinase activity reporter (aCKAR), we found that the lipid mediator sphingosine 1-phosphate (S1P) promoted the cellular activity of aPKC. Intracellular S1P directly bound to the purified kinase domain of aPKC and relieved autoinhibitory constraints, thereby activating the kinase. In silico studies identified potential binding sites on the kinase domain, one of which was validated biochemically. In HeLa cells, S1P-dependent activation of aPKC suppressed apoptosis. Together, our findings identify a previously undescribed molecular mechanism of aPKC regulation, a molecular target for S1P in cell survival regulation, and a tool to further explore the biochemical and biological functions of aPKC.


Conflict of interest statement

Competing interests: The authors declare that they have no competing interests.

Figures

Fig. 1
Fig. 1. Development of an aPKC-selective activity reporter (aCKAR).
(A) The architecture of aCKAR is based on that of the pan-PKC reporter, CKAR, and consists of monomeric CFP (cyan), the FHA2 domain of Rad53p (blue), an aPKC-selective substrate peptide (red), and monomeric YFP (yellow). In the unphosphorylated state, monomeric CFP and monomeric YFP are in proximity and in an orientation resulting in FRET. Once phosphorylated by aPKC at the threonine within the substrate sequence (highlighted in yellow), the FHA2 domain binds the phosphorylated sequence, resulting in a conformational change that alters the FRET ratio. Isoleucine at the P+3 position (highlighted in green) is critical for the binding of phospho-threonine to the FHA2 domain. The substrate peptide of CKAR was replaced with an aPKC-selective substrate peptide with a sequence corresponding to residues 74 to 87 of IRAP (rat insulin-regulated membrane aminopeptidase (U76997)), except Ser80 at the phospho-acceptor was replaced with Thr (yellow) and the Asn at the P+3 position was replaced with Ile (green). (B) COS7 cells were co-transfected with aCKAR (left panel) or CKAR (right panel) and mCherry (Vector) or mCherry-PKMζ. The CFP/YFP FRET (C/Y) emission ratio was quantified as a function of time following the addition of PZ09 (5 µM). The drop in FRET upon addition of inhibitor represents the basal (unstimulated) activity of endogenous aPKC (blue); the additional drop in cells overexpressing PKMζ (red) reflects the basal activity of PKMζ. Data represent the C/Y emission ratio normalized to the starting point (1.0) with means ± S.E. (n ≥ 25 cells). (C) As in (B), except that cells were co-transfected with the indicated reporters and either RFP or RFP tagged to a construct of the catalytic domain of PKCλ (RFP-PKCλ(Cat)). Data represent the means ± S.E. (n ≥ 21 cells). (D) COS7 cells were co-transfected with aCKAR (left panel) or CKAR (right panel) and mCherry, mCherry-PKCα, mCherry-PKCβII, mCherry-PKCδ, or mCherry-PKCε. The normalized C/Y emission ratio was quantified as a function of time following the addition of PDBu (200 nM). The increase in FRET represents the agonist-induced activity of these PKC isozymes. Data represent the means ± S.E. (n ≥ 16 cells for left panel, n ≥ 21 cells for right panel). (E) Knockdown of endogenous expression of PKCζ and PKCι in HeLa cells using siRNAs for human PKCζ and PKCι. HeLa cells were transfected for 48 h with non-targeting control siRNA, human PKCζ siRNA, or human PKCι siRNA individually. Equal aliquots of lysate were blotted and probed with anti-PKCζ or anti-PKCι antibody and with anti-actin antibody as a protein loading control. (F) HeLa cells were co-transfected with aCKAR and control siRNA or both PKCζ siRNA and PKCι siRNAs. The normalized C/Y emission ratio was quantified as a function of time following the addition of PZ09 (5 µM). Data represent the means ± S.E. (n ≥ 21 cells). (G) COS7 cells were co-transfected with aCKAR or a construct in which the phospho-acceptor site is mutated to Ala (aCKAR (T/A)) and mCherry or mCherry-PKMζ. The normalized C/Y emission ratio was quantified as a function of time following the addition of PZ09 (5 µM). Data represent the means ± S.E. (n ≥ 28 cells). (H) COS7 cells were transfected with aCKAR or the PKA reporter, AKAR. The normalized C/Y emission ratio was quantified as a function of time following the addition of forskolin (10 µM) to elevate cAMP. Data represent the means ± S.E. (n ≥ 28 cells). (I) COS7 cells were co-transfected with aCKAR or the Akt/PKB reporter, BKAR, and mCherry-Akt1. The normalized C/Y emission ratio was quantified as a function of time following the addition of EGF (50 ng/ml) to activate Akt/PKB. Data represent the means ± S.E. (n ≥ 28 cells). (J) COS7 cells were co-transfected with aCKAR or the PKD reporter, DKAR, and mCherry-PKD1. The C/Y normalized emission ratio was quantified as a function of time following the addition of PDBu (200 nM) to activate PKD (and PKC, which does not phosphorylate this reporter). Data represent the means ± S.E. (n ≥ 25 cells).
Fig. 2
Fig. 2. Basal activity of aPKC is regulated by S1P signaling.
(A) COS7, HEK293, HeLa, HepG2, MCF7, MDA-MB-231, or SH-SY5Y cells were transfected with aCKAR. The basal activity of endogenous aPKC was measured following the addition of PZ09 (5 µM); DMSO vehicle was added as a control. The normalized C/Y emission ratio was quantified as a function of time following the addition of PZ09. Data represent the means ± S.E. (n ≥ 20 cells). The arrow indicates the point of DMSO vehicle or PZ09 addition. (B) The relative basal activity of endogenous aPKC was quantified from the data in (A) and represents the difference between the C/Y emission ratios summed between minutes 10–12 for the vehicle vs PZ09 treatments. (C) Western blot of lysates from 2.0 × 10⁵ cells of the indicated cell lines probed with antibodies to PKCζ or PKCι. The endogenous expression level of beta-actin was also detected using an anti-β-actin antibody. (D) Normalized expression level of PKCζ (left panel) or PKCι (right panel) was quantified from the result of (C) and represents the intensity of PKC divided by the intensity of β-actin for each cell type. (E) HeLa cells were transfected with aCKAR and pre-treated for 16 h with DMSO vehicle, LY294002 (20 μM), SKI-II (5 μM), or LY294002 (20 μM) + SKI-II (5 μM). These cells were subsequently stimulated with DMSO vehicle or 5 μM PZ09 (addition indicated by arrow) to assess the effect of these pre-treatments on basal aPKC activity. The normalized C/Y emission ratio was quantified as a function of time. Data represent the means ± S.E. (n ≥ 22 cells). For graph legend: pre-treatment with vehicle, SKI-II, or LY294002 → treatment with vehicle or PZ09 performed at the time point indicated by the arrow. (F) As in (E), except experiments were conducted in serum-free media. Data represent the means ± S.E. (n ≥ 22 cells). For graph legend: pre-treatment with vehicle, SKI-II, or LY294002 → treatment with vehicle or PZ09 performed at the time point indicated by the arrow. (G) HeLa cells were co-transfected with CKAR fused to the PB1 domain of Par6 (CKAR-PB1Par6) (left panel) or CKAR (right panel) and mCherry (Vector) or mCherry-PKCζ (PKCζ). Cells were pre-treated with DMSO vehicle or SKI-II (5 μM) for 16 h, and then treated with 5 μM PZ09. The normalized C/Y emission ratio was quantified as a function of time. Data represent the means ± S.E. (n ≥ 22 cells). (H) As in (G), except cells were transfected with mCherry-PKCζ (PB1 deletion mutant) (PKCζ(ΔPB1)) where indicated. Data represent the means ± S.E. (n ≥ 17 cells).
Fig. 3
Fig. 3. Basal activity of aPKC is regulated by intracellular S1P.
(A) HeLa cells were transfected with aCKAR and then pre-treated with DMSO vehicle or 5 µM SKI-II for 16 h; these cells were then loaded with 1 µM caged S1P (C-S1P) for 30 min, washed of extracellular caged S1P, exposed to ultraviolet light as described in methods, and incubated for another 5 min after photolysis (+ hν). Cells were subsequently treated with DMSO vehicle or 5 µM PZ09 to measure basal activity of endogenous aPKC. The normalized C/Y emission ratio was quantified as a function of time following DMSO vehicle or PZ09 treatment. Data represent the means ± S.E. (n ≥ 27 cells). The arrow indicates the point of DMSO vehicle or PZ09 addition. For graph legend: pre-treatment with vehicle, SKI-II, or caged S1P → treatment with vehicle or PZ09 performed at the time point indicated by the arrow. (B) Knockdown of endogenous expression of SphK1 and SphK2 in HeLa cells using siRNAs for human SphK1 and SphK2. HeLa cells were transfected for 48 h with non-targeting control siRNA, human SphK1 siRNA, or human SphK2 siRNA individually. Relative mRNA expression levels of SPHK1 and SPHK2 in HeLa cells were analyzed by real-time quantitative PCR (RT-qPCR). Data represent the means ± S.E. from at least three independent experiments. (C) HeLa cells were co-transfected with aCKAR and control siRNA, SphK1 siRNA, SphK2 siRNA, or both SphK1 siRNA and SphK2 siRNAs. The normalized C/Y emission ratio was quantified as a function of time following the addition of PZ09 (5 µM). Data represent the means ± S.E. (n ≥ 20 cells). (D) HeLa cells were co-transfected with aCKAR and control siRNA (Control) or both SphK1 siRNA and SphK2 siRNAs (SphK1/2). They were then loaded with 1 µM caged S1P (C-S1P) for 30 min, washed of extracellular caged S1P, exposed to ultraviolet light as described in Methods, and incubated for another 5 min after photolysis (+hν). Cells were subsequently treated with DMSO vehicle or 5 µM PZ09 to measure basal activity of endogenous aPKC. The normalized C/Y emission ratio was quantified as a function of time following DMSO vehicle or PZ09 treatment. Data represent the means ± S.E. (n ≥ 57 cells). The arrow indicates the point of DMSO vehicle or PZ09 addition. For graph legend: transfection of control siRNA or SphK1 and SphK2 siRNAs → pre-treatment with caged S1P → treatment with vehicle or PZ09 performed at the time point indicated by the arrow. (E) HeLa cells were transfected with aCKAR. Cells were then loaded with 1 µM caged S1P for 30 min, washed of extracellular caged S1P, and pre-treated with 10 µM VPC23019 for 5 min before live-cell imaging. Cells were then photolysed to detect intracellular S1P-induced activation of endogenous aPKC, and then stimulated with 5 µM PZ09. The normalized C/Y emission ratio was quantified as a function of time following photolysis. Data represent the means ± S.E. (n ≥ 37 cells). (F) mRNA expression levels of S1PR1, S1PR2, S1PR3, S1PR4, and S1PR5 in HeLa cells were analyzed by real-time quantitative PCR (RT-qPCR). mRNA values for the S1P receptors were normalized to GAPDH. Data represent the means ± S.E. from at least three independent experiments. (G) HeLa cells were transfected with aCKAR and then pre-treated with or without 10 µM VPC23019 (VPC) for 5 min before live-cell imaging. Cells were stimulated with DMSO vehicle, 100 nM S1P, or 10 µM S1P during live-cell imaging and then treated with 5 µM PZ09. The normalized C/Y emission ratio was quantified as a function of time following photolysis. Data represent the means ± S.E. (n ≥ 16 cells). For graph legend: pre-treatment with VPC23019 → treatment with S1P performed at the time point indicated by the first arrow.
Fig. 4
Fig. 4. Direct activation of aPKC by S1P.
(A) Effect of S1P on activation of PKCζ assessed by an in vitro kinase assay. Kinase activity of purified GST-PKCζ was measured in the absence or presence of 30 µM S1P at the indicated time points. Data represent means ± S.E. from at least three independent experiments (*P < 0.05, **P < 0.01 for S1P versus vehicle control for each time point). (B) Dose-dependent effects of S1P on activation of PKCζ assessed by an in vitro kinase assay. Kinase activity of purified GST-PKCζ was measured for 60 min in the absence or presence of the indicated concentrations of S1P. Data represent means ± S.E. from at least three independent experiments (*P < 0.05, **P < 0.01 for S1P versus vehicle control). (C) Kinase activity of purified GST-PKCζ was measured in the absence or presence of 30 µM S1P or 30 µM S1P + 10 µM PZ09. Data represent means ± S.E. from at least three independent experiments (**P < 0.01). (D) Kinase activity of purified GST-PKCζ was measured in the absence or presence of 30 µM dihydro-S1P (DH-S1P) or 30 µM DH-S1P + 10 µM PZ09. Data represent means ± S.E. from at least three independent experiments (*P < 0.05, **P < 0.01). (E) Kinase activity of purified GST-PKCζ was measured in the absence or presence of 30 µM S1P or 30 µM sphingosine (Sph). Data represent means ± S.E. from at least three independent experiments (**P < 0.01). (F) Kinase activity of purified GST-PKCζ was measured in the presence of Triton X-100 mixed micelles containing 0 – 15 mol% phosphatidylserine (PS) and 0 or 5 mol% S1P. Data represent mean ± S.E. from three independent experiments (*P < 0.05, **P < 0.01 for 5 mol% S1P versus 0 mol% S1P control). (G) Kinase activity of purified GST-PKCζ was measured in the absence or presence of 140 µM phosphatidylserine (PS) with various concentrations of S1P or 10 µM PZ09. Data represent means ± S.E. from at least three independent experiments (**P < 0.01). (H) HeLa cells were co-transfected with CKAR and mCherry-PKCζ or mCherry-PKMζ. Cells were pre-treated with DMSO vehicle or 5 µM SKI-II for 16 h, and then treated with 5 µM PZ09. The normalized C/Y emission ratio was quantified as a function of time following PZ09 treatment. Data represent the means ± S.E. (n ≥ 25 cells).
Fig. 5
Fig. 5. Direct binding of S1P to aPKC.
(A) COS7 cells were transfected with GFP, GFP-PKCα, GFP-PKCγ, GFP-PKCδ, or GFP-PKCζ. S1P-PKC binding ability was measured by a protein-lipid binding assay with nitrobenzoxadiazole (NBD)-labeled S1P (left panel). Data represent means ± S.E. from at least three independent experiments (*P < 0.05 versus GFP vector control). Immunoprecipitated GFP or GFP-PKC were run on SDS-PAGE (right panel). The amount of exogenously expressed GFP or GFP-PKC was detected via western blot analysis using an anti-GFP antibody. (B) The binding affinity of PKCζ for S1P was assessed using the PLO assay. The interactions between purified GST-PKCζ and various concentrations of S1P were detected using an anti-GST antibody. Data represent means ± S.E. from at least three independent experiments (*P < 0.05, **P < 0.01 versus 0.03 pmol S1P). (C) The binding affinity of PKCζ or the RING domain of TRAF2 for S1P was assessed by a PLO assay. The interaction between GFP, GFP-PKCζ, or GFP-tagged RING domain of TRAF2 (GFP-RING) and 30 pmol of S1P was detected using an anti-GST antibody. Data represent means ± S.E. from at least three independent experiments (**P < 0.05 versus GFP vector control). (D) The binding affinity of PKCζ for related lipids was assessed using the PLO assay. The interactions between purified GST-PKCζ and 30 pmol S1P, sphingosine (Sph), C16-ceramide (Ceramide), phosphatidylserine (PS), or lysophosphatidic acid (LPA) were detected using an anti-GST antibody. Data represent means ± S.E. from at least three independent experiments (*P < 0.05). (E) Domain schematic of deletion mutants of PKCζ. Structures of full-length PKCζ and six deletion mutants are shown. PB1: PB1 domain, Pseudo: pseudosubstrate domain, C1: C1 domain, PDZ: PDZ domain, Reg: regulatory domain, Cat: catalytic domain, N: N-terminus, C: C-terminus. (F) The binding affinity of domain deletion mutants of PKCζ for S1P was assessed using the PLO assay. The interactions between RFP- or mCherry-fused full length PKCζ (RFP-PKCζ (wild-type) or mCherry-PKCζ (wild-type)), PB1 deletion mutant (ΔPB1), PS deletion mutant (ΔPseudo), C1 deletion mutant (ΔC1), regulatory domain deletion mutant (ΔReg) (PKMζ), catalytic domain deletion mutant (ΔCat), or PDZ deletion mutant (ΔPDZ) and 30 pmol of S1P were detected using an anti-GST antibody. The S1P-PKCζ binding affinity was compared to the RFP or mCherry vector control. Data represent means ± S.E. from at least three independent experiments (*P < 0.05, **P < 0.01 versus vector control).
Fig. 6
Fig. 6. Identification of critical sites and amino acids for binding of aPKC to S1P.
(A) Flowchart of the strategy for identifying the critical sites and amino acids of PKCζ for S1P binding and S1P-induced activation are shown. 1) Homology modeling of the catalytic domain of PKCζ from the crystal structure of PKCι, 2) A search of potential ligand-binding pockets of PKCζ, 3) Induced-fit docking simulation between S1P or sphingosine (Sph) and catalytic domain of PKCζ, 4) Identification of candidate critical pockets and amino acids for S1P-PKCζ binding, 5) Construction of single amino acid substitution mutants of candidate amino acids of S1P-PKCζ binding, 6) Identification of amino acids that are essential for S1P-PKCζ binding and S1P-induced activation of PKCζ using aCKAR-FRET analysis. The green boxes indicate in silico assay and the red boxes indicate cellular assay. (B) Potential ligand-binding pockets on the surface of the homology model of the catalytic domain of PKCζ predicted using the Schrödinger’s SiteMap algorithm. (C) S1P or sphingosine (Sph) was docked to the center of mass position for pocket 1, pocket 2, or pocket 3 on the catalytic domain of PKCζ using the induced-fit docking protocol in the Schrödinger package. The five lowest docking scores from the induced-fit docking for each pocket are shown in the bar graph (kcal/mol). IFD: induced-fit docking. (D) The induced-fit docking poses of S1P (carbon atoms in pink) to pocket 1, pocket 2, and pocket 3 of the catalytic domain of human PKCζ are shown with corresponding docking scores. These docking poses have the lowest docking score (kcal/mol) in each pocket. (E) Two-dimensional interaction diagram of the S1P-PKCζ binding as in (D). Negatively-charged, positively-charged, polar, hydrophobic, and glycine residues at the active site are represented by red, purple, cyan, green, and white spheres, respectively. Hydrogen bonds between the S1P and backbone or side chains are shown in solid pink arrows or dashed pink arrows, respectively. Salt bridges are shown in red-blue lines. Lys82, Lys101, and Arg142 in the pocket 1 correspond to Lys265, Lys284, and Arg325 of full length PKCζ. Arg192 and Lys216 in the pocket 2 correspond to Arg375 and Lys399 of full length PKCζ. Lys330 in the pocket 3 corresponds to Lys513 of full-length PKCζ. (F) HeLa cells were co-transfected with aCKAR and mCherry (Vector), mCherry-PKCζ (wild-type), mCherry-PKCζ(K265Q/K284Q/R325Q) (mutant for pocket 1; Pocket1mt), mCherry-PKCζ(R375Q/K399Q) (mutant for pocket 2; Pocket2mt), or mCherry-PKCζ(K513Q) (mutant for pocket 3; Pocket3mt). Cells were then loaded with 1 µM caged S1P for 30 min, washed, and pre-treated with 10 µM VPC23019 for 5 min before live-cell imaging. Cells were photolysed to detect intracellular S1P-induced activation of exogenous mCherry-PKCζ. The normalized C/Y emission ratio was quantified as a function of time following photolysis. Data represent the means ± S.E. (n ≥ 27 cells). (G) As in (F), except HeLa cells were co-transfected with aCKAR and mCherry (Vector), mCherry-PKCζ (Wild-type), mCherry-PKCζ(R375Q/K399Q) (Pocket2mt), mCherry-PKCζ(R375Q), or mCherry-PKCζ(K399Q) mutant. Data represent the means ± S.E. (n ≥ 17 cells). (H) Kinase activity of purified GST-PKCζ (Wild-type) or GST-PKCζ(R375Q/K399Q) (Pocket2mt) was measured in the absence or presence of 30 µM S1P or 140 µM phosphatidylserine (PS). Data represent means ± S.E. from at least three independent experiments (*P < 0.05). (I) HeLa cells were co-transfected with aCKAR and mCherry-PKCζ (Wild-type) (left panel) or mCherry-PKCζ(R375Q/K399Q) (Pocket2mt) (right panel). Cells were then pre-treated with DMSO vehicle, 20 µM LY294002, or 5 µM SKI-II for 16 h and then treated with 5 µM PZ09 during live-cell imaging to detect basal activity of exogenous mCherry-PKCζ. The normalized C/Y emission ratio was quantified as a function of time following PZ09 treatment. Data represent the means ± S.E. (n ≥ 25 cells). (J) HeLa cells were co-transfected with CKAR-PB1Par6 and mCherry (Vector), mCherry-PKCζ (Wild-type), or mCherry-PKCζ(R375Q/K399Q) (Pocket2mt). Cells were then treated with 5 µM PZ09 during live-cell imaging to detect basal activity of exogenous mCherry-PKCζ. The normalized C/Y emission ratio was quantified as a function of time following PZ09 treatment. Data represent the mean ± S.E. (n ≥ 16 cells).
Fig. 7
Fig. 7. S1P-induced basal activity of aPKC is involved in apoptosis resistance.
(A) HeLa cells were treated with DMSO vehicle, 5 µM SKI-II, 20 µM LY294002, 5 µM SKI-II+20 µM LY294002, or 5 µM PZ09 for 12 h. Cells were stained with Hoechst 33342, Apopxin Green (for phosphatidylserine exposure (Apoptosis)), and 7-aminoactinomycin D (for loss of plasma integrity (Necrosis)), then observed using fluorescence microscopy. Scale bar, 20 µm. (B) Percentage of the Apopxin Green- or 7-aminoactinomycin D-positive cells was quantified respectively from the results in (A). Data represent means ± S.E. from at least three independent experiments (**P < 0.01 versus vehicle control). (C) HeLa cells were treated with DMSO vehicle, 5 µM SKI-II, 20 µM LY294002, 5 µM SKI-II+20 µM LY294002, or 5 µM PZ09 for 24 h. DNA condensation was observed using Hoechst 33342 staining under fluorescence microscopy, and the percentage of condensed cells was quantified. Data represent means ± S.E. from at least three independent experiments (**P < 0.01 versus vehicle control). (D) HeLa cells were treated with DMSO vehicle or 5 µM SKI-II in the presence or absence of serum for 12 h. Cells were stained with Hoechst 33342, Apopxin Green and 7-aminoactinomycin D, then observed using fluorescence microscopy. Scale bar, 20 µm. (E) Percentage of the Apopxin Green- or 7-aminoactinomycin D-positive cells was quantified respectively from the results in (D). Data represent means ± S.E. from at least three independent experiments (*P < 0.05, **P < 0.01). (F) HeLa cells were treated with DMSO vehicle or 5 µM SKI-II in the presence or absence of serum for 24 h. DNA condensation was observed using Hoechst 33342 staining under fluorescence microscopy, and the percentage of condensed cells was quantified. Data represent means ± S.E. from at least three independent experiments (*P < 0.05, **P < 0.01). (G) HeLa cells were transfected with mCherry (Vector), mCherry-PKCζ, or mCherry-PKMζ. Cells were treated with DMSO vehicle, 5 µM SKI-II, or 5 µM SKI-II + 5 µM PZ09 in serum-free conditions for 12 h. Cells were stained with Apopxin Green, then observed using fluorescence microscopy. Arrows indicate both Apopxin Green- and mCherry-positive cells (apoptotic cells in mCherry-expressed cells). Scale bar, 20 µm. (H) Percentage of the Apopxin Green-positive cells within the population of mCherry-positive cells was quantified from the results in (G). Data represent means ± S.E. from at least three independent experiments (*P < 0.05, **P < 0.01). (I) HeLa cells were transfected with mCherry (Vector), mCherry-PKCζ, or mCherry-PKMζ. Cells were treated with DMSO vehicle, 5 µM SKI-II, or 5 µM SKI-II +5 µM PZ09 in serum-free conditions for 24 h. DNA condensation was observed using Hoechst 33342 staining under fluorescence microscopy, and the percentage of condensed cells was quantified. Data represent means ± S.E. from at least three independent experiments (*P < 0.05, **P < 0.01). (J) HeLa cells were co-transfected with control siRNA or both PKCζ siRNA and PKCι siRNAs and mCherry (Vector), mCherry-PKCζ, or mCherry-PKCζ(R375Q/K399Q). Cells were then serum-starved with serum-free medium for 12 h. Cells were stained with Apopxin Green, then observed using fluorescence microscopy. Arrows indicate both Apopxin Green- and mCherry-positive cells (apoptotic cells in mCherry-expressing cells). Scale bar, 20 µm. (K) Percentage of the Apopxin Green-positive cells within the population of mCherry-positive cells was quantified from the results in (J). Data represent means ± S.E. from at least three independent experiments (**P < 0.01). (L) Model showing mechanism for S1P-mediated activation of aPKC to provide a basal signaling output that suppresses apoptosis. aPKC is autoinhibited by interaction of the pseudosubstrate (Pseudo) with the substrate-binding cavity of the kinase domain (blue circle) (upper left). S1P, constitutively produced from sphingosine by sphingosine kinase (SphK), binds to a pocket with basic amino acids (++), R375 and K399, close to the substrate-binding site in the kinase domain; this interaction displaces the pseudosubstrate to allow substrate binding and down-stream signaling. This S1P-induced basal activitation of aPKC promotes resistance to apoptosis. PB1: Phox and Bem1, P: phosphate, N: N-terminus, C: C-terminus.

Similar articles

Cited by

References

    1. Drummond ML, Prehoda KE, Molecular Control of Atypical Protein Kinase C: Tipping the Balance between Self-Renewal and Differentiation. J Mol Biol 428, 1455–1464 (2016). - PMC - PubMed
    1. Suzuki A, Ohno S, The PAR-aPKC system: lessons in polarity. Journal of cell science 119, 979–987 (2006). - PubMed
    1. Diaz-Meco MT, Moscat J, The atypical PKCs in inflammation: NF-kappaB and beyond. Immunol Rev 246, 154–167 (2012). - PMC - PubMed
    1. Newton AC, Brognard J, Reversing the Paradigm: Protein Kinase C as a Tumor Suppressor. Trends in pharmacological sciences 38, 438–447 (2017). - PMC - PubMed
    1. Parker PJ, Justilien V, Riou P, Linch M, Fields AP, Atypical protein kinase Ciota as a human oncogene and therapeutic target. Biochemical pharmacology 88, 1–11 (2014). - PMC - PubMed

Publication types

MeSH terms