. 2019 Jan 29;7(2):657-668.
doi: 10.1039/c8bm01224e.

Celastrol-loaded PEG-b-PPS nanocarriers as an anti-inflammatory treatment for atherosclerosis

Affiliations

Celastrol-loaded PEG-b-PPS nanocarriers as an anti-inflammatory treatment for atherosclerosis

Sean D Allen et al. Biomater Sci. .

Abstract

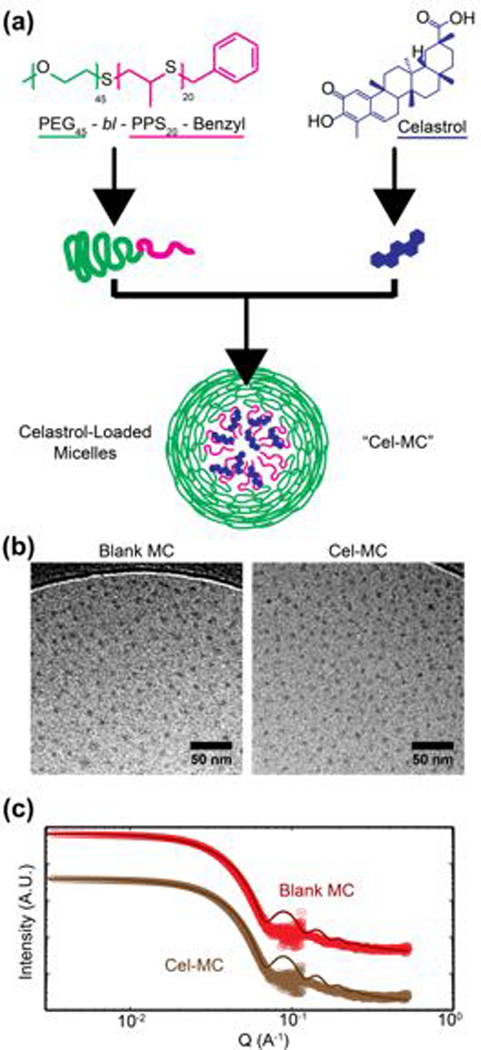
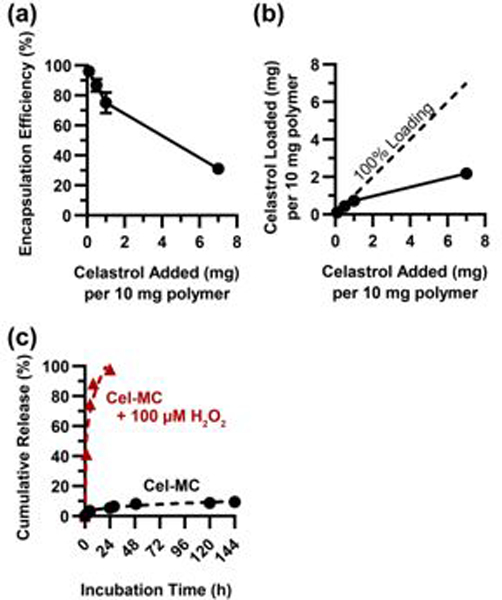
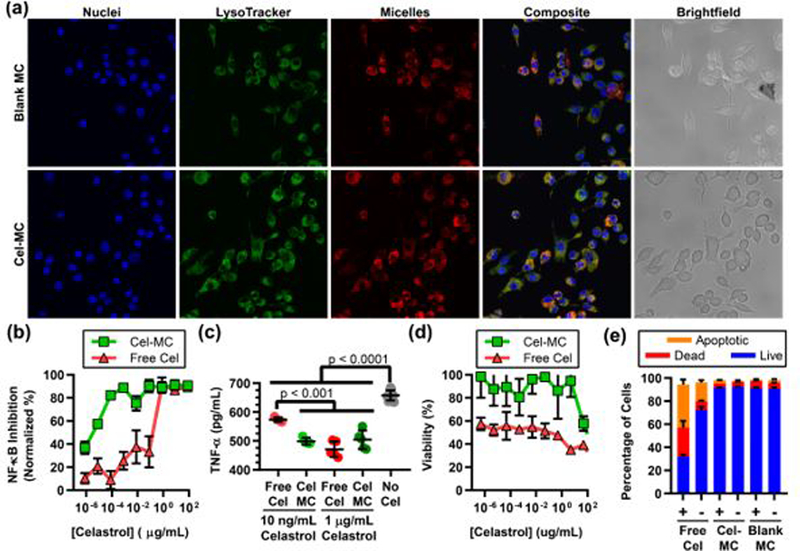
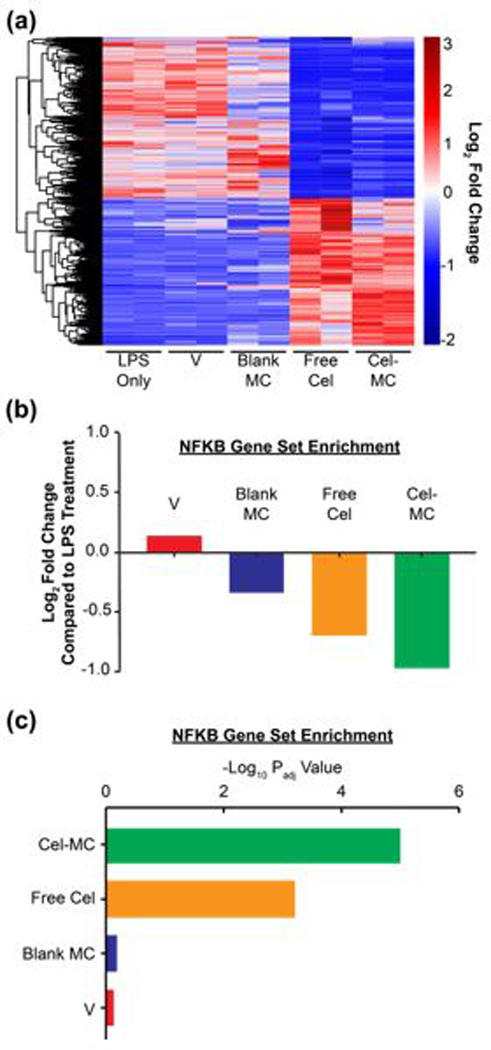
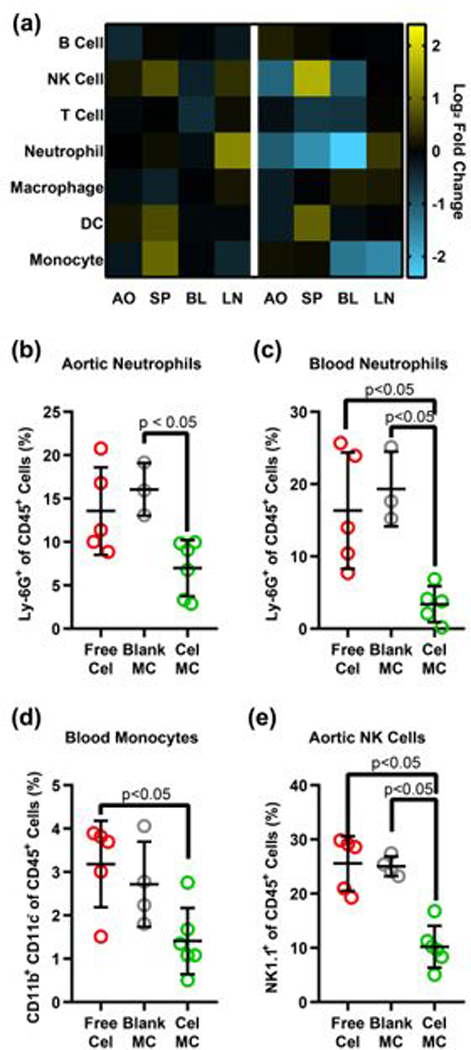
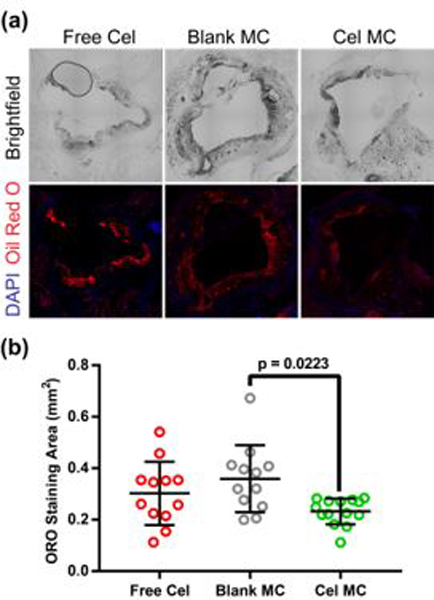
In this work, the hydrophobic small molecule NF-κB inhibitor celastrol was loaded into poly(ethylene glycol)-b-poly(propylene sulfide) (PEG-b-PPS) micelles. PEG-b-PPS micelles demonstrated high loading efficiency, low polydispersity, and no morphological changes upon loading with celastrol. Encapsulation of celastrol within these nanocarriers significantly reduced cytotoxicity compared to free celastrol, while simultaneously expanding the lower concentration range for effective inhibition of NF-κB signaling by nearly 50 000-fold. Furthermore, celastrol-loaded micelles successfully reduced TNF-α secretion after LPS stimulation of RAW 264.7 cells and reduced the number of neutrophils and inflammatory monocytes within atherosclerotic plaques of ldlr-/- mice. This reduction in inflammatory cells was matched by a reduction in plaque area, suggesting that celastrol-loaded nanocarriers may serve as an anti-inflammatory treatment for atherosclerosis.


Conflict of interest statement

Conflicts of interest

There are no conflicts to declare.

Figures

Fig. 1.
Fig. 1.. Size and morphological characterization of Blank MC and Cel-MC.
(a) Schematic of polymer and celastrol chemical structures and a cartoon figure of an assembled micelle loaded with celastrol. (b) Cryogenic transmission electron micrographs of Blank MC and Cel-MC, scale bars = 50 nm. (c) Small angle x-ray scattering transformed data and polymer micelle model fits. Graphs are vertically offset for ease of visualization.
Fig. 2.
Fig. 2.. Encapsulation efficiency, loading capacity, and release of celastrol from micelles.
(a) Encapsulation efficiency of celastrol in micelles when loaded at different starting amounts of celastrol. ‘Celastrol Added’ represents the amount of celastrol initially available to be loaded into 10 mg of polymer. All data points on graph, n=3. (b) Loading capacity of celastrol in micelles. ‘Celastrol Added’ and ‘Celastrol Loaded’ represent the amount of celastrol initially available to be loaded into micelles and the amount of celastrol actually loaded into micelles, respectively, per 10 mg of polymer. All data points on graph, n=3. (c) Cumulative release of celastrol from celastrol micelles into 1xPBS. Average values plotted on graph, error bars (S.D.) not visible due to low variability compared to y-axis scale, n=3.
Fig. 3.
Fig. 3.. Subcellular localization, NF-κB inhibition, and cytotoxicity of Cel-MC in RAW 264.7 cells.
(a) Confocal images of live RAW 264.7 cells incubated with a nuclear stain (blue) and a lysosomal stain (green). Cells were also incubated overnight with blank MC (top row) or Cel-MC (1 μg/mL celastrol, bottom row) labelled with DiI, a lipophilic dye. Composite and brightfield images are included to demonstrate colocalization of micelle and lysosome signal and cell morphology, respectively. (b) RAW Blue colorimetric assay of NF-κB expression at varying concentrations of celastrol. Y-axis is normalized such that 0% represents cells untreated with LPS and 100% represents cells treated with LPS but not treated with any celastrol. X-axis is on a log scale. n=4 (c) ELISA results for TNF-α secretion by RAW 264.7 cells treated with LPS and either free celastrol or Cel-MC. Celastrol treatments were at 10 ng/mL or 1 μg/mL concentrations. All data points shown on graph, n = 5 for treatment conditions, n = 12 for the LPS control. P values shown on graph are from Tukey’s multiple comparison test. (d) RAW 264.7 cell viability with either free celastrol or Cel-MC treatment at varying concentrations of celastrol. Y-axis represents viability normalized by delivery vehicle or formulation, with 100% representing the mean viability of cells treated with vehicle but no celastrol, and 0% representing methanol-treated cells. X-axis is on a log scale. n = 4. (e) Stacked bar graph of RAW 264.7 viability split into three categories: live, dead, or apoptotic. Cells were either LPS treated (+) or not (−). n = 5 for each treatment group. For (b)-(e), error bars represent standard deviation.
Fig. 4.
Fig. 4.. RNAseq analysis of transcriptional effects of free celastrol and Cel-MC treatment of LPS-stimulated RAW 264.7 cells.
Free celastrol and Cel-MC have similar anti-inflammatory effects on the transcriptomes of LPS-treated RAW 264.7 cells. (a) Heatmap analysis of genes significantly affected by free celastrol. DE-Seq2 analysis identified 2649 genes significantly altered by free celastrol treatment of LPS-treated RAW 264.7 cells after 2 hours. Adjusted P-value (Padj)<0.1. This gene set was used to generate a heatmap with the following conditions: LPS-treated RAW 264.7 cells (LPS), LPS + celastrol vehicle (V), LPS + blank micelles (Blank MC), LPS + free celastrol (Free Cel), and LPS + Cel-MC (Cel-MC). Red and blue colors respectively represent genes that are overexpressed and underexpressed in that sample compared to the other cohorts. (b) Fold Change and (c) Padj of the NF-κB gene set. Gene set variation analysis of the NF-κB pathway (Hinata NF-κB Matrix Gene Set) in LPS-treated RAW 264.7 cells treated for 2 hours with vehicle (V), blank MC, free celastrol, or Cel-MC. Fold change is relative to RAW 264.7 cells treated with only LPS.
Fig. 5.
Fig. 5.. Flow cytometric analysis of changes in cell populations in ldlr−/− mice treated with free celastrol or Cel-MC.
(a) Heatmap of fold change in cell populations. Each row represents an immune cell population, each column represents the organ from which the cells were isolated. Heatmap is on a log2 scale, with yellow representing a fold increase and blue representing a fold decrease in that cell population, compared to the Blank MC control. Cell population as a percent of all immune cells for a given population in a given organ are also provided for: (b) aortic neutrophils, (c) aortic NK cells, (d) blood monocytes, and (e) blood neutrophils. All significant p-values are displayed on their graphs, calculated using Dunn’s multiple comparisons test. Cells were identified as follows: B cells – CD45+ CD19+, NK cells – CD45+ NK1.1+, T cells – CD45+ CD3+, Neutrophils – CD45+ Ly-6G+, Macrophages – CD45+ CD3- NK1.1- CD19- Ly-6G- F4/80+, Dendritic cells – CD45+ CD3- NK1.1- CD19- Ly-6G- F4/80- CD11c+, Monocytes – CD45+ CD3- NK1.1- CD19- Ly-6G- F4/80- CD11c- CD11b+ Ly-6C+.
Fig. 6.
Fig. 6.. Oil Red O (ORO) analysis of plaque area in ldlr−/− mice treated with free celastrol or Cel-MC.
(a) Representative fluorescence microscopy images of ORO stained, frozen aorta sections from free celastrol, blank MC or Cel-MC treated ldlr−/− mice. Top images represent brightfield microscopy, while bottom images were obtained with fluorescence microscopy of DAPI-stained nuclei (blue) and lipid-rich plaques (red). All images were acquired at 20x magnification. (b) Quantification of ORO staining area for free celastrol, Blank MC, and Cel MC treated aorta sections. P-value was calculated using Dunn’s multiple comparisons test. Data points represent imaged sections from discrete portions along the length of the aorta, all data points shown on graph. Bars represent the mean and standard deviation, n = 12 for free celastrol, n = 11 for Blank MC, and n = 14 for Cel-MC.

Similar articles

Cited by

References

    1. Rafieian-Kopaei M, Setorki M, Doudi M, Baradaran A and Nasri H, Int J Prev Med, 2014, 5, 927–946. - PMC - PubMed
    1. Chaabane C, Coen M and Bochaton-Piallat ML, Curr Opin Lipidol, 2014, 25, 374–379. - PubMed
    1. Allahverdian S, Pannu PS and Francis GA, Cardiovasc Res, 2012, 95, 165–172. - PubMed
    1. Wang X, Collins HL, Ranalletta M, Fuki IV, Billheimer JT, Rothblat GH, Tall AR and Rader DJ, J Clin Invest, 2007, 117, 2216–2224. - PMC - PubMed
    1. Brown MS and Goldstein JL, Annu Rev Biochem, 1983, 52, 223–261. - PubMed

MeSH terms