. 2019 Feb 1;157(2):135-148.
doi: 10.1530/REP-18-0115.

In vitro and in vivo mouse follicle development in ovaries and reaggregated ovaries

Affiliations

In vitro and in vivo mouse follicle development in ovaries and reaggregated ovaries

Belinda K M Lo et al. Reproduction. .

Abstract

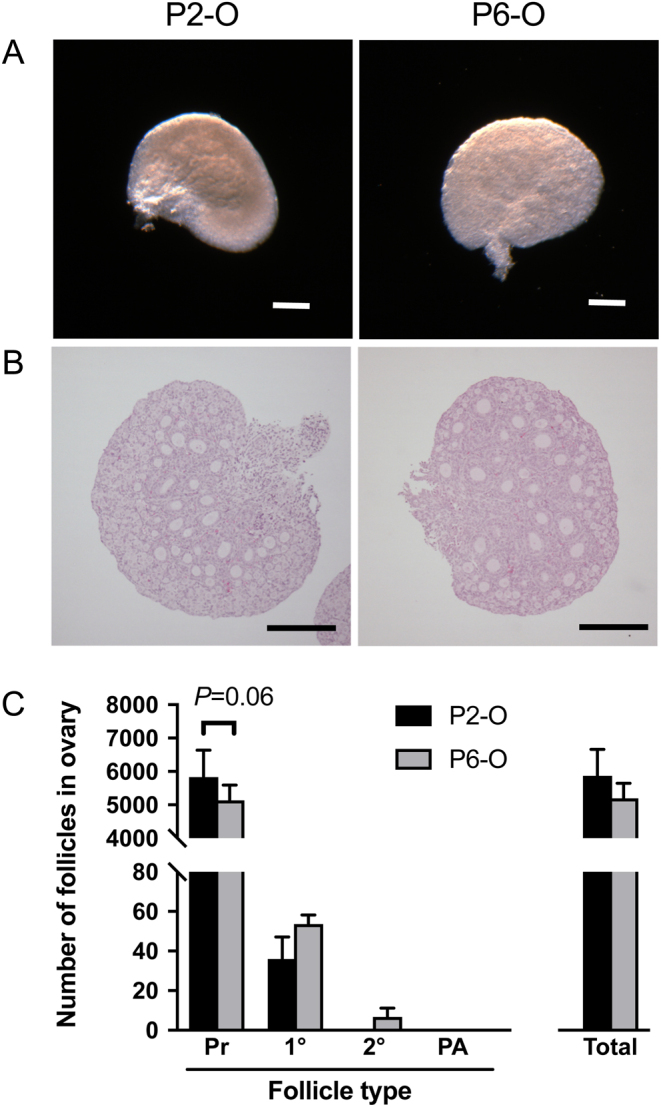
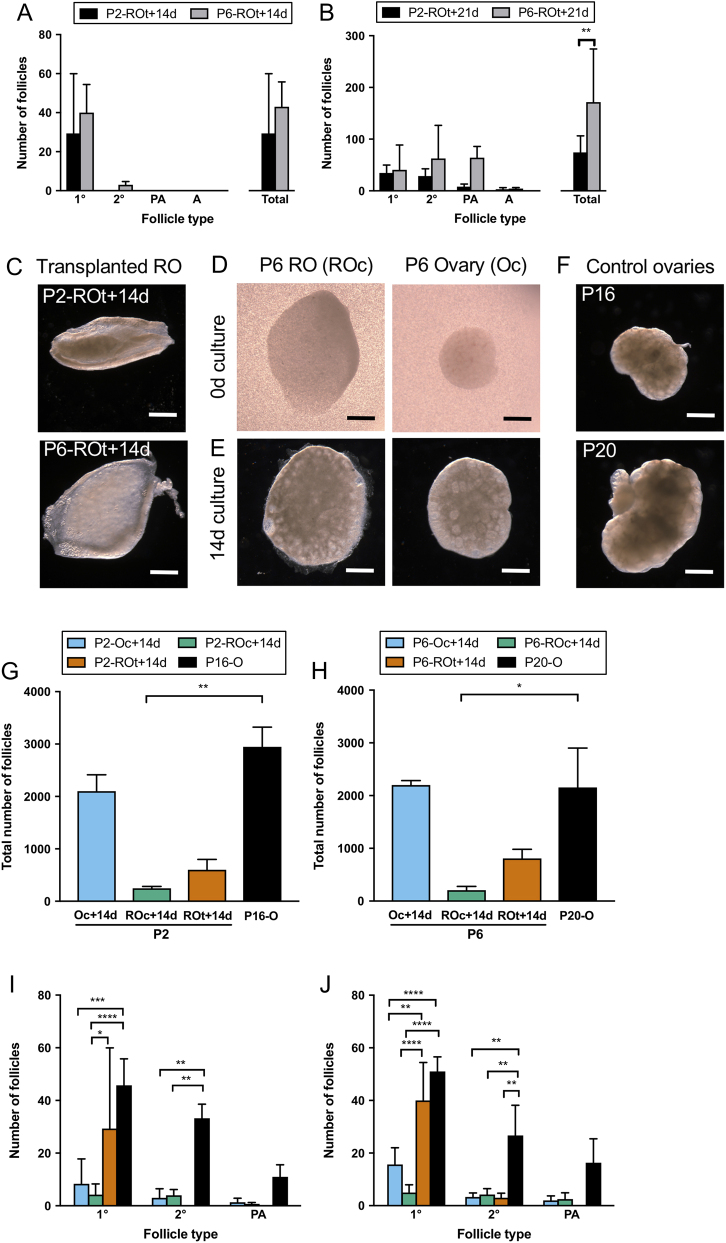
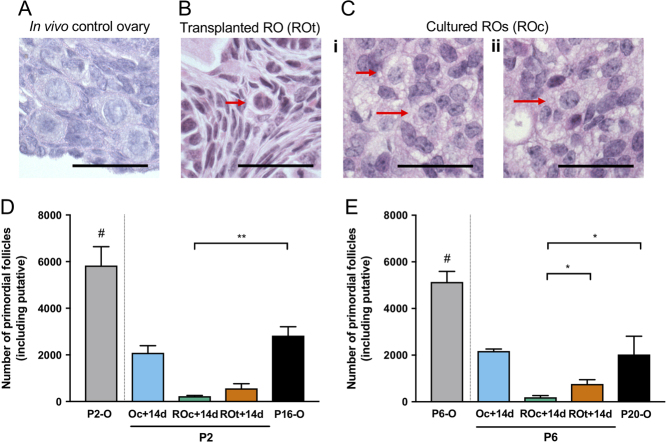
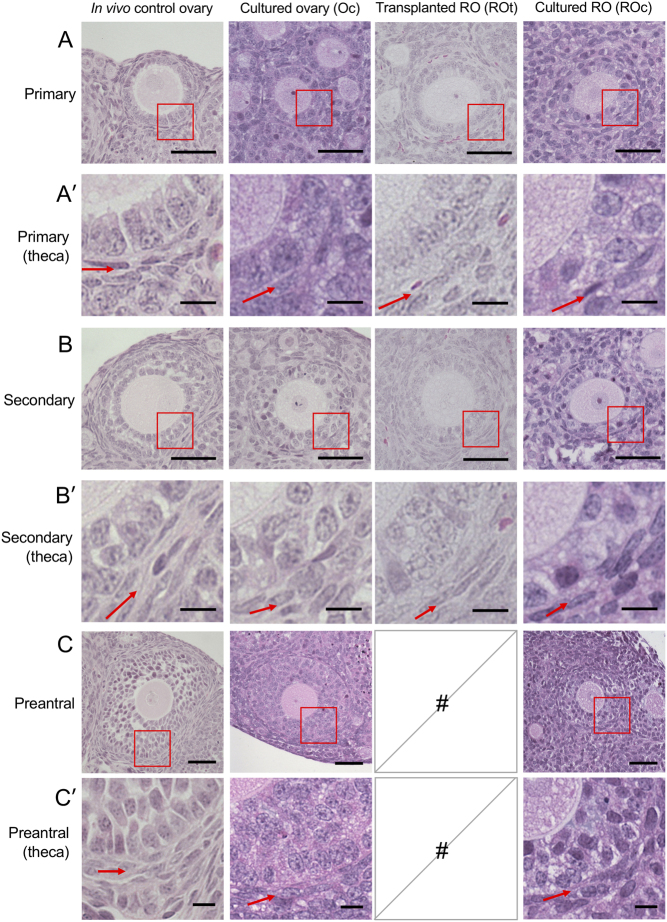
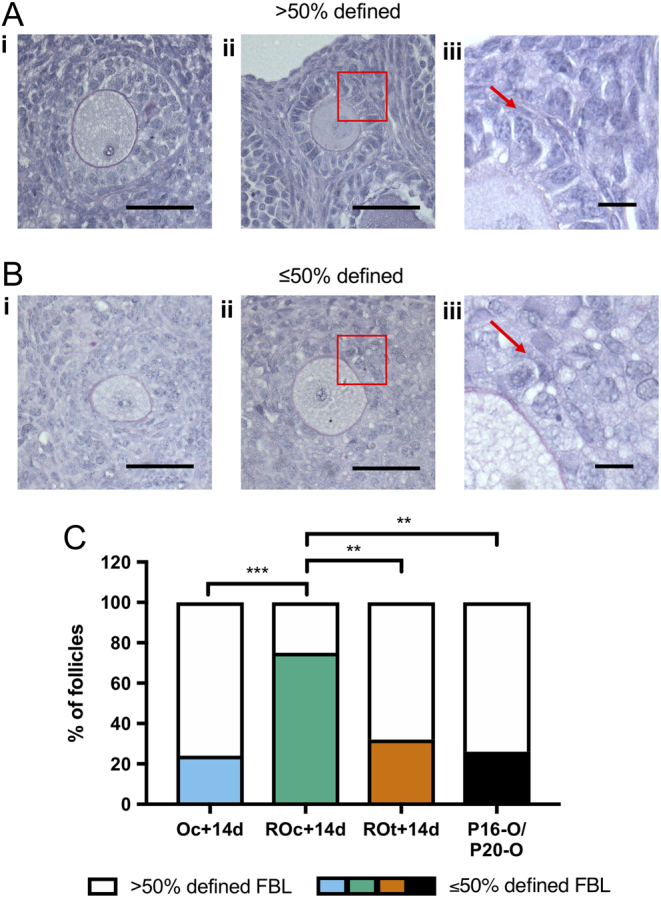
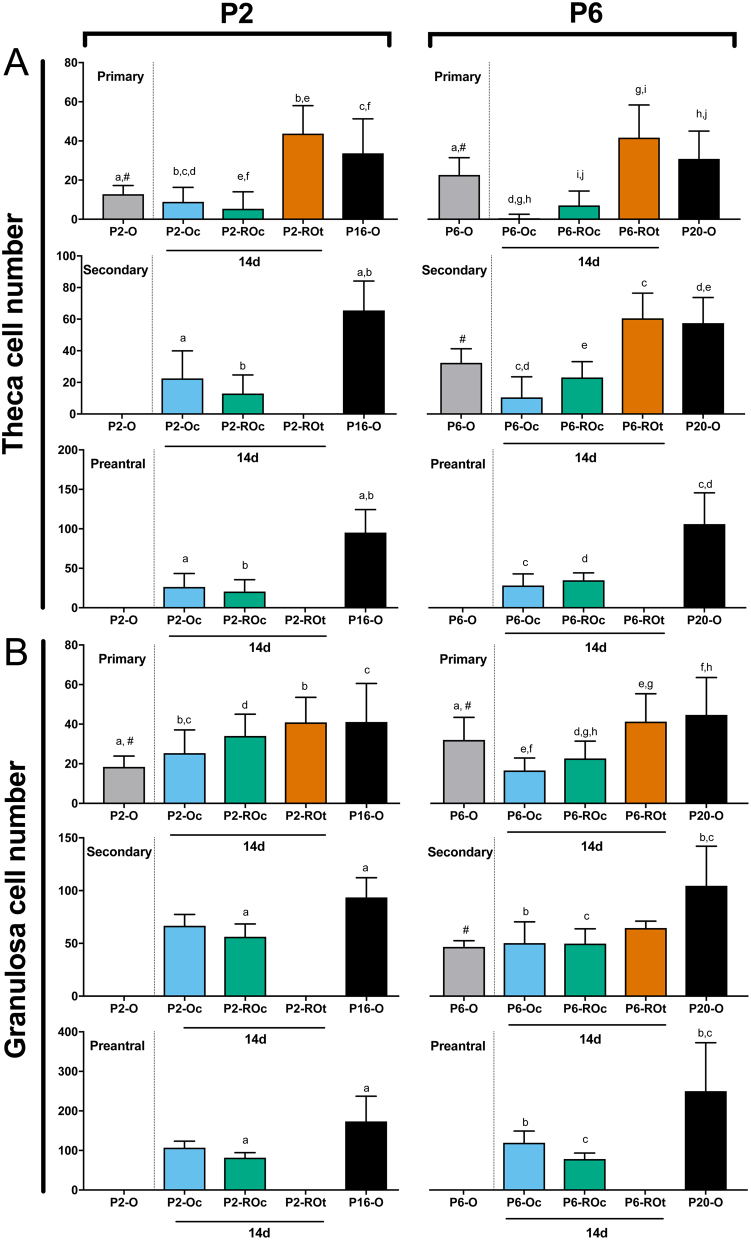
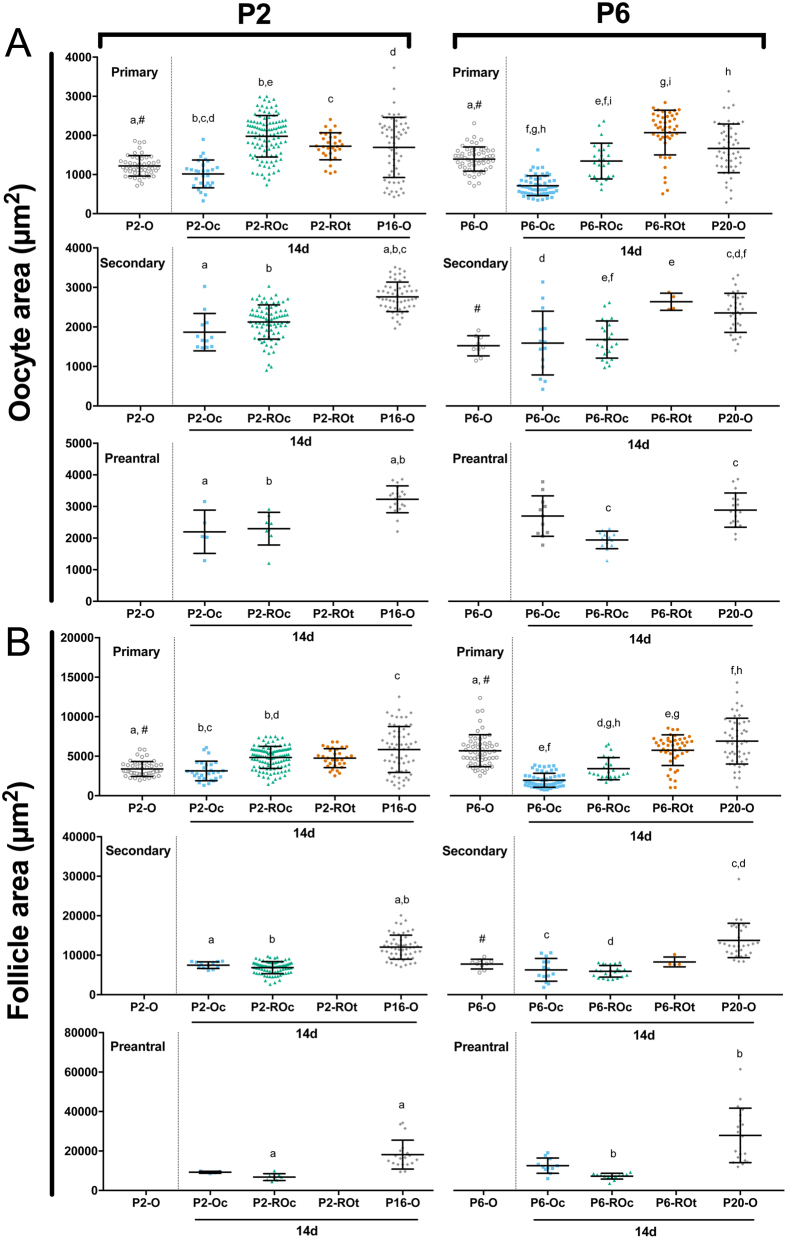
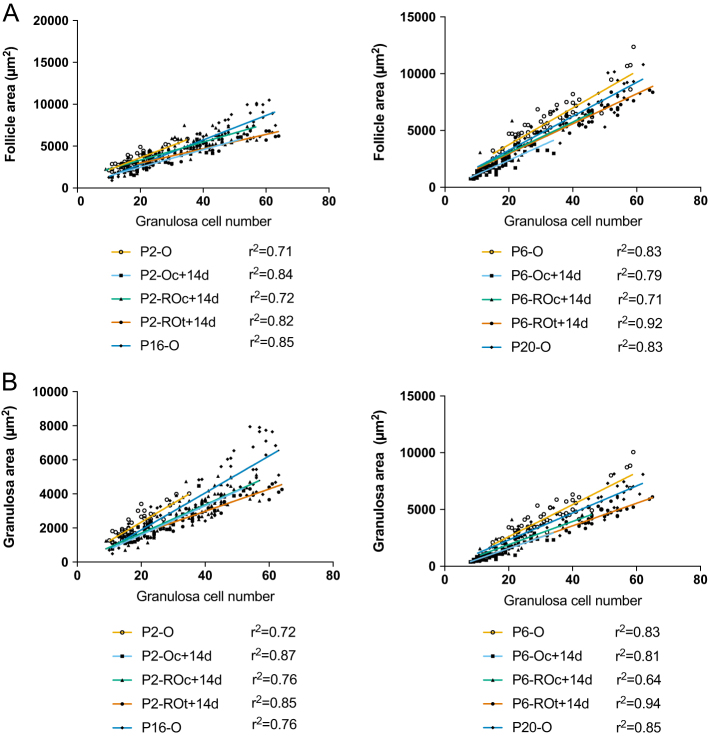
Follicle development requires complex and coordinated interactions between both the oocyte and its associated somatic cells. In ovarian dysfunction, follicle development may be abnormal due to defective somatic cell function; for example, premature ovarian insufficiency or malignancies. Replacing defective somatic cells, using the reaggregated ovary (RO) technique, may 'rescue' follicle development. ROs containing mature follicles have been generated when transplanted to a host mouse to develop. We have developed a RO culture technique and the aims were to determine how follicle development differed between transplanted and cultured ROs, and the influence of ovarian age (P2 vs P6). Mouse ROs were cultured for 14 days; P2 and P6 ovaries cultured as Controls. Follicle development was compared to ROs transplanted for 14 days and ovaries from P16 and P20 mice. ROs generated from either P2 or P6 exhibited similar follicle development in culture whereas in vivo follicle development was more advanced in P6 ROs. Follicles were more developed in cultured ROs than transplanted ROs. However, follicles in cultured ROs and ovaries had smaller oocytes with fewer theca and granulosa cells than in vivo counterparts. Our results demonstrate the fluidity of follicle development despite ovary dissociation and that environment is more important to basal lamina formation and theca cell development. Furthermore, follicle development within cultured ROs appears to be independent of oocyte nest breakdown and primordial follicle formation in source ovaries. Our results highlight the need for understanding follicle development in vitro, particularly in the development of the RO technique as a potential fertility treatment.


Conflict of interest statement

Suzannah Williams is a member of the Editorial Board of Reproduction. The other authors declare no conflict of interest that could be perceived as prejudicing the impartiality of the research reported.

Figures

Figure 1
Figure 1
Follicle development in neonatal ovaries. Representative images of (A) neonatal ovaries and (B) central sections stained with haematoxylin and eosin. (C) The number of follicles at each stage of development and the total number of follicles were assessed in neonatal P2 and P6 ovaries. Pr, primordial follicles; 1°, primary follicles; 2°, secondary follicles; PA, preantral follicles. Scale bar: 200 µm. Data are plotted as mean ± s.d. P2-O n = 4; P6-O n = 3.
Figure 2
Figure 2
Follicle development in cultured ovaries, cultured reaggregated ovaries, transplanted reaggregated ovaries and age-matched in vivo ovaries. Follicle development (follicle stages and total number of developing follicles) in P2 or P6 reaggregated ovaries (ROs) which have been transplanted for (A) 14 days (P2-ROt + 14d and P6-ROt + 14d) and (B) 21 days (P2-ROt + 21d and P6-ROt + 21d) was assessed. Representative images of (C) ROs generated from P2 and P6 ovaries after 14 days of transplantation, (D) ROs and ovaries prior to culture and (E) after 14 days of culture and (F) in vivo Control ovaries. (G) Total number of follicles in P2 ovaries (P2-Oc + 14d) and P2 ROs (P2-ROc + 14d) cultured for 14 days, P2 ROs transplanted for 14 days (P2-ROt + 14d) and the age-matched in vivo control of P16 ovaries (P16-O) and (H) their equivalent in P6 ovaries and ROs (P6 + Oc + 14d, P6-ROc + 14d, P6-ROt + 14d, P20-O). The total number of follicles for the cultured and transplanted ROs includes putative primordial follicles. (I and J) Follicle development was assessed within these matched P2 and P6 groups. 1°, primary follicles; 2°, secondary follicles; PA, preantral follicles. Scale bar: 500 µm. Data are plotted as mean values ± s.d. P2-Oc + 14d n = 3; P2-ROc + 14d n = 5; P2-ROt + 14d n = 3; P2-ROt + 21d n = 3; P16-O n = 4; P6-Oc + 14d n = 3; P6-ROc + 14d n = 4; P6-ROt + 14d n = 3; P6-ROt + 21d n = 3; P20-O n = 3. *P ≤ 0.05; **P ≤ 0.01; ***P ≤ 0.001; ****P ≤ 0.0001.
Figure 3
Figure 3
Putative primordial follicles in transplanted and cultured reaggregated ovaries and primordial follicles in age-matched in vivo ovaries. Representative images of primordial follicles in (A) P16/P20 in vivo Control ovaries and putative primordial follicles in (B) reaggregated ovaries transplanted for 14 days (ROt) and (C) reaggregated ovaries cultured for 14 days (ROc) (red arrows indicate putative primordial follicles). (D) Number of primordial follicles in untreated P2 ovaries (P2-O), P2 ovaries cultured for 14 days (P2-Oc + 14d), age-matched in vivo Control of P16 ovaries (P16-O) and putative primordial follicles in P2 ROs (P2-ROc + 14d) cultured for 14 days, P2 ROs transplanted for 14 days (P2-ROt + 14d) and (E) their equivalent in P6 ovaries and ROs (P6-O, P6 + Oc + 14d, P6-ROc + 14d, P6-ROt + 14d, P20-O). #P2-O and P6-O are not compared to the other conditions, as they have not been cultured for 14 days. Data are mean values ± s.d. Scale bar: 50 µm. P2-Oc + 14 days n = 3; P2-ROc + 14d n = 5; P2-ROt + 14d n = 3; P2-ROt + 21d n = 3; P16-O n = 4; P6-Oc + 14d n = 3; P6-ROc + 14d n = 4; P6-ROt + 14d n = 3; P6-ROt + 21d n = 3; P20-O n = 3. *P ≤ 0.05; **P ≤ 0.01.
Figure 4
Figure 4
Representative images of follicles at primary, secondary and preantral stages within cultured ovaries, cultured reaggregated ovaries, transplanted reaggregated ovaries and age-matched in vivo ovaries. Representative images of a (A) primary follicle from age-matched in vivo ovaries, cultured ovaries, transplanted reaggregated ovaries (ROs) and cultured ROs. Red box is magnified in A′. (A′) Higher magnification of the red box in A, showing the theca layer of primary follicles. Red arrows are pointing at the theca layer. Representative images of (B) secondary follicles, (B′) higher magnification of secondary follicle theca layers, (C) preantral follicles and (C′) higher magnification of preantral follicle theca layers are shown. Follicle scale bar (A, B and C): 50 µm; high magnification theca scale bar (A′, B′ and C′): 10 µm. #, no follicles present.
Figure 5
Figure 5
Analysis of basal lamina in ovaries and reaggregated ovaries. (Ai and ii) Representative images of follicles stained with Periodic acid-Schiff and haematoxylin defining how follicle basal lamina (FBL) was classified as >50% defined. (Aiii) Higher magnification of the red box in Aii, with the red arrow pointing at the stained FBL. (Bi, ii) Representative images of follicles classified as ≤50% defined FBL. (Biii) Higher magnification of the red box in Bii, with the red arrow pointing at the lack of FBL definition. (C) Analysis of FBL definition in primary, secondary and preantral follicles in cultured ovaries (Oc + 14d), cultured reaggregated ovaries (ROc + 14d) and transplanted reaggregated ovaries (ROt + 14d) and in vivo Control ovaries (P16-O/P20-O). Scale bar (Ai, Aii, Bi and Bii): 50 µm; high magnification of FBL scale bar (Aiii and Biii): 10 µm. P16-O/P20-O n = 23 follicles, n = 4 ovaries; Oc + 14d n = 25 follicles, n = 4 ovaries; ROc + 14d n = 24 follicles, n = 3 ovaries; ROt + 14d n = 19 follicles, n = 4 ovaries. **P ≤ 0.01; ***P ≤ 0.001.
Figure 6
Figure 6
Theca and granulosa cell quantification in ovaries and reaggregated ovaries. Quantification of (A) theca cell number was determined for primary, secondary and preantral follicles in P2 ovaries (P2-O), P2 cultured ovaries (P2-Oc + 14d), P2 cultured reaggregated ovaries (P2-ROc + 14d), P2 transplanted ROs (P2-ROt + 14d) and P16 ovaries (P16-O), as well as for the P6 counterparts (P6-O, P6-Oc + 14d, P6-ROc + 14d, P6-ROt + 14d, P20-O). (B) Granulosa cell number was also determined in primary, secondary and preantral follicles. Data are plotted as mean values ± s.d. Bars with matched lower-case letters are significantly different from each other, within a follicle stage. #P2-O and P6-O are not compared to the other conditions, as they have not been cultured for 14 days. Primary follicles: P2-O n = 49; P2-Oc + 14d n = 28; P2-ROc + 14d n = 109; P2-ROt + 14d n = 31; P16-O n = 62; P6-O n = 57; P6-Oc + 14d n = 57; P6-ROc + 14d n = 25; P6-ROt + 14d n = 44; P20-O n = 52. Secondary follicles: P2-Oc + 14d n = 12; P2-ROc + 14d n = 81; P16-O n = 54; P6-O n = 9; P6-Oc + 14d n = 14; P6-ROc + 14d n = 23; P6-ROt + 14d n = 4; P20-O n = 31. Preantral follicles: P2-Oc + 14d n = 5; P2-ROc + 14d n = 8; P16-O n = 19; P6-Oc + 14d n = 11; P6-ROc + 14d n = 13; P20-O n = 19.
Figure 7
Figure 7
Oocyte and follicle area in ovaries and reaggregated ovaries. (A) Oocyte area and (B) follicle area were determined for primary, secondary and preantral follicles in P2 ovaries (P2-O), P2 cultured ovaries (P2-Oc + 14d), P2 cultured reaggregated ovaries (P2-ROc + 14d), P2 transplanted ROs (P2-ROt + 14d) and P16 ovaries (P16-O), as well as the P6 counterparts (P6-O, P6-Oc + 14d, P6-ROc+14d, P6-ROt + 14 days, P20-O). Data are plotted as mean values ± s.d. Bars with matched lower-case letters are significantly different from each other, within a follicle stage. #P2-O and P6-O are not compared to the other conditions, as they have not been cultured for 14 days. Primary follicles: P2-O n = 49; P2-Oc + 14d n = 28; P2-ROc + 14d n = 109; P2-ROt + 14d n = 31; P16-O n = 62; P6-O n = 57; P6-Oc + 14d n = 57; P6-ROc + 14d n = 25; P6-ROt + 14d n = 44; P20-O n = 52. Secondary follicles: P2-Oc + 14d n = 12; P2-ROc + 14d n = 81; P16-O n = 54; P6-O n = 9; P6-Oc + 14d n = 14; P6-ROc + 14d n = 23; P6-ROt + 14d n = 4; P20-O n = 31. Preantral follicles: P2-Oc + 14d n = 5; P2-ROc + 14d n = 8; P16-O n = 19; P6-Oc + 14d n = 11; P6-ROc + 14d n = 13; P20-O n = 19.
Figure 8
Figure 8
Correlations between follicle and granulosa area to granulosa cell numbers in primary follicles from ovaries and reaggregated ovaries. Linear regressions were performed between (A) follicle area and granulosa cell (GC) number and (B) granulosa area and GC number in primary follicles from P2 whole ovaries (P2-O), P2 cultured ovaries (P2-Oc + 14d), P2 cultured reaggregated ovaries (P2-ROc + 14d), P2 transplanted ROs (P2-ROt + 14d) and P16 ovaries (P16-O), as well as the P6 equivalents (P6-O, P6-Oc + 14d, P6-ROc + 14d, P6-ROt + 14d, P20-O). Primary follicles: P2-O n = 49; P2-Oc + 14d n = 28; P2-ROc + 14d n = 109; P2-ROt + 14d n = 31; P16-O n = 62; P6-O n = 57; P6-Oc + 14d n = 57; P6-ROc + 14d n = 25; P6-ROt + 14d n = 44; P20-O n = 52. r 2 values are shown next to each line; all graphed lines have r 2 > 0.6. The lines graphed in follicle area to GC number (P2 group) and granulosa area to GC number (both P2 and P6 group) have significantly different gradients. The lines graphed in follicle area to GC number (P6 group) have similar gradients but differing y intercepts.

References

    1. Abdi S, Salehnia M, Hosseinkhani S. 2013. Steroid production and follicular development of neonatal mouse ovary during in vitro culture. International Journal of Fertility and Sterility 7 181–186. - PMC - PubMed
    1. Abercrombie M. 1946. Estimation of nuclear population from microtome sections. Anatomical Record 94 239–247. (10.1002/ar.1090940210) - DOI - PubMed
    1. Bristol-Gould SK, Kreeger PK, Selkirk CG, Kilen SM, Cook RW, Kipp JL, Shea LD, Mayo KE, Woodruff TK. 2006. Postnatal regulation of germ cells by activin: the establishment of the initial follicle pool. Developmental Biology 298 132–148. (10.1016/j.ydbio.2006.06.025) - DOI - PubMed
    1. Campbell L, Trendell J, Spears N. 2013. Identification of cells migrating from the thecal layer of ovarian follicles. Cell and Tissue Research 353 189–194. (10.1007/s00441-013-1621-y) - DOI - PubMed
    1. Chiti MC, Dolmans MM, Lucci CM, Paulini F, Donnez J, Amorim CA. 2017. Further insights into the impact of mouse follicle stage on graft outcome in an artificial ovary environment. Molecular Human Reproduction 23 381–392. (10.1093/molehr/gax016) - DOI - PubMed

Publication types