. 2019 Jan 2;12(1):1.
doi: 10.1186/s13072-018-0245-6.

Integration of DNA methylation patterns and genetic variation in human pediatric tissues help inform EWAS design and interpretation

Affiliations

Integration of DNA methylation patterns and genetic variation in human pediatric tissues help inform EWAS design and interpretation

Sumaiya A Islam et al. Epigenetics Chromatin. .

Abstract

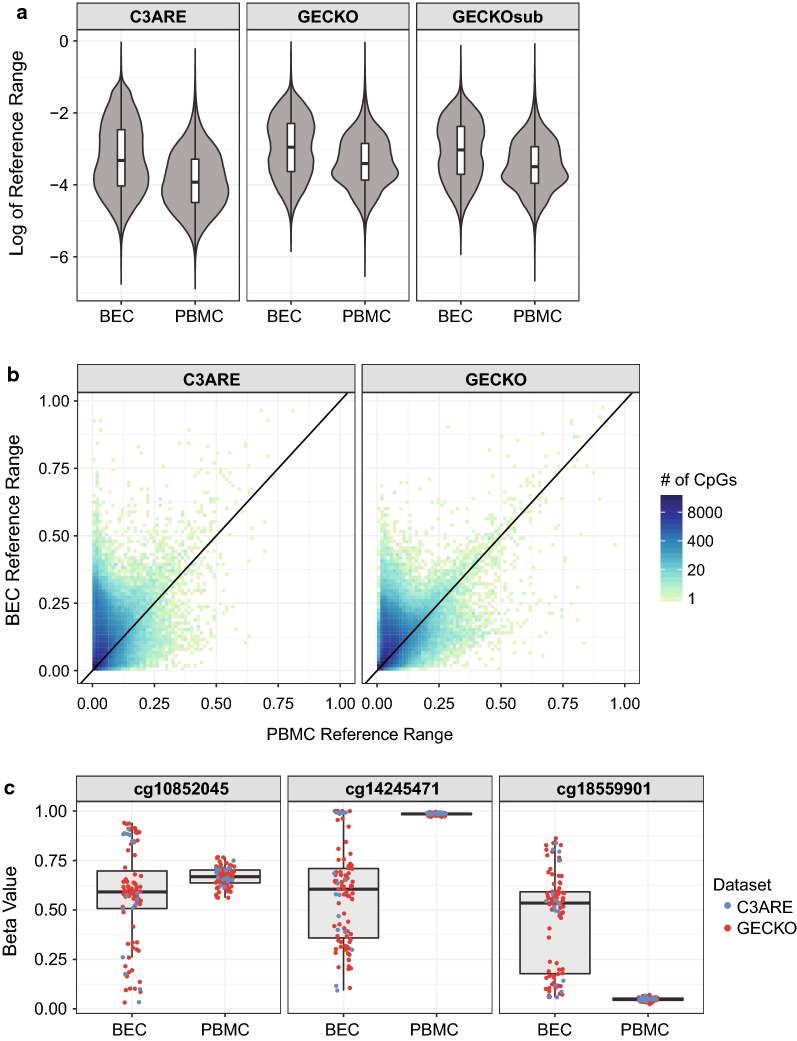
Background: The widespread use of accessible peripheral tissues for epigenetic analyses has prompted increasing interest in the study of tissue-specific DNA methylation (DNAm) variation in human populations. To date, characterizations of inter-individual DNAm variability and DNAm concordance across tissues have been largely performed in adult tissues and therefore are limited in their relevance to DNAm profiles from pediatric samples. Given that DNAm patterns in early life undergo rapid changes and have been linked to a wide range of health outcomes and environmental exposures, direct investigations of tissue-specific DNAm variation in pediatric samples may help inform the design and interpretation of DNAm analyses from early life cohorts. In this study, we present a systematic comparison of genome-wide DNAm patterns between matched pediatric buccal epithelial cells (BECs) and peripheral blood mononuclear cells (PBMCs), two of the most widely used peripheral tissues in human epigenetic studies. Specifically, we assessed DNAm variability, cross-tissue DNAm concordance and genetic determinants of DNAm across two independent early life cohorts encompassing different ages.

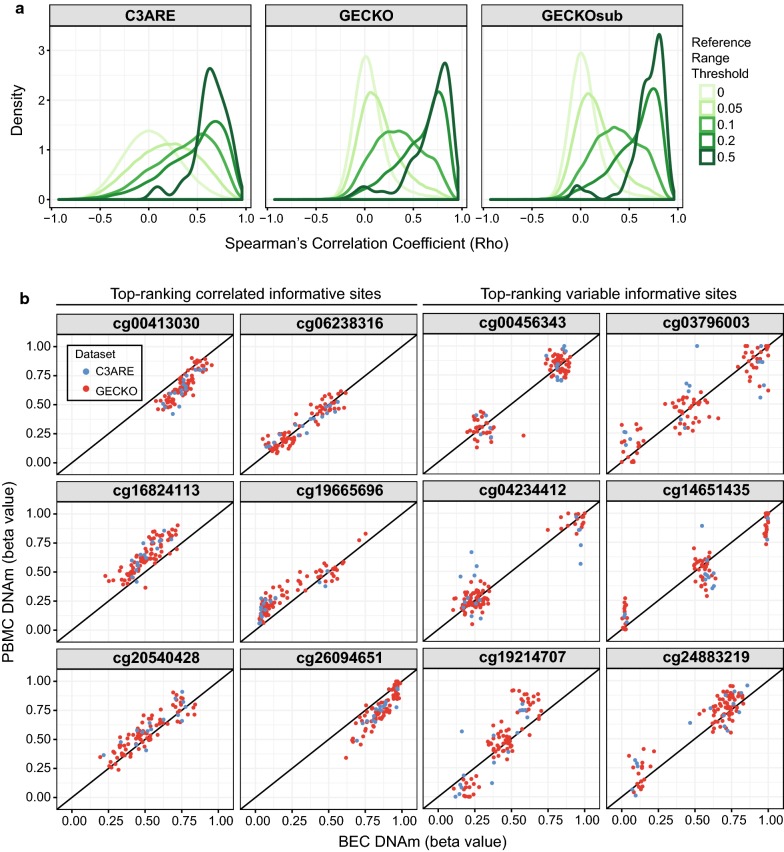
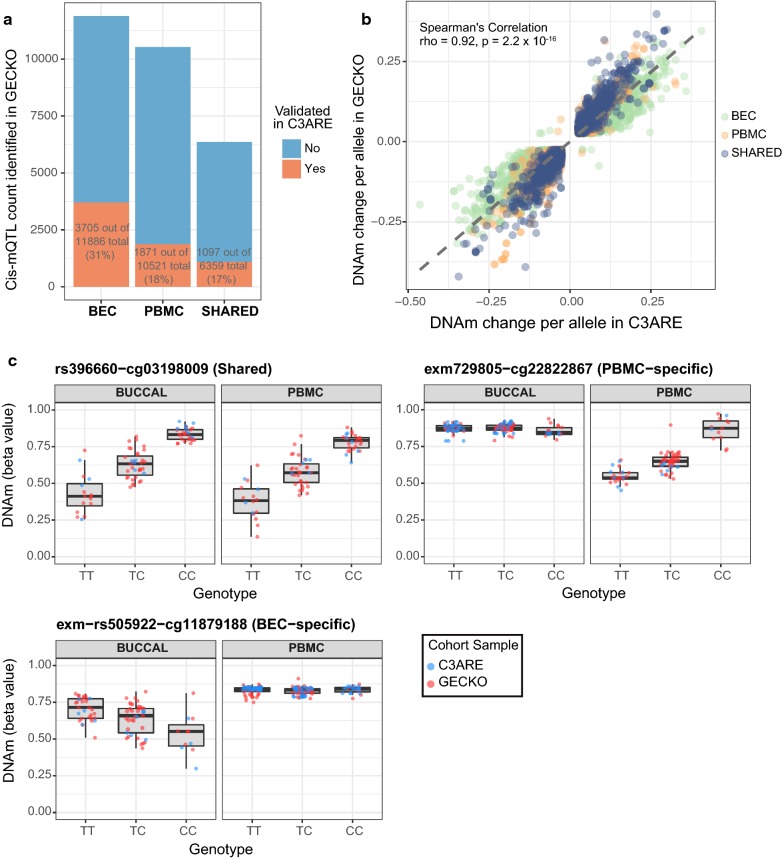
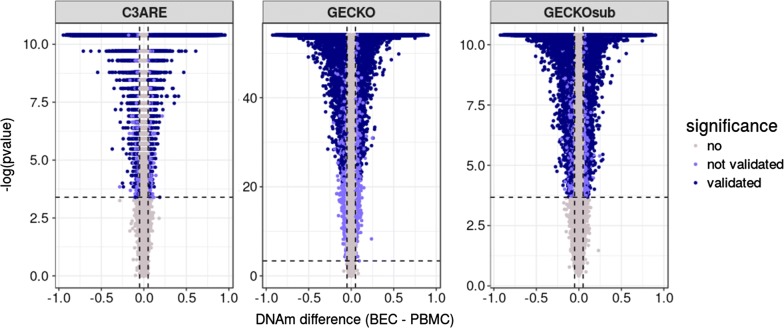
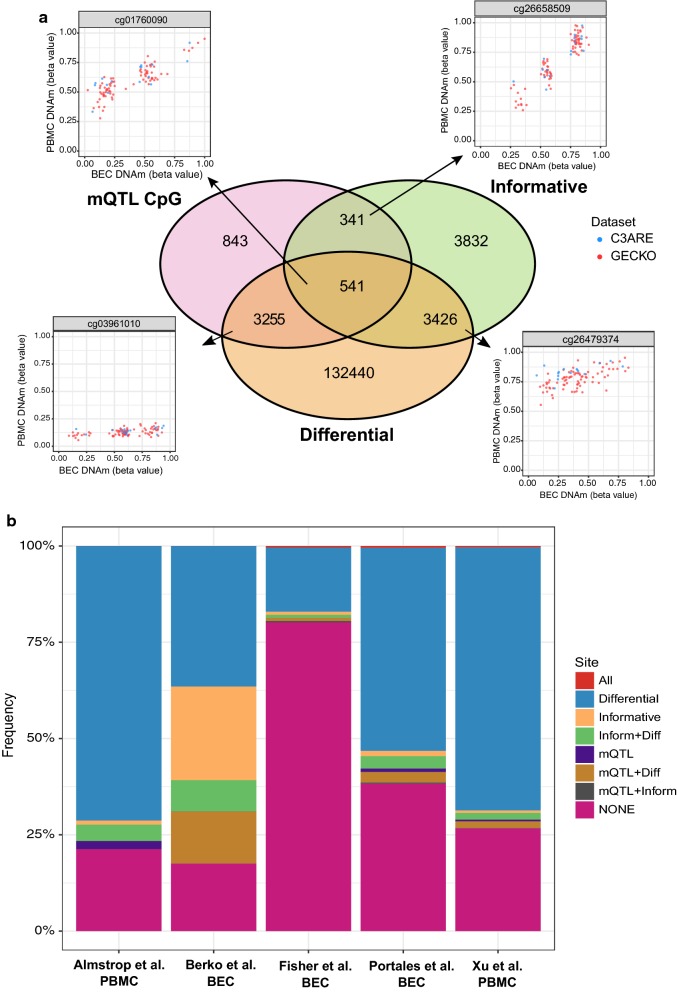
Results: BECs had greater inter-individual DNAm variability compared to PBMCs and highly the variable CpGs are more likely to be positively correlated between the matched tissues compared to less variable CpGs. These sites were enriched for CpGs under genetic influence, suggesting that a substantial proportion of DNAm covariation between tissues can be attributed to genetic variation. Finally, we demonstrated the relevance of our findings to human epigenetic studies by categorizing CpGs from published DNAm association studies of pediatric BECs and peripheral blood.

Conclusions: Taken together, our results highlight a number of important considerations and practical implications in the design and interpretation of EWAS analyses performed in pediatric peripheral tissues.

Keywords: Buccal epithelial cells; DNA methylation; Genetic variation; Illumina 450K array; Pediatric; Peripheral blood leukocytes; Surrogate tissues.


Figures

Fig. 1
Fig. 1
BEC DNAm was consistently more variable than PBMC DNAm at the genome-wide and probewise level. a Distribution of reference range in C3ARE, GECKO and GECKOsub, showing significantly great variability in BEC versus PBMC (Wilcoxon p < 2.2 × 10−16 in each cohort). b Scatterplot of PBMC versus BEC reference range in each cohort. c Three examples of CpGs with the greatest reference range difference between tissues. Individuals from the GECKO cohort are shown in red and individuals from C3ARE are shown in blue
Fig. 2
Fig. 2
Variable CpGs were more highly correlated between tissues. a Density distribution plots of Spearman’s correlation rho between matched PBMCs and BECs across C3ARE, GECKO and GECKOsub datasets showing progressively greater enrichment of highly positively correlated CpGs at increasing reference range thresholds. Reference range thresholds were set along a sliding scale with cut-offs at 0, 0.05, 0.1, 0.2 and 0.5 (depicted by gradient of green lines). b Scatterplots of BEC DNAm versus PBMC DNAm for a representative set of informative sites (defined as CpGs that are both variable across individuals and highly correlated between BECs and PBMCs). Top-ranking correlated informative sites (shown in the left two columns) exhibited continuous distributions. In contrast, top-ranking variable informative sites (shown in the right two columns) exhibited discrete distributions, suggesting that these Cps may be under genetic influence. C3ARE samples are shown in blue while GECKO samples are shown in red
Fig. 3
Fig. 3
Independently validated cis-mQTL were more likely to be shared across tissues than expected by chance. a Stacked bar plot representing number of cis-mQTL identified in GECKO discovery cohort (shown in blue) and number of cis-mQTL validated in C3ARE cohort (shown in red) in either BECs, PBMCs or shared across both tissues. b Scatterplot of DNAm change per allele in GECKO versus C3ARE across all validated cis-mQTL shows mQTL effect sizes (measured as DNAm change per allele) were highly consistent across cohorts (BEC-specific, PBMC-specific and shared-tissue mQTL shown in different colors). c Boxplots of genotype versus DNAm for representative examples of a shared-tissued (top left), PBMC-specific (top right) and a BEC-specific (bottom) validated cis-mQTL. C3ARE samples are shown in blue while GECKO samples are shown in red
Fig. 4
Fig. 4
Tissue-specific differential DNA methylation was consistent across cohorts. Volcano plots of differential methylation analysis (run using a paired Wilcoxon signed-rank test) between BEC and PBMC tissues for C3ARE, GECKO and GECKOsub datasets. Vertical lines represent an effect size threshold of > 0.05 for absolute mean difference between tissues (BEC–PBMC) and the horizontal line represents the nominal p value corresponding to an FDR < 0.05 in each cohort. CpGs in dark purple met the effect size and significance cut-offs independently in all three datasets (139,662 CpGs). GECKO − log p values were ~ 5X greater than that of GECKOsub and C3ARE likely due to sample size differences between datasets (n = 79, n = 16, n = 16, respectively); y-axes were left unstandardized to display trends within each cohort
Fig. 5
Fig. 5
Overlap and representation of identified CpGs in previously published pediatric EWAS findings. a Venn diagram of CpGs identified as informative, differentially methylated between tissues, or underlying our set of validated cis-mQTL. Scatterplots display three representative CpGs from the pairwise intersections between categories. b Stacked bar plot showing proportion of CpGs of each defined category represented in significant CpGs of various pediatric EWAS publications in BECs or PBMCs (All = all categories; Differential = differentially methylated between tissues; Informative = informative CpG; Inform + Diff = informative and differential; mQTL = CpG associated with mQTL; mQTL + Diff = mQTL CpG and differential; mQTL + Inform = mQTL CpG and informative; None = not in any of the listed categories)

Similar articles

Cited by

References

    1. Lappalainen T, Greally JM. Associating cellular epigenetic models with human phenotypes. Nat Rev Genet. 2017;18:441–451. doi: 10.1038/nrg.2017.32. - DOI - PubMed
    1. Boyce WT, Kobor MS. Development and the epigenome: the ‘synapse’ of gene-environment interplay. Dev Sci. 2014;18:1–23. doi: 10.1111/desc.12282. - DOI - PubMed
    1. Chadwick LH, Sawa A, Yang IV, Baccarelli A, Breakefield XO, Deng H-WW, et al. New insights and updated guidelines for epigenome-wide association studies. Neuroepigenetics. 2015;1C:14–19. doi: 10.1016/j.nepig.2014.10.004. - DOI
    1. Michels KB, Binder AM, Dedeurwaerder S, Epstein CB, Greally JM, Gut I, et al. Recommendations for the design and analysis of epigenome-wide association studies. Nat Methods. 2013;10:949–955. doi: 10.1038/nmeth.2632. - DOI - PubMed
    1. Birney E, Smith GD, Greally JM. Epigenome-wide association studies and the interpretation of disease-omics. PLoS Genet. 2016;12:e1006105–e1006109. doi: 10.1371/journal.pgen.1006105. - DOI - PMC - PubMed

Publication types