. 2019 Feb 15;39(5):e00376-18.
doi: 10.1128/MCB.00376-18. Print 2019 Mar 1.

Common and Differential Transcriptional Actions of Nuclear Receptors Liver X Receptors α and β in Macrophages

Affiliations

Common and Differential Transcriptional Actions of Nuclear Receptors Liver X Receptors α and β in Macrophages

Ana Ramón-Vázquez et al. Mol Cell Biol. .

Abstract

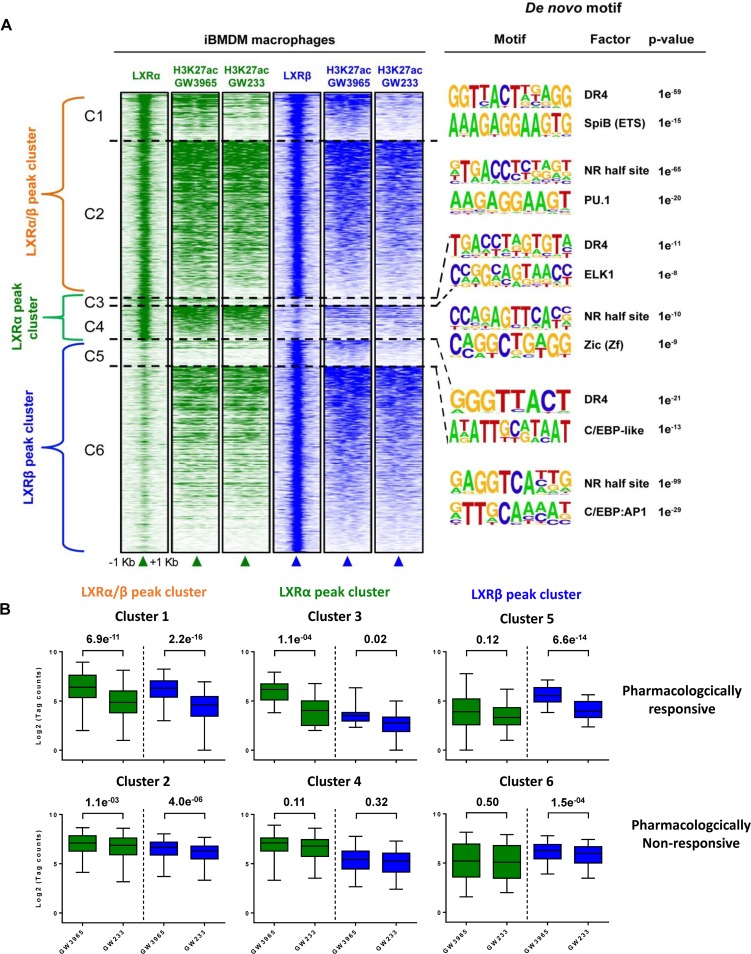
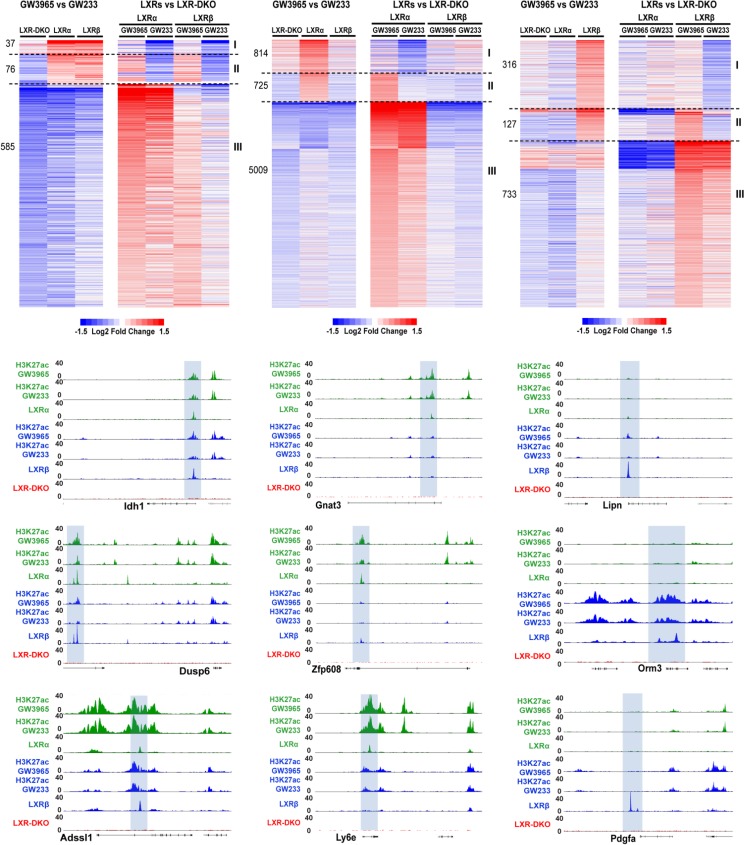
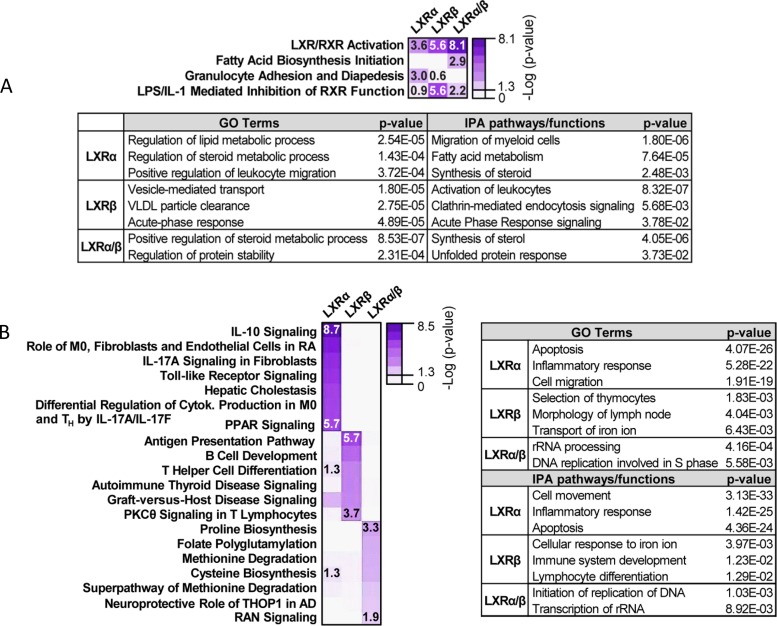
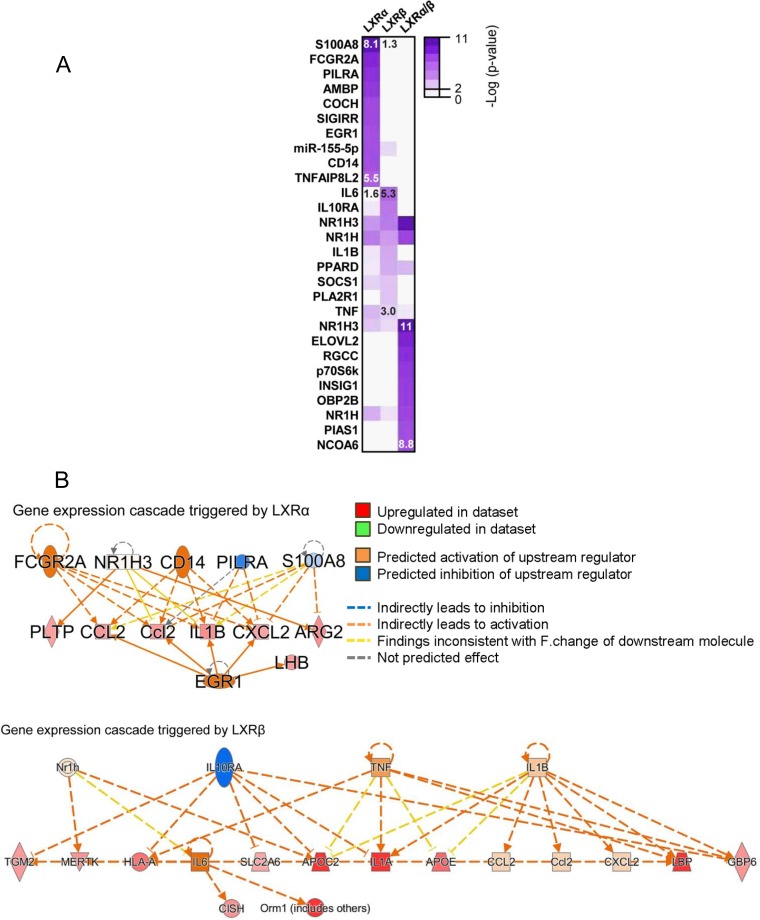
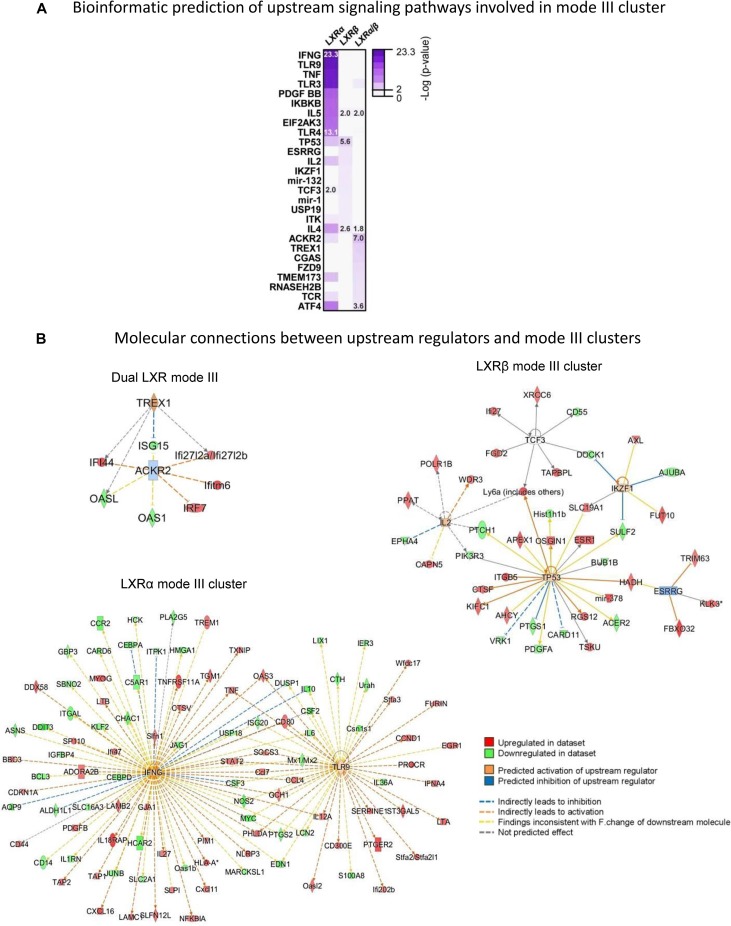
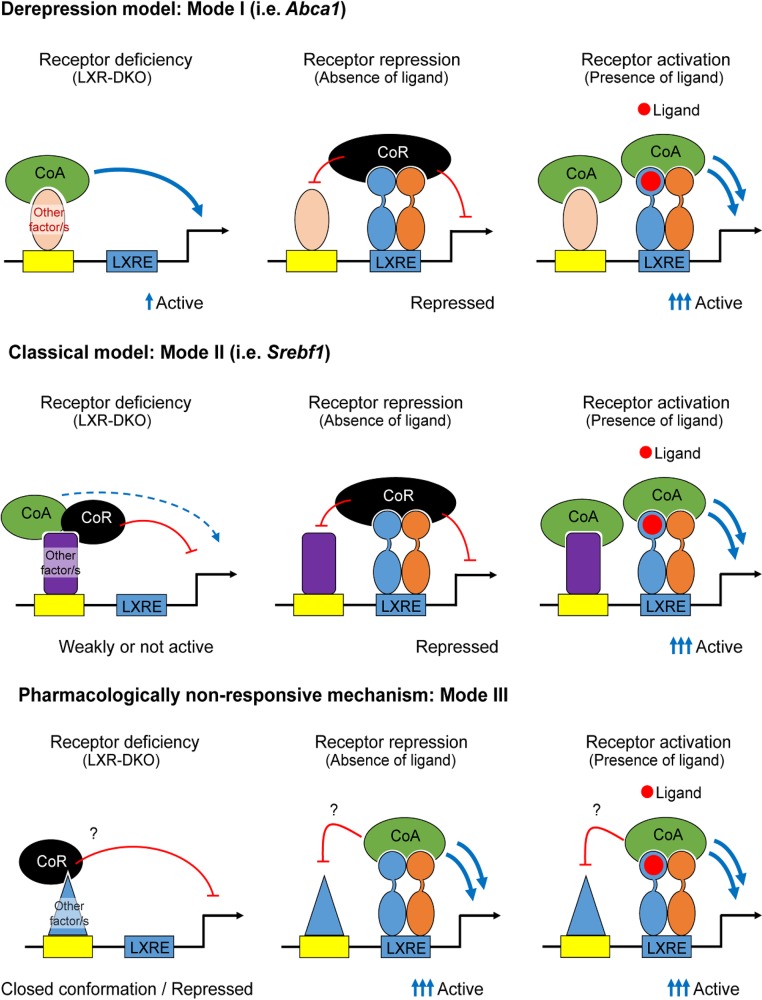
The liver X receptors α and β (LXRα and LXRβ) are oxysterol-activated transcription factors that coordinately regulate gene expression that is important for cholesterol and fatty acid metabolism. In addition to their roles in lipid metabolism, LXRs participate in the transcriptional regulation of macrophage activation and are considered potent regulators of inflammation. LXRs are highly similar, and despite notable exceptions, most of their reported functions are substantially overlapping. However, their individual genomic distribution and transcriptional capacities have not been characterized. Here, we report a macrophage cellular model expressing equivalent levels of tagged LXRs. Analysis of data from chromatin immunoprecipitation coupled with deep sequencing revealed that LXRα and LXRβ occupy both overlapping and exclusive genomic regulatory sites of target genes and also control the transcription of a receptor-exclusive set of genes. Analysis of genomic H3K27 acetylation and mRNA transcriptional changes in response to synthetic agonist or antagonist treatments revealed a putative mode of pharmacologically independent regulation of transcription. Integration of microarray and sequencing data enabled the description of three possible mechanisms of LXR transcriptional activation. Together, these results contribute to our understanding of the common and differential genomic actions of LXRs and their impact on biological processes in macrophages.

Keywords: LXR; gene expression; inflammation; liver X receptor; macrophage; nuclear receptor; transcription.


Figures

FIG 1
FIG 1
Protein and RNA levels of LXRα and LXRβ in different in vitro macrophage models. (A and B) Expression levels of LXRα, LXRβ, ABCA1, and ABCG1 from murine thioglycolate-elicited peritoneal macrophages and bone marrow-derived macrophages differentiated with M-CSF and GM-CSF cytokines were tested by Western blotting after cell treatment with LXR and RXR synthetic ligands (A) and by qPCR under GW3965 ligand treatment conditions (B). Drug antagonism mediated by GW233 on LXR target gene expression was investigated on LXR-WT and LXR-DKO peritoneal murine macrophages by Western blotting. (C) Cells were cultured with GW3965 (1 μM) or GW233 (1 μM), alone or in combination, for 24 h. (D) The ability of GW233 to target both LXR nuclear receptors was tested on LXR-WT and LXR single-knockout macrophage cells under culture conditions similar to those described for panel C. One representative experiment out of three is presented in each case, and mean (SD) values from qPCR triplicates are shown in panel B.
FIG 2
FIG 2
Reconstitution of LXRα and LXRβ expression in immortalized macrophages from LXR-DKO bone marrow. (A) Outline of the experimental design for the generation of immortalized macrophage cell lines, iBMDMs, expressing FLAG-tagged LXRα, LXRβ, or no LXRs. (B, left) Whole-protein extracts from iBMDM-LXR macrophages cultured under different serum depletion conditions (see Materials and Methods) were analyzed by Western blotting for the expression of virally transduced LXRα or LXRβ. Induction levels of the LXR target genes ABCA1 and ABCG1 were also examined. GAPDH was used as a loading control. (B, right) LXRα and LXRβ protein expression was tested in whole-protein extracts from iBMDM macrophages, RAW cells virally transduced with LXRα (29), and WT peritoneal macrophages treated with GW3965 (1 μM). β-Actin was used as a loading control. The box in the LXRα/β panel indicates the specific 3FLAG-LXRα protein band, which shows a weight slightly similar to that of endogenous LXRβ protein. (C) Expression of dual and LXRα-specific (Cd5l) target genes upon GW3965 or GW233 (1 μM) treatment was examined by real-time qPCR. Results are represented as mean (±SD) values from three independent experiments. Asterisks indicate statistical significance between treatments: *, P < 0.05; **, P < 0.01.
FIG 3
FIG 3
LXRα/β ligand-induced binding and histone H3 acetylation in the cis-acting regulatory regions of known LXR target genes. (A) LXR occupancy was detected in the regulatory sites of known target genes in iBMDM macrophages using anti-FLAG antibody. Data are expressed as mean (±SD) values from three independent experiments. Asterisks indicate statistical significance relative to an irrelevant distal region: *, P < 0.05; **, P < 0.01. (B) LXRα/β binding capacity to LXR regulatory sites was tested in cells cultured with GW3965 and GW233 (24 h, 1 μM). Data are expressed as mean (±SD) values from two independent experiments. (C) Acetylation/deacetylation dynamics of histone H3 (H3K27ac) upon iBMDM treatment with GW3965 and GW233 was examined by ChIP-qPCR. Statistical significance was calculated between treatments in each iBMDM-LXR cell line with unpaired Student´s t test. *, P < 0.05; **, P < 0.01.
FIG 4
FIG 4
Genome-wide occupancy of LXRα and LXRβ nuclear receptors in iBMDM cells. (A) Genomic binding locations of LXRα and LXRβ nuclear receptors in iBMDM macrophages are represented in a scatter plot by receptor-normalized ChIP-seq tag counts (log2). (B) Number of unique and shared genomic LXR-bound sites, depicted as a Venn diagram. (C) Distribution of LXRα, LXRβ, and shared LXRα/β binding sites in reference to gene features are shown. TSS, transcription start site; TTS, transcription termination site. (D) Density heatmap of LXRα, LXRβ, and RXRα ChIP-seq peak intensities in a 2-kb window, detected in iBMDM and primary macrophages (accession number GSE63698). Genomic regions are clustered according to shared LXRα/β as well as LXRα- and LXRβ-specific occupancies. (E) LXR and RXR binding (ChIP sequencing tags per bp) in dual, LXRα, and LXRβ peak clusters. (F) Top five de novo and known sequence motif enrichment associated with LXR/RXRα-bound sites in iBMDM macrophages (see Table S3 in the supplemental material for a complete list). bkgrd, background.
FIG 5
FIG 5
Genome-wide colocalization of LXRα/β binding peaks and their corresponding H3K27ac marks in iBMDM macrophages. (A) Changes in acetylation marks (H3K27ac) upon agonist and antagonist drug treatment of iBMDM macrophages were examined by ChIP-seq. Acetylated areas are represented as a density heatmap within a 2-kb window of centered LXRα/β, LXRα, and LXRβ peaks as described in the legend to Fig. 4D. LXR peak-associated acetylated genomic regions are subdivided into six clusters (C1 to C6) and arranged depending on pharmacological responsiveness. Clusters C1, C3, and C5, pharmacologically responsive acetylation marks; clusters C2, C4, and C6, weakly or nonresponsive acetylated regions. Top de novo sequence motifs identified in clusters C1 to C6 and their associated P values are indicated. (B) Box plot representation of genomic mean changes in H3K27ac mark intensity, measured as normalized tag counts (log2) in LXR peak subclusters (C1 to C6), after GW3965 and GW233 stimulation and P value changes.
FIG 6
FIG 6
Expression profiling uncovers LXR dual and isoform-specific targets and reveals putative LXR transcriptional modes of action in response to an agonist/antagonist. Microarray analysis in iBMDM macrophages was performed using GW3965 and GW233 culture conditions as described in Materials and Methods. Heatmap panels are presented in sets of two, representing gene expression that depends on LXRα/β (dual targets, top left heatmaps), is LXRα selective (top middle heatmaps), or is LXRβ selective (top right heatmaps). Each pair of heatmaps shows fold changes in response to GW3965 relative to GW233 in each iBMDM cell line (left) or gene expression in response to each drug treatment relative to that of LXR-DKO iBMDMs (right). Relativized data within each category (LXRα/β [dual], LXRα selective, or LXRβ selective) highlight three possible mechanisms mediating gene activation (modes I, II, and III, as indicated at the right of each set of heatmaps). The number of transcripts regulated through each mechanism is indicated on the left. Lower panels show UCSC Genome Browser snapshots of representative genes as examples of each mechanism. Idh1, Dusp6, and Adssl1, gene loci for modes I, II, and III, respectively, of genes dually regulated by LXRα/β; Gnat3, Zfp608, and Ly6e, gene loci for modes I, II, and III, respectively, of genes regulated selectively by LXRα; and Lipn, Orm3, and Pdgfa, gene loci for modes I, II, and III, respectively, of genes regulated selectively by LXRβ.
FIG 7
FIG 7
Gene Ontology analysis and IPA pathway annotation for microarray gene clusters. Biological pathway analysis was performed on genes that belong to pharmacologically responsive (up in GW3965/GW233 ratio, modes I and II) and nonresponsive (up when referred to iBMDM-DKO, mode III) clusters. (A) Most relevant IPA biological pathways associated with modes I and II (pharmacologically responsive) are depicted as a heatmap. Below, additional relevant GO terms and functions identified by IPA are shown. (B) Most relevant IPA biological pathways associated with mode III (pharmacologically nonresponsive) are depicted as a heatmap. Pathways were arranged by receptor dependence. The table on the right shows additional relevant GO terms and IPA functions. Right-tailed Fisher’s exact test P values for each case are shown. The highest, lowest, and borderline statistically significant P values are shown for each category.
FIG 8
FIG 8
Upstream signaling pathways connecting gene expression cascades triggered by LXR activity in a pharmacologically dependent manner (modes I and II). (A) Molecular regulators of gene expression networks associated with transcriptional modes I and II, identified with IPA. Heatmap color intensities correlate with significance of right-tailed Fisher’s exact test. (B) Diagrams showing molecular interaction networks between signaling regulators and pharmacologically active LXRα and LXRβ, leading to gene expression cascades. Predicted relationships among molecules yielded by IPA are indicated. The highest and lowest statistically significant P values are shown for each category.
FIG 9
FIG 9
Upstream signaling pathways connecting gene expression cascades triggered by LXR activity in a pharmacologically independent manner (mode III). (A) Molecular regulators of gene expression networks associated with transcriptional mode III, identified with IPA. Heatmap color intensities correlate with significance of right-tailed Fisher’s exact test. (B) Diagrams showing molecular interaction networks between signaling regulators and LXRs. Predicted relationships among molecules yielded by IPA are indicated. The highest and lowest statistically significant P values are shown for each category.
FIG 10
FIG 10
Proposed mechanisms for LXR nuclear receptor transcriptional activation. Through integration of gene expression and genome binding data, three possible transcriptional LXR-mediated mechanisms or modes (namely, I, II, and III) are proposed.

Similar articles

Cited by

References

    1. Okabe Y, Medzhitov R. 2016. Tissue biology perspective on macrophages. Nat Immunol 17:9–17. doi:10.1038/ni.3320. - DOI - PubMed
    1. van de Laar L, Saelens W, De Prijck S, Martens L, Scott CL, Van Isterdael G, Hoffmann E, Beyaert R, Saeys Y, Lambrecht BN, Guilliams M. 2016. Yolk sac macrophages, fetal liver, and adult monocytes can colonize an empty niche and develop into functional tissue-resident macrophages. Immunity 44:755–768. doi:10.1016/j.immuni.2016.02.017. - DOI - PubMed
    1. Glass CK, Natoli G. 2016. Molecular control of activation and priming in macrophages. Nat Immunol 17:26–33. doi:10.1038/ni.3306. - DOI - PMC - PubMed
    1. Heinz S, Benner C, Spann N, Bertolino E, Lin YC, Laslo P, Cheng JX, Murre C, Singh H, Glass CK. 2010. Simple combinations of lineage-determining transcription factors prime cis-regulatory elements required for macrophage and B cell identities. Mol Cell 38:576–589. doi:10.1016/j.molcel.2010.05.004. - DOI - PMC - PubMed
    1. Smale ST, Tarakhovsky A, Natoli G. 2014. Chromatin contributions to the regulation of innate immunity. Annu Rev Immunol 32:489–511. doi:10.1146/annurev-immunol-031210-101303. - DOI - PubMed

Publication types

MeSH terms