

Cytogenetic complexity in chronic lymphocytic leukemia: definitions, associations, and clinical impact
- PMID: 30602617
- PMCID: PMC6509568
- DOI: 10.1182/blood-2018-09-873083
Cytogenetic complexity in chronic lymphocytic leukemia: definitions, associations, and clinical impact
Abstract
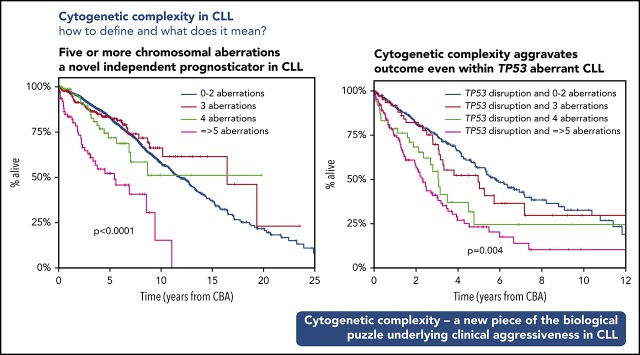
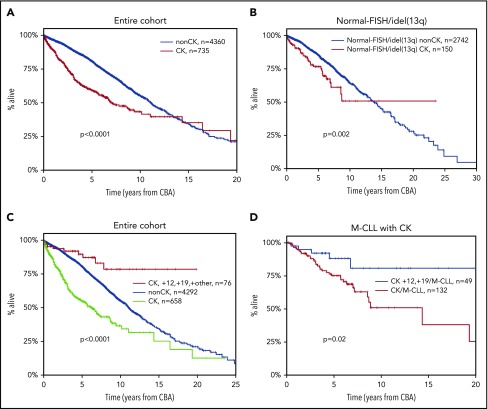
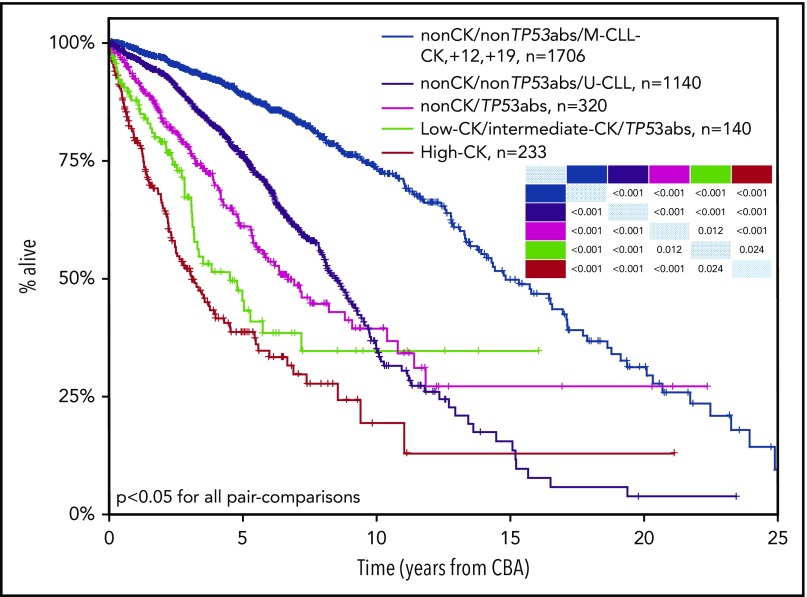
Recent evidence suggests that complex karyotype (CK) defined by the presence of ≥3 chromosomal aberrations (structural and/or numerical) identified by using chromosome-banding analysis (CBA) may be relevant for treatment decision-making in chronic lymphocytic leukemia (CLL). However, many challenges toward the routine clinical application of CBA remain. In a retrospective study of 5290 patients with available CBA data, we explored both clinicobiological associations and the clinical impact of CK in CLL. We found that patients with ≥5 abnormalities, defined as high-CK, exhibit uniformly dismal clinical outcomes, independently of clinical stage, TP53 aberrations (deletion of chromosome 17p and/or TP53 mutations [TP53abs]), and the expression of somatically hypermutated (M-CLL) or unmutated immunoglobulin heavy variable genes. Thus, they contrasted with CK cases with 3 or 4 aberrations (low-CK and intermediate-CK, respectively) who followed aggressive disease courses only in the presence of TP53abs. At the other end of the spectrum, patients with CK and +12,+19 displayed an exceptionally indolent profile. Building upon CK, TP53abs, and immunoglobulin heavy variable gene somatic hypermutation status, we propose a novel hierarchical model in which patients with high-CK exhibit the worst prognosis, whereas those with mutated CLL lacking CK or TP53abs, as well as CK with +12,+19, show the longest overall survival. Thus, CK should not be axiomatically considered unfavorable in CLL, representing a heterogeneous group with variable clinical behavior. High-CK with ≥5 chromosomal aberrations emerges as prognostically adverse, independent of other biomarkers. Prospective clinical validation is warranted before ultimately incorporating high-CK in risk stratification of CLL.
© 2019 by The American Society of Hematology.
Conflict of interest statement
Conflict-of-interest disclosure: K.S. received research support from Janssen Pharmaceuticals, Gilead Sciences, and Novartis SA. P.G. received research support from AbbVie, Janssen Pharmaceuticals, Gilead Sciences, and Novartis and honoraria from AbbVie, Acerta, BeiGene, Janssen, Gilead, and Sunesis. S.J. is employed by MLL Munich Leukemia Laboratory. H.P. received personal fees from Novartis Pharmaceuticals Corporation, Janssen, Takeda GmbH, and Celgene International unrelated to the present study. L.T. received research support from Janssen and Gilead. The remaining authors declare no competing financial interests.
Figures


Comment in
-
Intricacies of CLL cytogenetic complexity.Blood. 2019 Mar 14;133(11):1168-1170. doi: 10.1182/blood-2019-01-896068. Blood. 2019. PMID: 30872270 No abstract available.
Similar articles
-
Karyotypic complexity rather than chromosome 8 abnormalities aggravates the outcome of chronic lymphocytic leukemia patients with TP53 aberrations.Oncotarget. 2016 Dec 6;7(49):80916-80924. doi: 10.18632/oncotarget.13106. Oncotarget. 2016. PMID: 27821812 Free PMC article.
-
Major prognostic value of complex karyotype in addition to TP53 and IGHV mutational status in first-line chronic lymphocytic leukemia.Hematol Oncol. 2017 Dec;35(4):664-670. doi: 10.1002/hon.2349. Epub 2016 Sep 28. Hematol Oncol. 2017. PMID: 27678008
-
An extensive molecular cytogenetic characterization in high-risk chronic lymphocytic leukemia identifies karyotype aberrations and TP53 disruption as predictors of outcome and chemorefractoriness.Oncotarget. 2017 Apr 25;8(17):28008-28020. doi: 10.18632/oncotarget.15883. Oncotarget. 2017. PMID: 28427204 Free PMC article.
-
Genetics of chronic lymphocytic leukemia: genomic aberrations and V(H) gene mutation status in pathogenesis and clinical course.Leukemia. 2002 Jun;16(6):993-1007. doi: 10.1038/sj.leu.2402537. Leukemia. 2002. PMID: 12040431 Review.
-
Cytogenetic and molecular cytogenetic analysis of B cell chronic lymphocytic leukemia: specific chromosome aberrations identify prognostic subgroups of patients and point to loci of candidate genes.Leukemia. 1997 Apr;11 Suppl 2:S19-24. Leukemia. 1997. PMID: 9178833 Review.
Cited by
-
Chronic Lymphocytic Leukemia: Prognostic Factors in the Era of Novel Drugs.Cancers (Basel). 2024 Jul 31;16(15):2732. doi: 10.3390/cancers16152732. Cancers (Basel). 2024. PMID: 39123460 Free PMC article. Review.
-
The Evolving Landscape of Chronic Lymphocytic Leukemia on Diagnosis, Prognosis and Treatment.Diagnostics (Basel). 2021 May 10;11(5):853. doi: 10.3390/diagnostics11050853. Diagnostics (Basel). 2021. PMID: 34068813 Free PMC article. Review.
-
Low-burden TP53 mutations in CLL: clinical impact and clonal evolution within the context of different treatment options.Blood. 2021 Dec 23;138(25):2670-2685. doi: 10.1182/blood.2020009530. Blood. 2021. PMID: 33945616 Free PMC article.
-
Time-to-progression after front-line fludarabine, cyclophosphamide, and rituximab chemoimmunotherapy for chronic lymphocytic leukaemia: a retrospective, multicohort study.Lancet Oncol. 2019 Nov;20(11):1576-1586. doi: 10.1016/S1470-2045(19)30503-0. Epub 2019 Sep 30. Lancet Oncol. 2019. PMID: 31582354 Free PMC article. Clinical Trial.
-
Clonal Evolution of High-Risk Chronic Lymphocytic Leukemia: A Contemporary Perspective.Front Oncol. 2021 Dec 16;11:790004. doi: 10.3389/fonc.2021.790004. eCollection 2021. Front Oncol. 2021. PMID: 34976831 Free PMC article. Review.
References
-
- Fabbri G, Dalla-Favera R. The molecular pathogenesis of chronic lymphocytic leukaemia. Nat Rev Cancer. 2016;16(3):145-162. - PubMed
-
- Hallek M, Pflug N. Chronic lymphocytic leukemia. Ann Oncol. 2010;21(suppl 7):vii154-vii164. - PubMed
-
- Chiorazzi N, Rai KR, Ferrarini M. Chronic lymphocytic leukemia. N Engl J Med. 2005;352(8):804-815. - PubMed
-
- Baliakas P, Hadzidimitriou A, Sutton LA, et al. . Clinical effect of stereotyped B-cell receptor immunoglobulins in chronic lymphocytic leukaemia: a retrospective multicentre study. Lancet Haematol. 2014;1(2):e74-e84. - PubMed
Publication types
MeSH terms
Substances
LinkOut - more resources
Full Text Sources
Medical
Research Materials
Miscellaneous
