. 2019 Jan 2;10(1):6.
doi: 10.1038/s41467-018-07858-8.

The mTORC1/4E-BP1 axis represents a critical signaling node during fibrogenesis

Affiliations

The mTORC1/4E-BP1 axis represents a critical signaling node during fibrogenesis

Hannah V Woodcock et al. Nat Commun. .

Erratum in

  • Author Correction: The mTORC1/4E-BP1 axis represents a critical signaling node during fibrogenesis.
    Woodcock HV, Eley JD, Guillotin D, Platé M, Nanthakumar CB, Martufi M, Peace S, Joberty G, Poeckel D, Good RB, Taylor AR, Zinn N, Redding M, Forty EJ, Hynds RE, Swanton C, Karsdal M, Maher TM, Fisher A, Bergamini G, Marshall RP, Blanchard AD, Mercer PF, Chambers RC. Woodcock HV, et al. Nat Commun. 2020 Sep 11;11(1):4680. doi: 10.1038/s41467-020-18621-3. Nat Commun. 2020. PMID: 32917879 Free PMC article.

Abstract

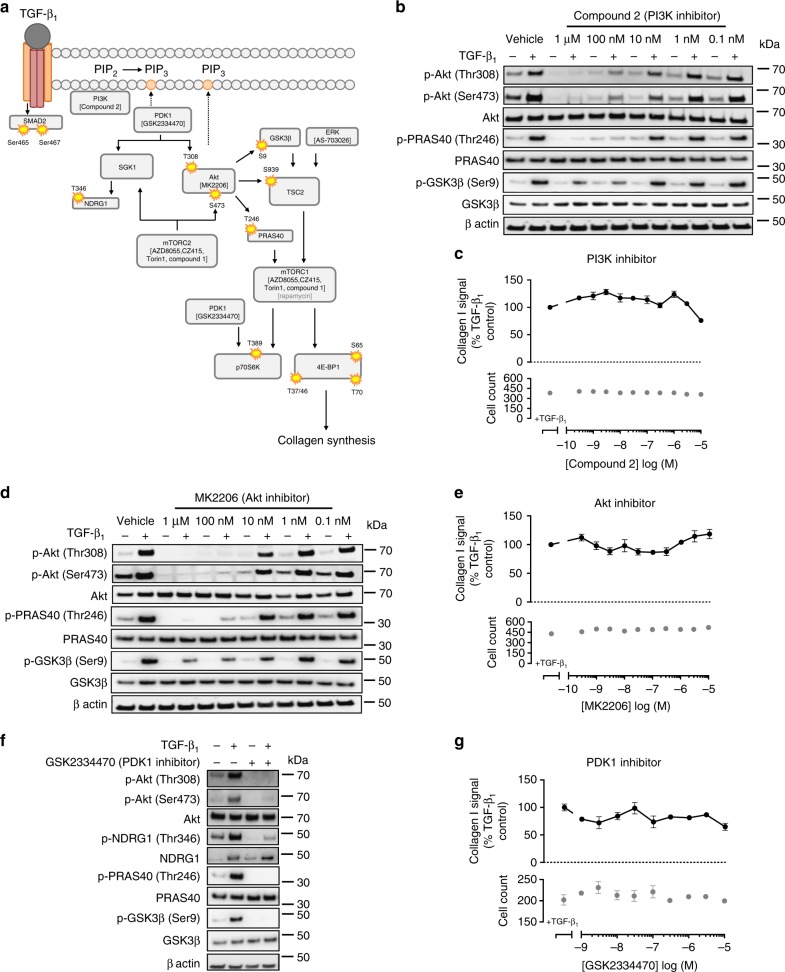
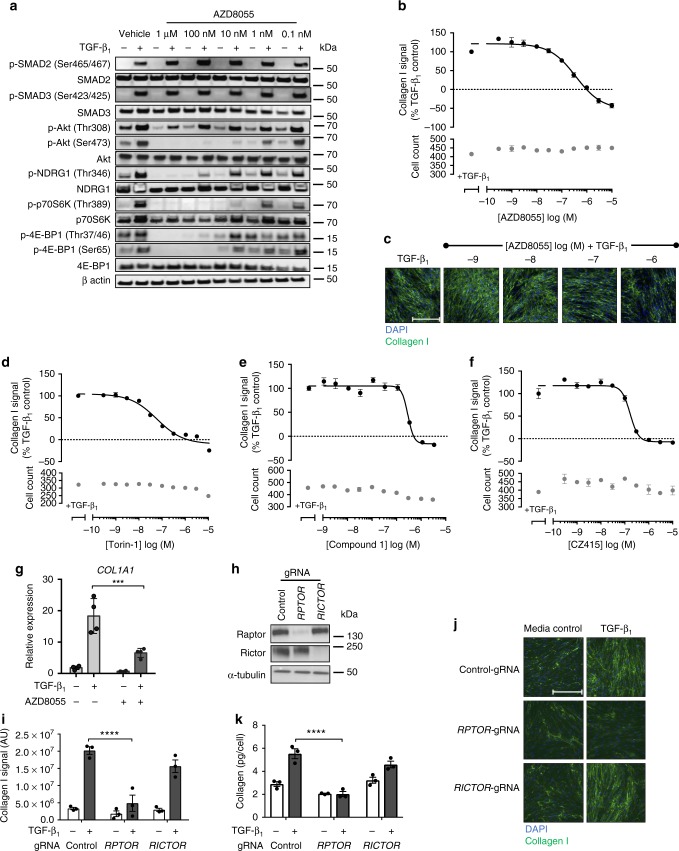
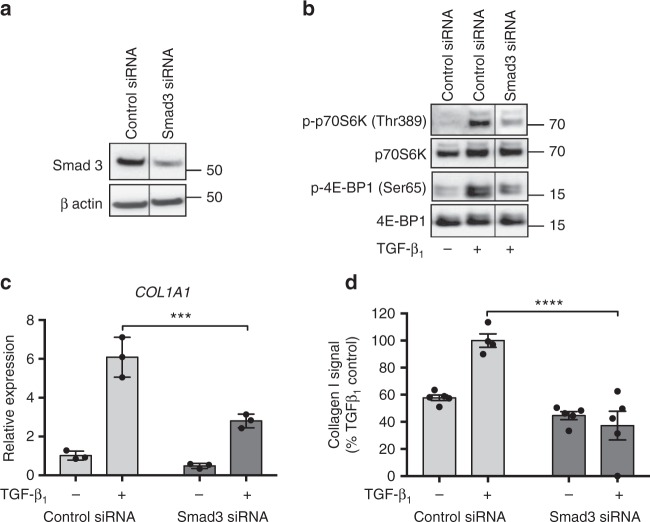
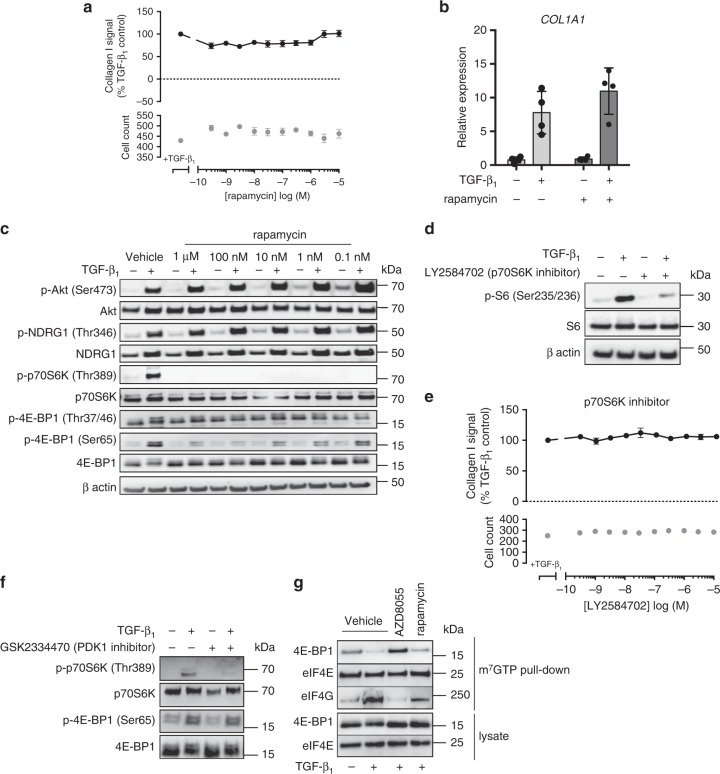
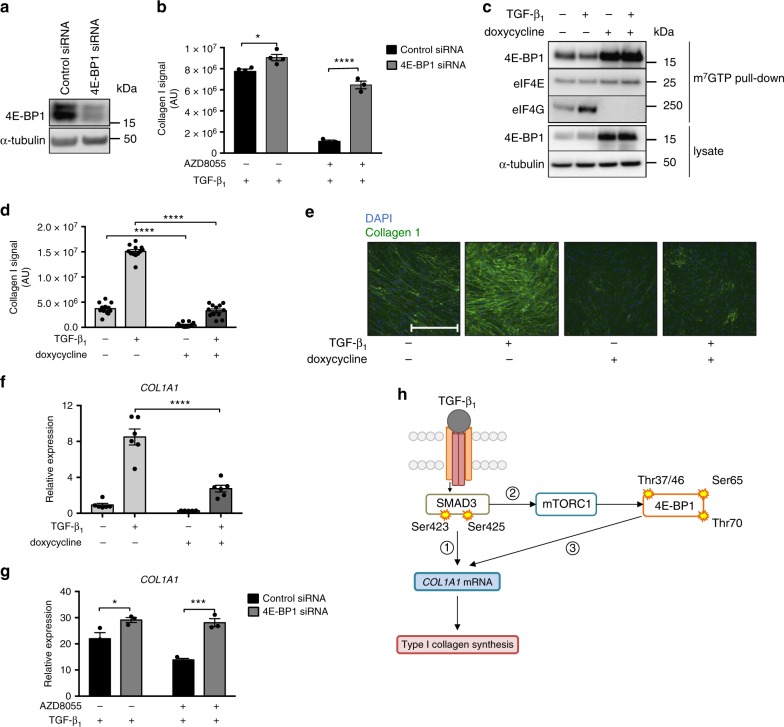
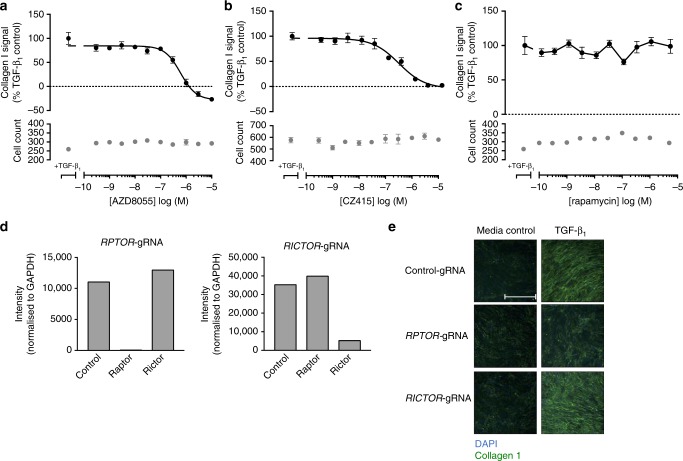
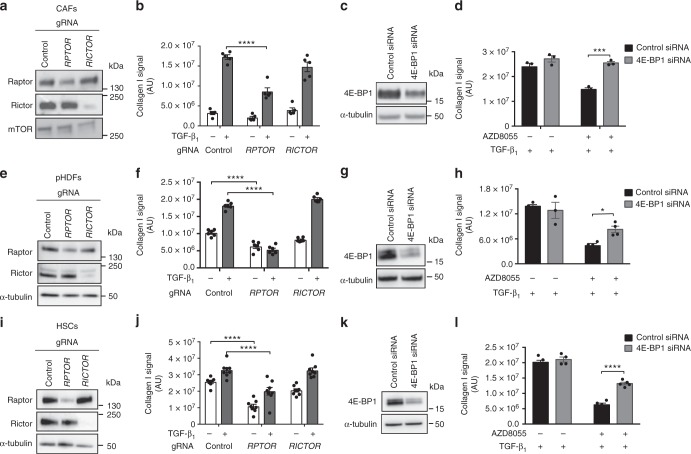
Myofibroblasts are the key effector cells responsible for excessive extracellular matrix deposition in multiple fibrotic conditions, including idiopathic pulmonary fibrosis (IPF). The PI3K/Akt/mTOR axis has been implicated in fibrosis, with pan-PI3K/mTOR inhibition currently under clinical evaluation in IPF. Here we demonstrate that rapamycin-insensitive mTORC1 signaling via 4E-BP1 is a critical pathway for TGF-β1 stimulated collagen synthesis in human lung fibroblasts, whereas canonical PI3K/Akt signaling is not required. The importance of mTORC1 signaling was confirmed by CRISPR-Cas9 gene editing in normal and IPF fibroblasts, as well as in lung cancer-associated fibroblasts, dermal fibroblasts and hepatic stellate cells. The inhibitory effect of ATP-competitive mTOR inhibition extended to other matrisome proteins implicated in the development of fibrosis and human disease relevance was demonstrated in live precision-cut IPF lung slices. Our data demonstrate that the mTORC1/4E-BP1 axis represents a critical signaling node during fibrogenesis with potential implications for the development of novel anti-fibrotic strategies.


Conflict of interest statement

This work was part-funded by a collaborative framework agreement awarded to R.C.C. by GlaxoSmithKline. In terms of potential conflict of interest, the following authors: C.B.N., M.M., S.P., G.J., D.P., R.B.G., A.R.T., G.B., A.D.B., N.Z., and R.P.M. were employees of GlaxoSmithKline which has R&D programs for IPF at the time of writing. M.K. is an employee of Nordic Biosciences with a commercial interest in proprietary assay development for biomarker discovery. T.M.M. has no declarations directly related to this manuscript. He has, however, received industry-academic research funding from GlaxoSmithKline R&D, UCB, and Novartis and has received consultancy or speakers fees from Pellis, Astra Zeneca, Bayer, Biogen Idec, Boehringer Ingelheim, Cipla, Galapagos, GlaxoSmithKline R&D, ProMetic, Roche (and previously InterMune), Sanofi-Aventis, and UCB. All remaining authors declare no competing interests. All data presented have been recorded in full compliance with GSK data integrity.

Figures

Fig. 1
Fig. 1
TGF-β1 induces Smad phosphorylation and mTOR signaling and upregulates collagen I deposition in control primary human lung fibroblasts. Control primary human lung fibroblasts (pHLFs) were stimulated with TGF-β1 (1 ng/ml) for 30 min to 48 h prior to cell lysis. Phosphorylation of specified proteins is shown by Western blot (a). Additionally, pHLFs were stimulated with increasing concentrations of TGF-β1 (1 pg/ml to 30 ng/ml) for 72 h with collagen I deposition assessed by macromolecular crowding assay (b). Data are expressed as the fold change in collagen I signal relative to the media control (4 field of view imaged per well) and cell counts obtained by staining nuclei with DAPI. Representative images are shown in c. Scale bars = 360 µm. Each data point shown is mean ± SEM (n = 4) and is representative of 3 independent experiments
Fig. 2
Fig. 2
Inhibition of TGF-β1-induced PI3K, Akt, and PDK-1 signaling has no effect on collagen I deposition in pHLFs. A schematic, generated by author J.D.E., of inhibitors and their corresponding target is shown in a. pHLFs were pre-incubated with vehicle (0.1% DMSO) or increasing concentrations of Compound 2, MK2206 or 1 µM GSK2334470 prior to stimulation with TGF-β1 (1 ng/ml). Cells were lysed 12 h later and the phosphorylation of specified proteins was assessed by Western blot (b, d, f). Data are representative of 3 independent experiments. Additionally, pHLFs were pre-incubated with vehicle (0.1% DMSO) or increasing concentrations of Compound 2 (c), MK2206 (e), or GSK2334470 (g) and stimulated with TGF-β1 (1 ng/ml) for 72 h with collagen deposition assessed by macromolecular crowding assay. Data are expressed as collagen I signal calculated as a percentage of the TGF-β1-treated control (n = 4 fields of view imaged per well) and cell counts obtained by staining nuclei with DAPI. Each data point shown is mean ± SEM (n = 4) and is representative of 3 independent experiments
Fig. 3
Fig. 3
ATP-competitive inhibition of mTOR and mTORC1 knockout attenuates collagen I deposition in pHLFs. pHLFs were pre-incubated with vehicle (0.1% DMSO) or increasing concentrations of AZD8055 prior to stimulation with TGF-β1 (1 ng/ml). Cells were lysed at 1 h to assess Smad phosphorylation and at 12 h to assess the phosphorylation of specified proteins, assessed by Western blot (a). pHLFs were pre-incubated with vehicle (0.1% DMSO) or increasing concentrations of AZD8055 (b, c), Torin-1 (d), Compound 1 (e), or CZ415 (f) and stimulated with TGF-β1 for 72 h with collagen I deposition assessed by macromolecular crowding assay. Data are expressed as collagen I signal calculated as a percentage of the TGF-β1-treated control (n = 4 fields of view imaged per well) and cell counts obtained by staining nuclei with DAPI (n = 4). Data are representative of 5 independent experiments. Scale bars = 360 µm. IC50 values were calculated using 4-parameter non-linear regression: AZD8055, IC50 = 368 nM, 95% CI 220–616 nM; Torin-1, IC50 = 57.8 nM, 95% CI 38–87.7 nM; Compound 1, IC50 = 2.6 µM, CI 2.1–3.1 µM; CZ415, IC50 = 165.9 nM, 95% CI 135.4–203 nM. COL1A1 mRNA levels were assessed by real-time RT qPCR after pre-incubation of pHLFs with vehicle (0.1% DMSO) or 1 µM AZD8055 prior to TGF-β1 stimulation for 24 h (n = 4) (g). Relative expression was calculated using 2−ΔCt. ΔCt was calculated from the geometric mean of two reference genes. pHLFs were modified by CRISPR-Cas9 gene editing using guide RNAs (gRNA) targeting exon 26 of RPTOR or exon 29 of RICTOR. Analysis of the resultant levels of Raptor and Rictor protein are shown (h). CRISPR-Cas9-edited pHLFs were stimulated with TGF-β1 (1 ng/ml) for 72 h, with collagen I deposition normalized to cell count assessed by macromolecular crowding assay (n = 3) (i). Representative images are shown in j. In addition, supernatants were collected from CRISPR-Cas9-edited pHLFs treated with TGF-β1 (1 ng/ml) for 72 h and hydroxyproline was quantified using HPLC (n = 3) (k). Data are presented as means ± SEM. Differences between groups were evaluated with two-way ANOVA with Tukey multiple comparison testing, ***p < 0.001, ****p < 0.0001
Fig. 4
Fig. 4
mTORC1 signaling is Smad-dependent. pHLFs were transfected with control siRNA or siRNA targeting Smad3 and Smad3 protein expression measured by Western blot (a). Following transfection, pHLFs were stimulated with TGF-β1 (1 ng/ml) for 12 h and mTORC1 signaling evaluated by Western blot analysis (b). An irrelevant lane has been spliced out of the prepared images (a) and (b). Uncropped gels are shown in Supplementary Fig. 9. COL1A1 mRNA levels were assessed by real-time RT qPCR at 24 h (n = 3) (c). Relative expression was calculated using 2−ΔCt. ΔCt was calculated from the geometric mean of two reference genes. Collagen I deposition was measured by macromolecular crowding assay at 72 h (d). Data are expressed as collagen I signal normalized to cell count (n = 4 fields of view imaged per well) calculated as a percentage of the TGF-β1 -treated control (n = 5). Data are presented as mean ± SEM and are representative of 2 independent experiments. Differences between groups were evaluated with two-way ANOVA with Tukey multiple comparison testing, ***p < 0.001, ****p < 0.0001
Fig. 5
Fig. 5
Rapamycin-insensitive mTORC1 signaling mediates TGF-β1-induced collagen I deposition. pHLFs were pre-incubated with vehicle (0.1% DMSO) or increasing concentrations of rapamycin (a) and LY2584702 (e) and stimulated with TGF-β1 for 72 h with collagen I deposition assessed by macromolecular crowding assay. Data are expressed as collagen I signal as a percentage of the TGF-β1-treated control (n = 4 fields of view imaged per well) and cell counts obtained by staining nuclei with DAPI. Data are presented as mean ± SEM (n = 4) and are representative of 3 independent experiments. Additionally, pHLFs were pre-incubated with vehicle (0.1% DMSO) or increasing concentrations of rapamycin (c), 1 µM LY2584702 (d), or 1 µM GSK2334470 (f) prior to stimulation with TGF-β1 (1 ng/ml). Cells were lysed 12 h later and the phosphorylation of specified proteins was assessed by Western blot. COL1A1 mRNA levels were assessed by RT qPCR after pre-incubation of pHLFs with vehicle (0.1% DMSO) or 100 nM rapamycin prior to TGF-β1 stimulation for 24 h (b). Relative expression was calculated using 2−ΔCt. ΔCt was calculated from the geometric mean of two reference genes. Data are presented as mean ± SEM (n = 4). Differences between groups were evaluated with two-way ANOVA. For immunoprecipitation of the m7GTP cap, pHLFs were pre-incubated with vehicle (0.1% DMSO), 1 µM AZD8055 or 100 nM rapamycin prior to TGF-β1 stimulation. Protein levels were assessed by Western blot (g)
Fig. 6
Fig. 6
mTORC1/4E-BP1 axis mediates the TGF-β1 collagen I response in pHLFs. pHLFs were transfected with control siRNA or siRNA targeting 4E-BP1. 4E-BP1 protein expression was measured by Western blot (a). Following transfection, pHLFs were preincubated with 1 μM AZD8055 or vehicle (0.1% DMSO) prior to stimulation with TGF-β1 (1 ng/ml) for 72 h. Collagen I deposition was assessed by macromolecular crowding assay (n = 4) (b). COL1A1 mRNA levels at 24 h were assessed by real-time RT qPCR (n = 3) (g). pHLFs expressing a 4E-BP1-4A dominant-negative phosphomutant were treated with doxycycline (1 μg/ml) or media control for 24 h prior to TGF-β1 stimulation. Immunoprecipitation of the m7GTP cap was performed and protein levels assessed by Western blot (c). Collagen deposition was measured at 72 h by macromolecular crowding assay (n = 12) (d). Representative images are shown in e. Scale bars = 360 µm. COL1A1 mRNA levels were measured at 24 h (n = 6) (f). Data are presented as means ± SEM. For real-time RT-PCR, relative expression was calculated using 2−ΔCt. ΔCt was calculated from the geometric mean of two reference genes. For collagen deposition assays all data are expressed as collagen I signal (n = 4 fields of view imaged per well) normalized to cell count. All data are representative of at least 3 independent experiments. Differences between groups were evaluated with two-way ANOVA with Tukey multiple comparison testing, *p < 0.05, ***p < 0.001, ****p < 0.0001. Proposed model is shown in h (schematic generated by author J.D.E.). TGF-β1 activates the Smad3 pathway which in turn directly influences early increases in COL1A1 mRNA levels (1), as has been previously described. Smad3 activation subsequently activates the mTORC1/4E-BP1 axis (2). This cascade regulates maximal COL1A1 mRNA levels through an unknown mechanism, likely involving the translational regulation of a protein intermediate (3)
Fig. 7
Fig. 7
mTORC1 plays a critical role in mediating the pro-fibrotic effects of TGF-β1 in IPF-derived lung fibroblasts. IPF human lung fibroblasts (IPF-HLFs) were pre-incubated with vehicle (0.1% DMSO) or increasing concentrations of AZD8055 (a), CZ415 (b), or rapamycin (c) and stimulated with TGF-β1 (1 ng/ml) for 72 h with collagen I deposition assessed by macromolecular crowding assay. Data are expressed as collagen I signal calculated as a percentage of the TGF-β1-treated control (n = 4 fields of view imaged per well) and cell counts obtained by staining nuclei with DAPI. Each data point shown is mean ± SEM (n = 4) and is representative of 5 independent experiments. IC50 values were calculated using 4-parameter non-linear regression: AZD8055, IC50 = 604 nM, 95% CI 415 nM to 1 µM; CZ415, IC50 = 245.3 nM, 95% CI 136.7–541 nM. Additionally, IPF-HLFs were modified by CRISPR-Cas9 gene editing using gRNAs targeting exon 26 of RPTOR or exon 29 of RICTOR. Analysis of the resultant levels of Raptor and Rictor protein are shown (d). CRISPR-Cas9-edited IPF-HLFs were also stimulated with TGF-β1 (1 ng/ml) for 72 h, with collagen I deposition assessed by macromolecular crowding assay (e). Scale bars = 360 µm
Fig. 8
Fig. 8
ATP-competitive mTOR inhibition attenuates TGF-β1-induced matrisome protein expression in vitro and collagen synthesis in IPF lung slices. IPF human lung fibroblasts (IPF-HLFs) were pre-incubated with vehicle (0.1% DMSO), rapamycin (100 nM) or the mTOR inhibitor CZ415 (5 µM) prior to stimulation with TGF-β1 (1 ng/ml) for 24 h. Proteomic analysis representing fold change (FC) of core matrisome proteins and proteins involved in collagen synthesis and degradation in lysates of TGF-β1 + vehicle/drug-treated fibroblasts versus negative TGF-β1 control is displayed in a heatmap. Only proteins with up- or down-regulation (pAdj < 0.05 and |FC| > 1.2 for both replicates) in any treatment versus negative TGF-β1 control are represented (50 proteins) (a). Quantitative profiles across treatments are displayed as line charts (b). Human IPF lung tissue slices generated from IPF lung transplant tissue were treated with vehicle (0.1% DMSO) or increasing concentrations of CZ415 for 120 h. Levels of P1NP in supernatants from 4 slices per condition were assessed by ELISA (c). Data are representative of 5 independent donors. Differences between conditions were evaluated with one-way ANOVA with Dunnett’s multiple comparison testing, **p < 0.005. Human IPF lung tissue slices (n = 4) from 2 donors were treated with vehicle (0.1% DMSO) or CZ415 (1 μM) for 5 days and P1NP levels in supernatants and phosphoproteins in homogenized slices were measured. Pooled donor data are presented in d. Differences between conditions were evaluated with Student’s t-test, **p < 0.005, ****p < 0.0001. In c, d the boxplot center line, bounds of box, and whiskers represent median, inter-quartile range, and minimum to maximum values
Fig. 9
Fig. 9
mTORC1/4E-BP1 axis mediates collagen I deposition in other mesenchymal cells. Lung adenocarcinoma-associated fibroblasts (CAFs), primary human dermal fibroblasts (pHDFs), and primary hepatic stellate cells (HSCs) were modified by CRISPR-Cas9 gene editing using gRNAs targeting exon 26 of RPTOR or exon 29 of RICTOR. Analysis of the resultant levels of Raptor and Rictor protein are shown (a, e, i). CRISPR-Cas9-edited CAFs, pHDFs, and HSCs were stimulated with TGF-β1 (1 ng/ml) for 72 h, with collagen I deposition assessed by macromolecular crowding assay (b, f, j). Data are expressed as collagen intensity (n = 4 fields of view imaged per well) normalized to cell count. Data are presented as mean ± SEM (CAFs n = 5, pHDFs n = 6, HSCs n = 8). CAFs, pHDFs, and HSCs were transfected with control siRNA or siRNA targeting 4E-BP and 4E-BP1 protein expression was measured (c, g, k). Following transfection, cells were preincubated with 1 μM (CAFs) or 300 nM (pHDFs, HSCs) AZD8055 or vehicle prior to stimulation with TGF-β1 for 72 h. Collagen I deposition was analyzed by macromolecular crowding assay (d, h, l). Data are expressed as collagen intensity (n = 4 fields of view imaged per well) normalized to cell count. Data are presented as mean ± SEM (CAFs n = 3, pHDFs n = 4, HSCs n = 5). Differences between groups were evaluated with two-way ANOVA with Tukey multiple comparison testing, *p < 0.05, ***p < 0.001, ****p < 0.0001

References

    1. Kalluri R. The biology and function of fibroblasts in cancer. Nat. Rev. Cancer. 2016;16:582–598. doi: 10.1038/nrc.2016.73. - DOI - PubMed
    1. Rockey DC, Bell PD, Hill JA. Fibrosis—a common pathway to organ injury and failure. N. Engl. J. Med. 2015;372:1138–1149. doi: 10.1056/NEJMra1300575. - DOI - PubMed
    1. Bremnes RM, et al. The role of tumor stroma in cancer progression and prognosis: emphasis on carcinoma-associated fibroblasts and non-small cell lung cancer. J. Thorac. Oncol. 2011;6:209–217. doi: 10.1097/JTO.0b013e3181f8a1bd. - DOI - PubMed
    1. King TE, et al. A phase 3 trial of pirfenidone in patients with idiopathic pulmonary fibrosis. N. Engl. J. Med. 2014;370:2083–2092. doi: 10.1056/NEJMoa1402582. - DOI - PubMed
    1. Richeldi L, et al. Efficacy and safety of nintedanib in idiopathic pulmonary fibrosis. N. Engl. J. Med. 2014;370:2071–2082. doi: 10.1056/NEJMoa1402584. - DOI - PubMed

Publication types

MeSH terms