. 2019 Jan 2;10(1):9.
doi: 10.1038/s41467-018-07911-6.

RORγt inhibition selectively targets IL-17 producing iNKT and γδ-T cells enriched in Spondyloarthritis patients

Affiliations

RORγt inhibition selectively targets IL-17 producing iNKT and γδ-T cells enriched in Spondyloarthritis patients

Koen Venken et al. Nat Commun. .

Abstract

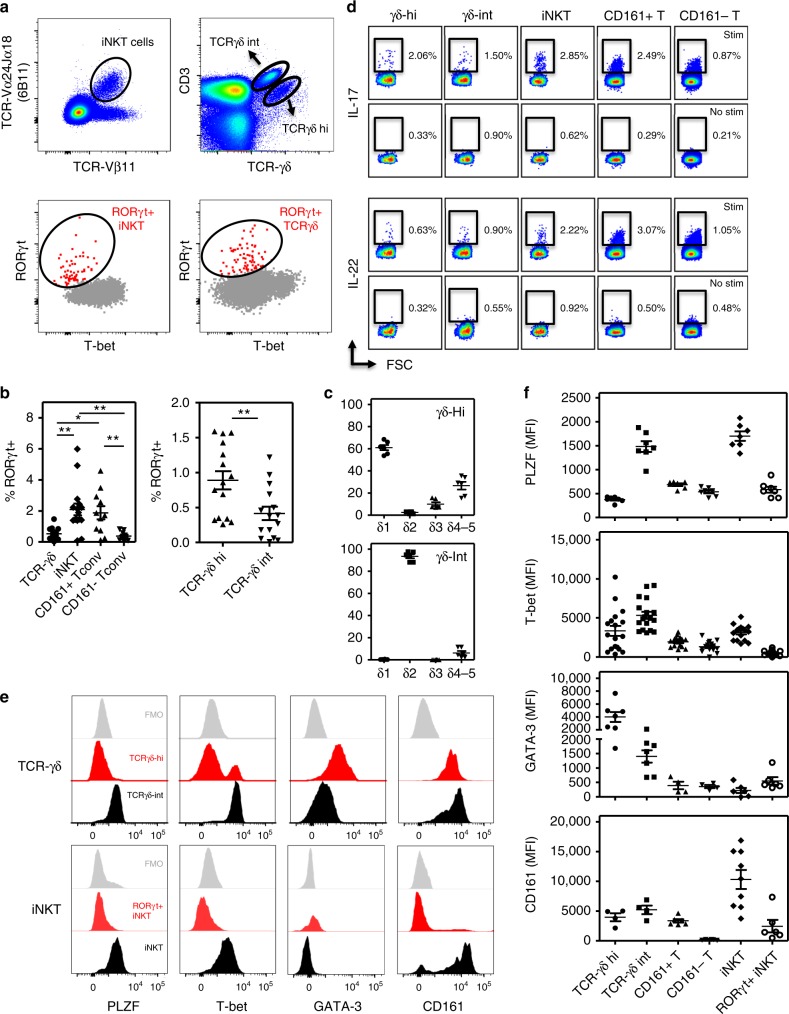
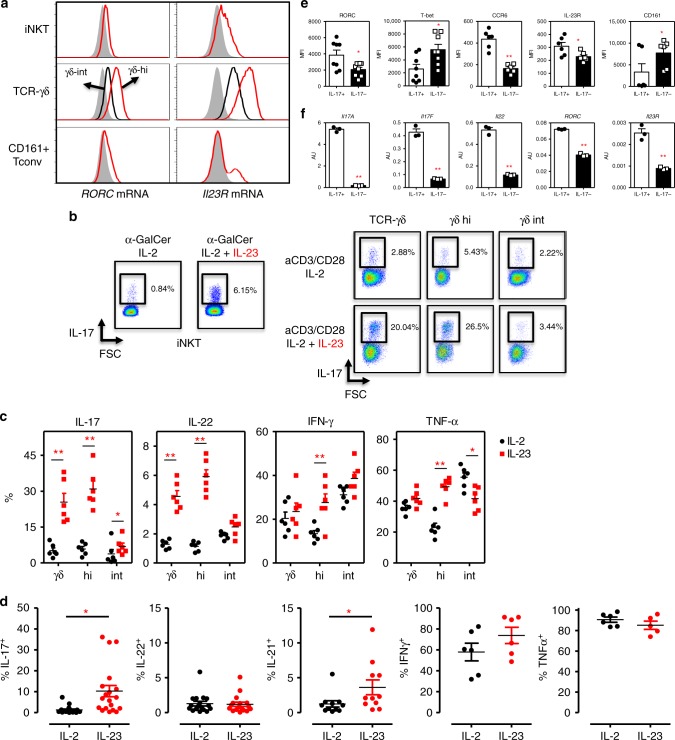
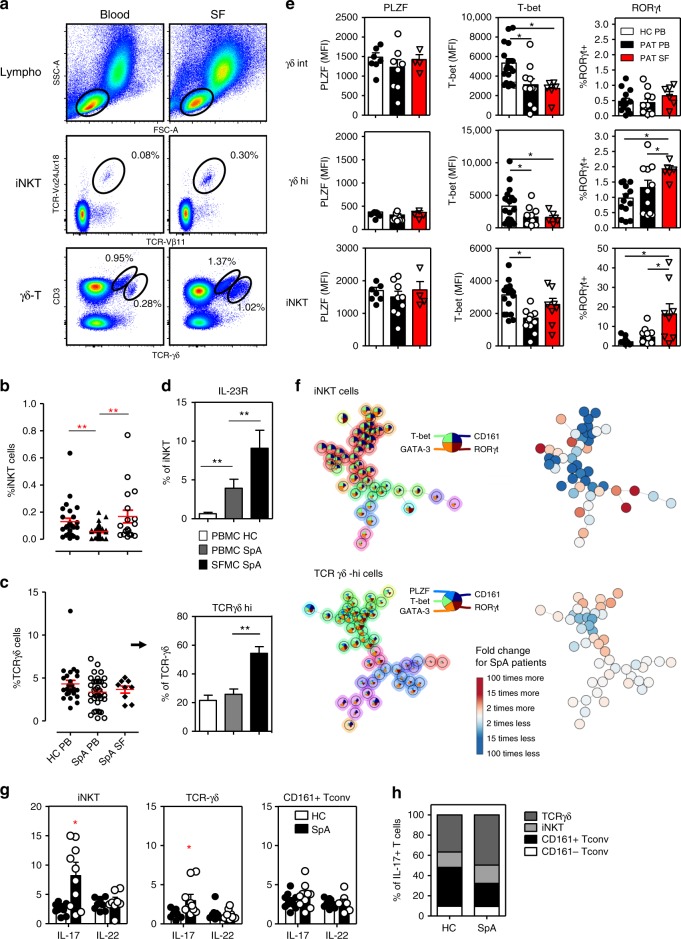
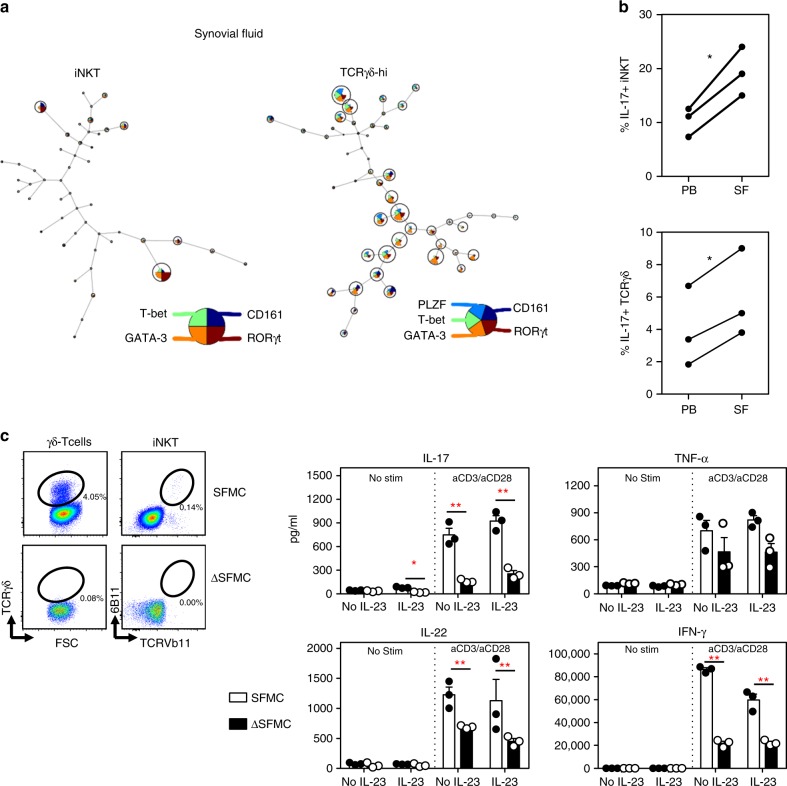
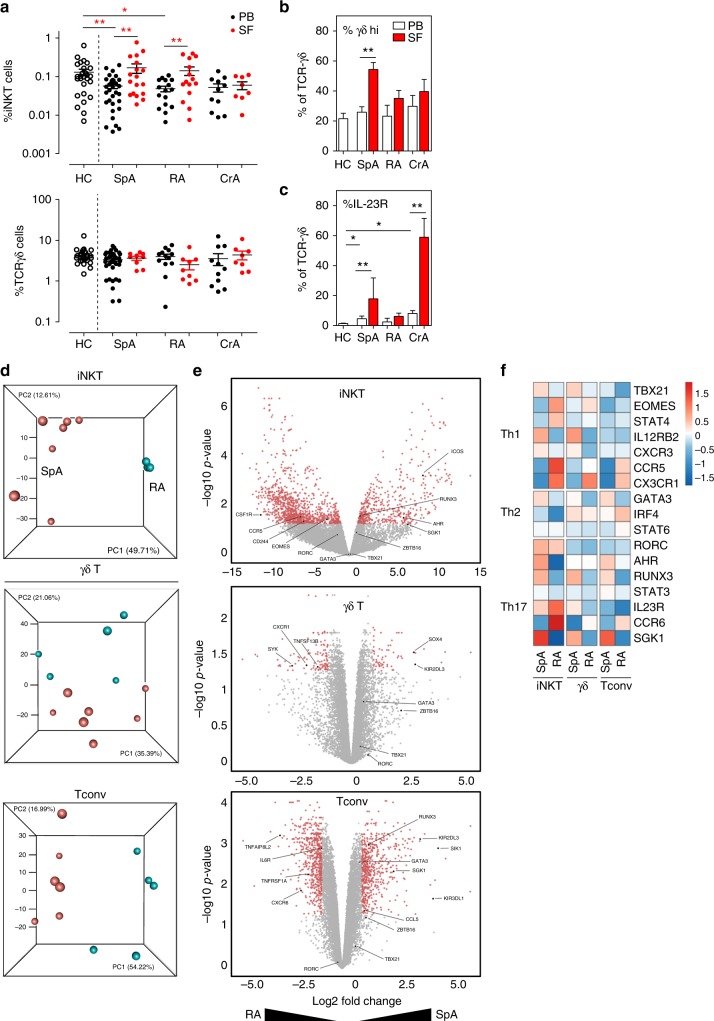
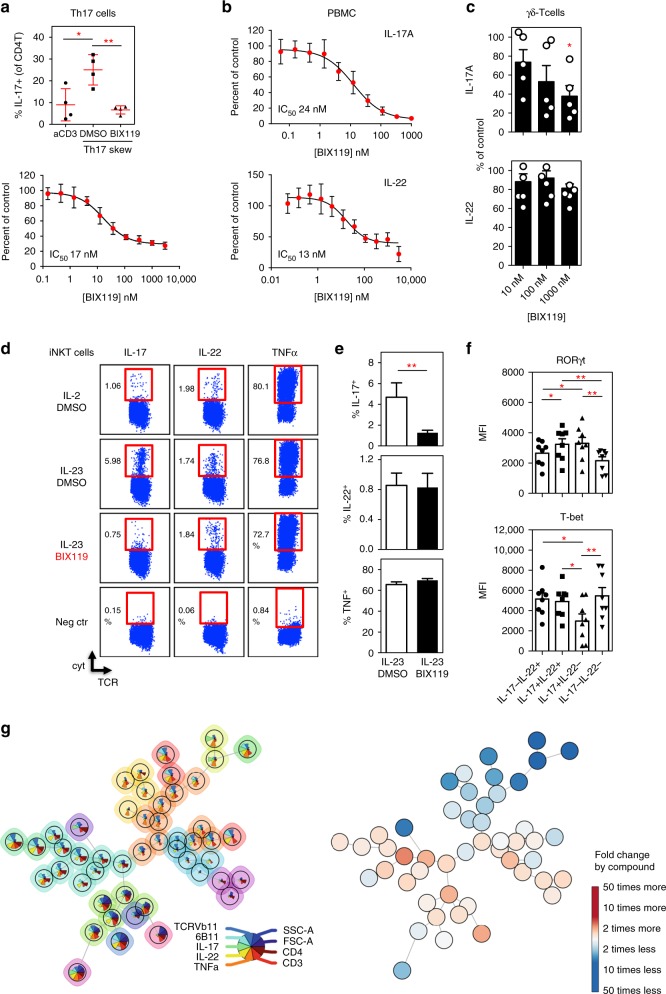
Dysregulated IL-23/IL-17 responses have been linked to psoriatic arthritis and other forms of spondyloarthritides (SpA). RORγt, the key Thelper17 (Th17) cell transcriptional regulator, is also expressed by subsets of innate-like T cells, including invariant natural killer T (iNKT) and γδ-T cells, but their contribution to SpA is still unclear. Here we describe the presence of particular RORγt+T-betloPLZF- iNKT and γδ-hi T cell subsets in healthy peripheral blood. RORγt+ iNKT and γδ-hi T cells show IL-23 mediated Th17-like immune responses and were clearly enriched within inflamed joints of SpA patients where they act as major IL-17 secretors. SpA derived iNKT and γδ-T cells showed unique and Th17-skewed phenotype and gene expression profiles. Strikingly, RORγt inhibition blocked γδ17 and iNKT17 cell function while selectively sparing IL-22+ subsets. Overall, our findings highlight a unique diversity of human RORγt+ T cells and underscore the potential of RORγt antagonism to modulate aberrant type 17 responses.


Conflict of interest statement

The authors declare no competing interests.

Figures

Fig. 1
Fig. 1
Human blood circulating RORγt+ iNKT and γδ-T cells lack expression of PLZF. a Flowcytometric analyses showing distinct subsets of blood circulating RORγt+T-betlo iNKT and total γδ-T cells (flow plots show representative data from a healthy individual). Gating strategy is shown in Supplementary Fig. 1A. b Percentages of RORγt+T-betlo cells in iNKT (n = 16) and γδ-T cells (n = 15) and CD161+ and CD161- Tconv (n = 11) (left panel; *p < 0.05, **p < 0.01 as determined by ANOVA) and in γδ-T cell subsets (right panel; paired t-test). c TCRVδ profiling of indicated γδ-T cells (n = 6). Representative flow plots are shown in Supplementary Fig. 1B (d) IL-17 and IL-22 production by indicated subsets as measured by intracellular cytokine staining after 4 h incubation of PBMC with PMA/CaI/BFA (stim) or BFA alone (no stim). Results from one experiment are shown (representative for n = 6). Summary data are presented in Supplementary Fig. 1C. e Stacked histograms showing expression levels of PLZF, T-bet, GATA-3, and CD161 measured in iNKT and γδ-T cells (one representative example). f MFI values for indicated markers (as indicated in d). Each dot represents data from one healthy individual (PLZF and GATA-3 n = 7; CD161 n = 9, T-bet n = 16). Overview of statistics (ANOVA) is provided in the Supplementary Table 3. Data throughout this figure are presented as mean ± SEM
Fig. 2
Fig. 2
iNKT and γδ-T cells are armed for a competent IL-23 response. a RORC and IL23R mRNA transcripts expressed in iNKT, TCRγδ-hi/int, and CD161+ conventional T cells as measured by PrimeFlow technology (n = 3). Gray histograms represent FMO. Quantitative data are presented in Supplementary Fig. 2B. b PBMC (left) or sorted γδ-T cells were cultured with αGalCer (PBMC, n = 18) or aCD3/aCD28 Abs (γδ-T cells, n = 6), in the presence of IL-2 or IL-2 supplemented with IL-23, IL1β, TGFβ1 to induce IL-17 cytokine response as measured from viable iNKT (6B11+ TCRvβ11 + CD3+ cells) or γδ-T cells (TCRγδ+ CD3+). Flow data from one representative experiment is shown. c, d Quantitative overview of cytokine production measured in γδ-T cell (C; IL-2: black symbols; IL-23: red symbols) and iNKT (D, IL-2 condition: black symbols; IL-23: red symbols) cultures as described in b (IL-23 vs. IL-2 condition, *p < 0.05, **p < 0.01 determined by paired t-tests). e FACS analyses were performed on gated IL17+ and IL17− iNKT cells depicted in experiments described in b (n = 6–8). *p < 0.05, **p < 0.01 determined by paired t-tests (IL-17- cells: black bars; IL-17+: white bars). f qPCR assays on selected target genes, were performed on IL17+ and IL-17− iNKT cells isolated by means of a IL-17 Capture Assay (qPCR, n = 3, Mann-Whitney test). (IL-17- cells: black bars; IL-17+: white bars). Data throughout this figure are presented as mean ± SEM
Fig. 3
Fig. 3
iNKT and γδ-T cells in SpA joints show a profound IL-17 signature. a Flowcytometric analyses of iNKT and γδ-T cells in paired PBMC and SFMC derived from a representative SpA patient. b Mean percentage (±SEM) of iNKT cells (relative to total CD3+ T cells) measured in PBMC (SpA, n = 33; HC, n = 27) and SFMC (SpA, n = 18) samples (**p < 0.01 as determined by ANOVA). c Frequency of γδ-T cells and TCRγδ-hi cells (relative to total CD3+ T cells and γδ-T cells, respectively) in PBMC and SFMC samples (ANOVA). d Mean percentage IL-23R+ cells (relative to iNKT cells) measured in PBMC and SFMC samples from B (ANOVA). e Transcriptional factor profile of iNKT cells and γδ-T cells measured in PBMC and SFMC from SpA patients (PB n = 8-12, SF n = 4-8) and HC (n = 8-16). (*p < 0.05 as determined by ANOVA) (HC-PB: white bars, SpA-PB: black bars, SpA-SF: Red bars). f FlowSOM visualization of indicated immune cell population present in the peripheral blood of HC (n = 8) and SpA patients (n = 8), stained for markers indicated in the pie chart. Each circle represents a specific marker combination, corresponding to a specific cell type. The mean marker values are visualized for each node, using star charts. The height of each part indicates the expression intensity: if the part reaches the border of the circle, the cells have a high expression for that marker. The nodes are connected to the ones they are the most similar to. An automatic meta-clustering of the FlowSOM nodes is visualized by the background color of groups of nodes. A parallel tree gives an overview of significantly over-(red) or under-(blue) represented cell types in SpA patients vs. controls. g IL-17 and IL-22 production by peripheral blood iNKT and γδ-T cells from SpA patients (n = 10; black bars) and controls (n = 10, white bars) as measured by intracellular cytokine staining after 4 h incubation of cells with PMA/CaI in the presence of BFA (*p < 0.05, t-tests HC vs. SpA). h Relative representation of indicated peripheral blood T cell subsets among IL-17 producing T cells as measured in PMA/CaI stimulated PBMC from HC and SpA patients (see Supplementary Fig. 6A for individual data points and statistics). Data throughout this figure are presented as mean ± SEM unless stated otherwise
Fig. 4
Fig. 4
iNKT and γδ-T cells are a major source of T cell derived IL-17 in SpA joints. a FlowSOM visualization of iNKT and γδ-hi T cells present in synovial fluid samples from three treatment naïve SpA patients, stained for the indicated markers set (as explained in Fig. 3F). Nodes show cell subsets (including RORγt + cells) enriched in the synovial fluid (compared to cells from paired blood samples). Other subsets (nodes) are present but at a relatively lower frequencies. b Paired analyses of IL-17 production by SpA SF and blood derived iNKT and γδ-T cells as determined in Fig. 3G. (*p < 0.05, paired t-tests). c Synovial fluid derived mononuclear cells (SFMC) and SFMC cells depleted of iNKT and TCRγδ cells (ΔSFMC, illustrated in the plots) were cultured in the presence or absence of IL-23 combined with or without aCD3Ab/aCD28Ab stimulation. Supernatants were collected at 72 h of culture and cytokines production was measured by ELISA (SFMC vs. ΔSFMC; *p < 0.05, **p < 0.01 two-way ANOVA). Results from one experiment are shown (Representative for a total of three independent experiments using SF samples from 3 SpA patients). SFMC data (white bars), ΔSFMC (black bars). Data throughout this figure are presented as mean ± SEM
Fig. 5
Fig. 5
iNKT and γδ-T cells show different gene expression profiles in SpA and RA patients. a Frequencies of iNKT and γδ-T cells in indicated groups of rheumatic patients (each dot represents data from a single patient). Statistical analyses (*p < 0.05, **p < 0.01) referred to comparisons of blood samples (patients vs. controls) and comparisons of SF as compared to paired blood samples of patients as done by ANOVA and paired t-tests, respectively (same for b and c). (PB: black symbols; SF: red symbols) b Relative percentage of TCRγδ-hi cells and c IL-23R (lower panel) in γδ-T cells of samples taken from patients and controls. (PB: white bars; SF: red bars) d Principal component analysis (PCA) of transcriptomes (RNAseq data) of iNKT, γδ-T and Tconv cells sorted from SpA (n = 7, red) and RA patients (n = 5, blue). Each sphere symbol represents an individual patient. e Differentially expressed genes are represented in Volcano plots after pairwise comparisons between indicated subsets of SpA and RA patients. Each symbol represents a single gene and genes of interest are highlighted (see also main text). Color coding refers to differentially expressed genes with adjusted p-value less than 0.05 and the log2FC less than −1 (higher expressed in RA derived cells) or greater than 1 (higher expressed in SpA). f Heatmap showing relative expression Th1, Th2, and Th17 related genes in indicated cell subsets from SpA and RA patients. Data throughout this figure are presented as mean ± SEM
Fig. 6
Fig. 6
RORC inhibition selectively blocks innate-like T cell function. a Upper panel: healthy donor CD4+ T cells cultured under Th17 conditions for 7 days. Data is represented as % IL-17+ cells as determined by intracellular flow cytometry (n = 4). (*p < 0.05, **p < 0.01 as determined by ANOVA). Lower panel: Skewed CD4+ Th17 cells were re-stimulated under Th17 conditions for 48 h and IL-17 levels were measured in the supernatants. Dose response of the RORγt antagonist (BIX119) for three donors is shown. b Human PBMC activated with aCD3Ab and IL-23 for 72 h. Dose response of the RORγt antagonist is shown for IL-17A and IL-22 secretion detected in culture supernatants by ELISA (n = 3). c γδ-T cells were activated with anti-CD3/CD28 beads and IL-23 cocktail for four days to produce IL-17A and IL-22 in the presence of increasing concentrations of RORγt antagonist BIX119 (n = 5). *p < 0.05 as compared to no compound (ANOVA) (d) PBMC were stimulated with αGalCer in the presence of IL-2 or IL-23 cocktail with addition of BIX119 (1 µM) or DMSO. After 14 days, cells were restimulated with PMA/CaI (with BFA) for intracellular cytokine detection. One example representative for three independent experiments is shown. The negative control (neg ctr) consisted of IL-23 skewed cells cultured in BFA alone. e quantitative overview of frequency of IL-17, IL-22 and TNFα+ iNKT cells from assays described in D (**p < 0.01 by paired t-tests). f IL-23 skewed iNKT cells were analyzed for RORγt and T-bet expression by intranuclear flow cytometry. Gating on cytokine producing iNKT cells was performed as illustrated in supplementary figure 7C (*p < 0.05, **p < 0.01 ANOVA). g FlowSOM visualization (as explained in Fig. 3F) of IL-23 skewed human iNKT cells (n = 3), cultured in the presence or absence of the BIX119 RORγt antagonist (compound). Pie chart shows markers used for automated clustering of iNKT cell types. Data throughout this figure are presented as mean ± SEM

References

    1. Rudwaleit M, et al. The Assessment of Spondylo Arthritis International Society classification criteria for peripheral spondyloarthritis and for spondyloarthritis in general. Ann. Rheum. Dis. 2011;70:25–31. doi: 10.1136/ard.2010.133645. - DOI - PubMed
    1. Jacques P, Elewaut D. Joint expedition: linking gut inflammation to arthritis. Mucosal Immunol. 2008;1:364–371. doi: 10.1038/mi.2008.24. - DOI - PubMed
    1. Venken K, Elewaut D. IL-23 responsive innate-like T cells in spondyloarthritis: the less frequent they are, the more vital they appear. Curr. Rheumatol. Rep. 2015;17:30. doi: 10.1007/s11926-015-0507-2. - DOI - PubMed
    1. Baeten D, et al. Secukinumab, an interleukin-17A inhibitor, in ankylosing spondylitis. N. Engl. J. Med. 2015;373:2534–2548. doi: 10.1056/NEJMoa1505066. - DOI - PubMed
    1. Baeten, D. et al. Risankizumab, an IL-23 inhibitor, for ankylosing spondylitis: results of a randomised, double-blind, placebo-controlled, proof-of-concept, dose-finding phase 2 study. Ann. Rheumatic Dis.77, 1295–1302 (2018). - PMC - PubMed

Publication types

MeSH terms

Substances