. 2019 Jan;565(7738):251-254.
doi: 10.1038/s41586-018-0836-1. Epub 2019 Jan 2.

Genomic encoding of transcriptional burst kinetics

Affiliations

Genomic encoding of transcriptional burst kinetics

Anton J M Larsson et al. Nature. 2019 Jan.

Abstract

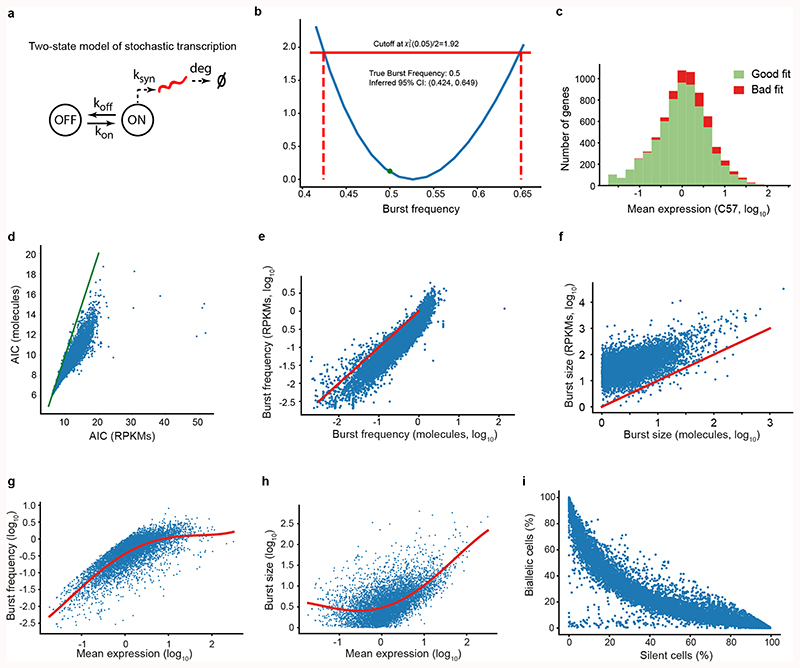
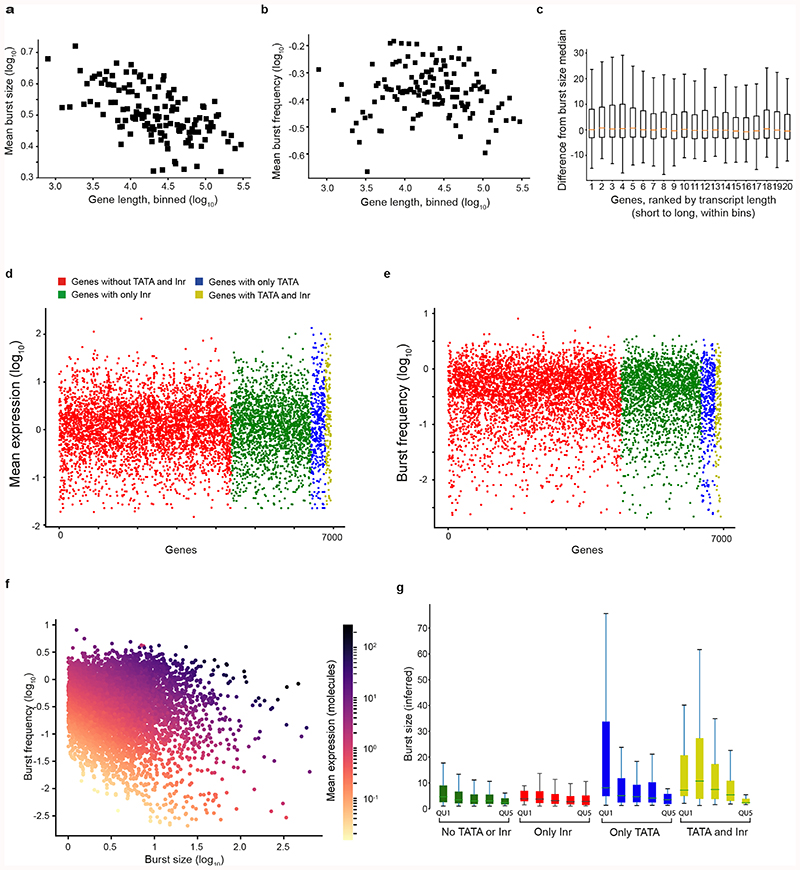
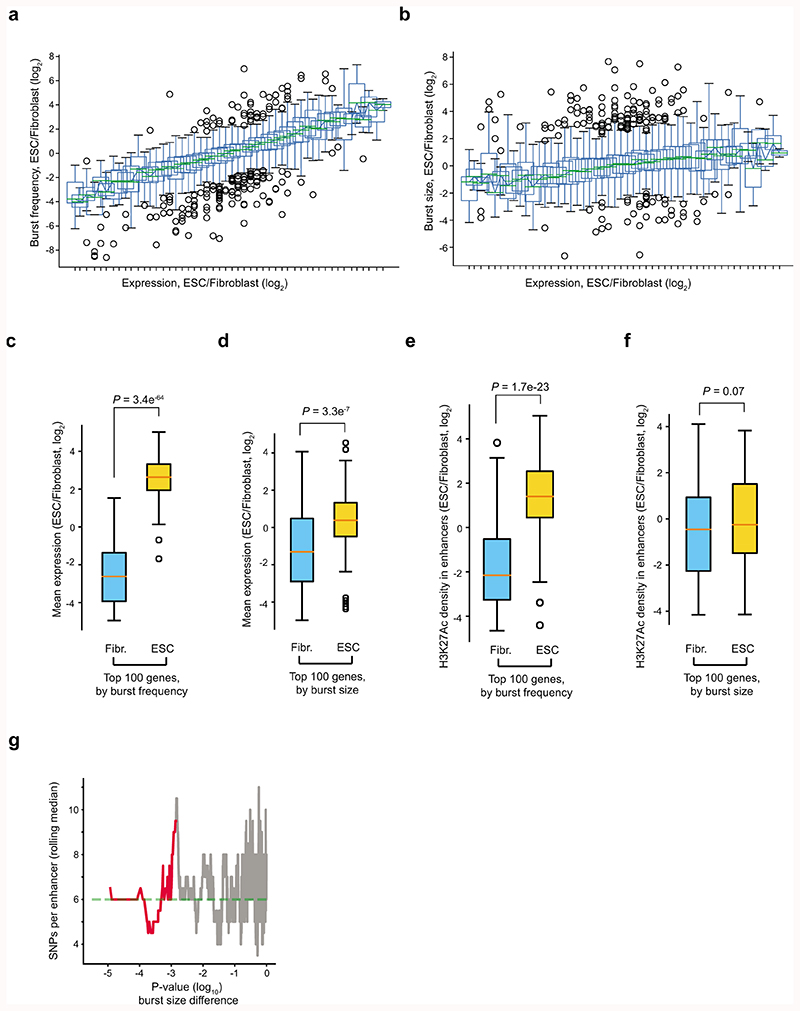
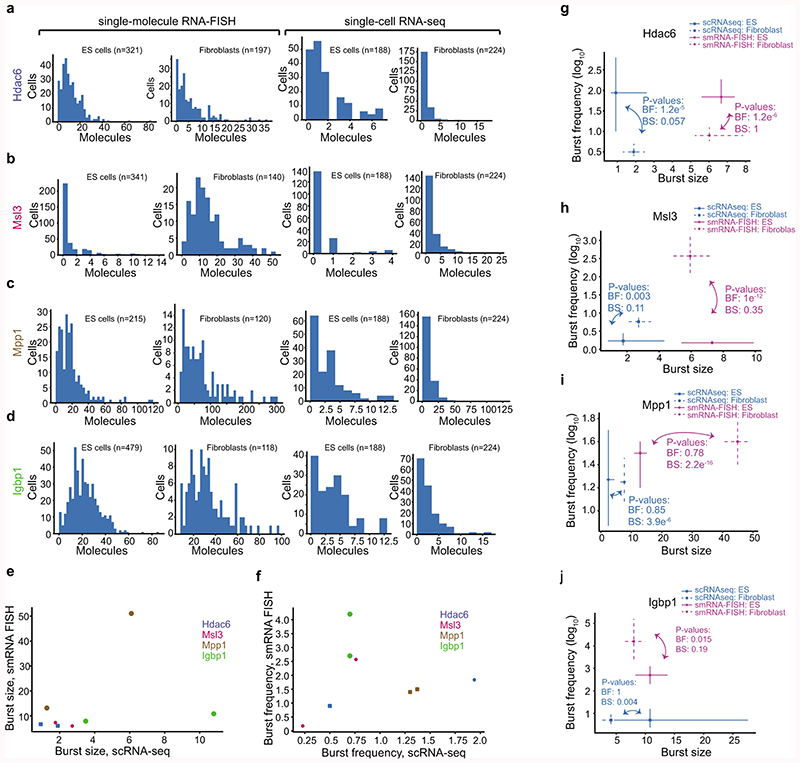
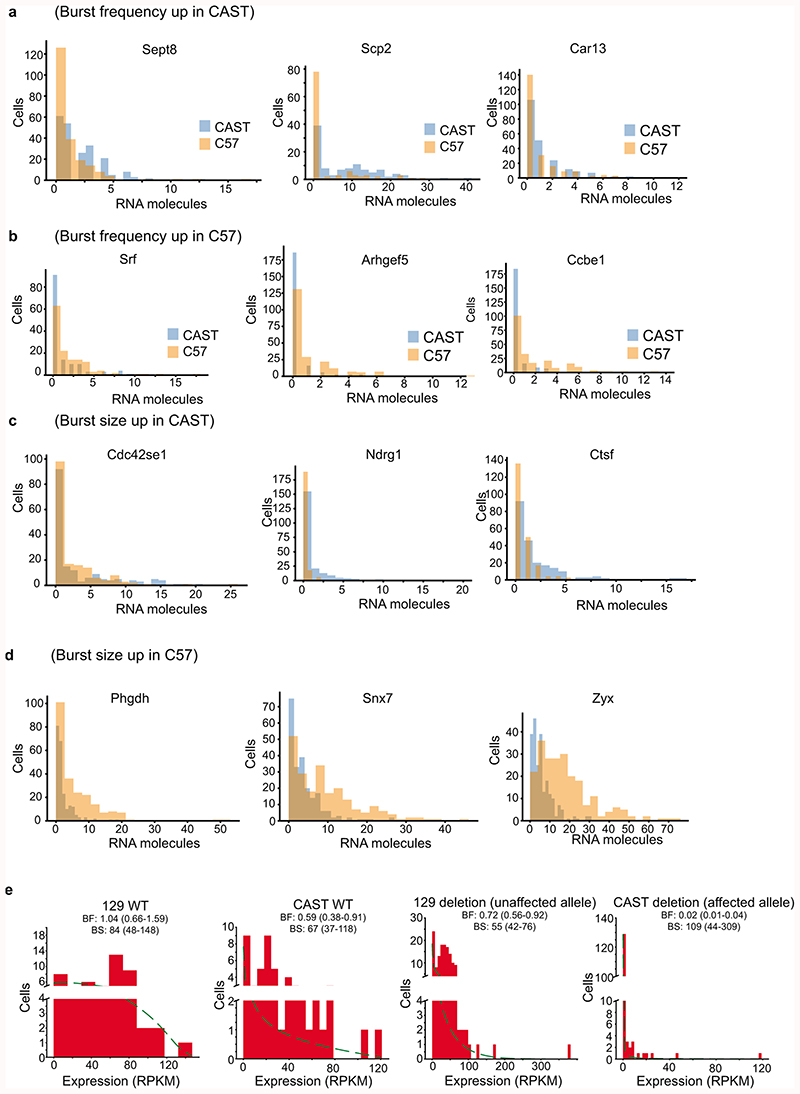
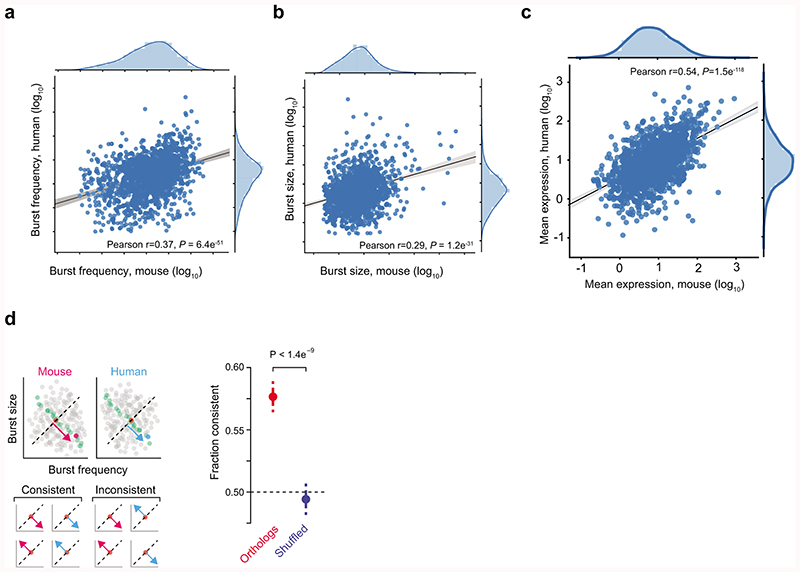
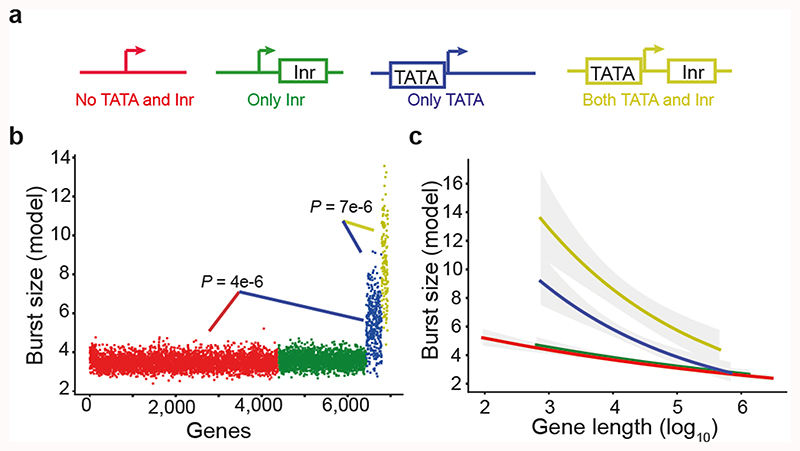
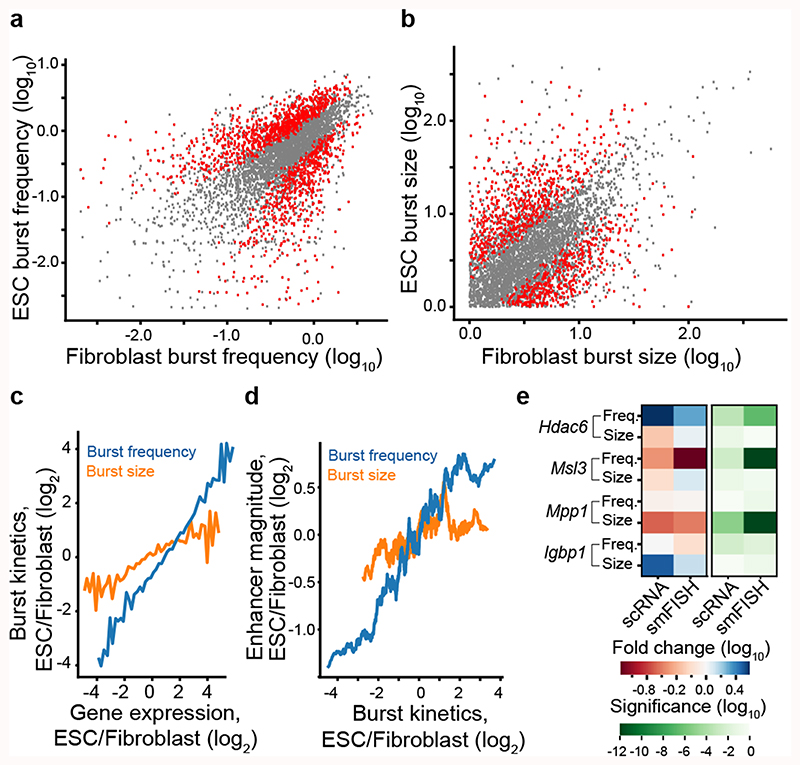
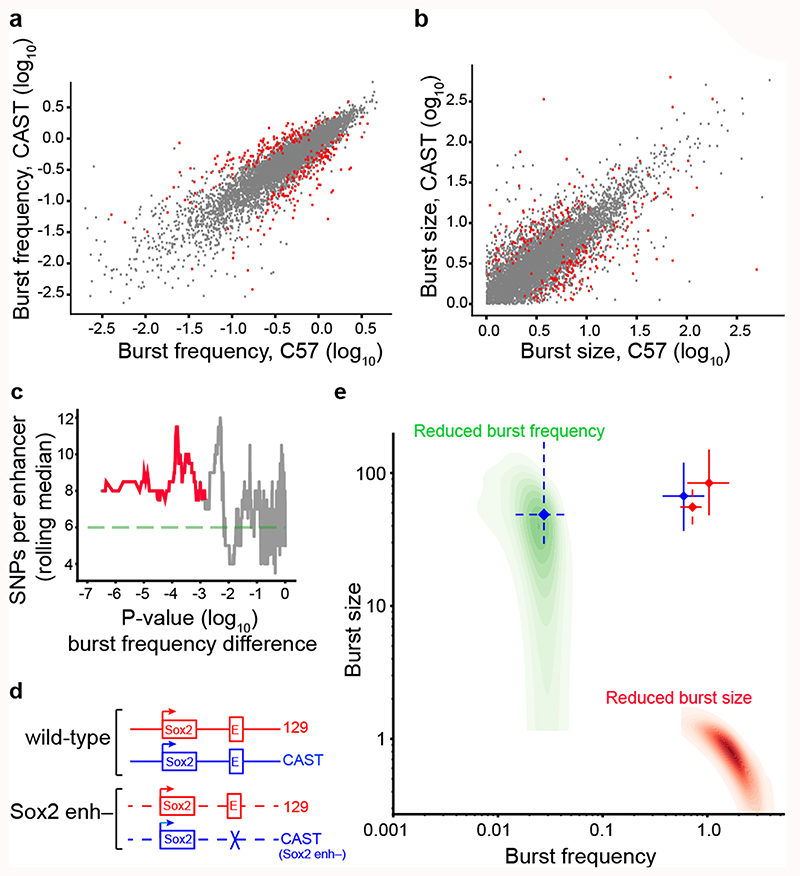
Mammalian gene expression is inherently stochastic1,2, and results in discrete bursts of RNA molecules that are synthesized from each allele3-7. Although transcription is known to be regulated by promoters and enhancers, it is unclear how cis-regulatory sequences encode transcriptional burst kinetics. Characterization of transcriptional bursting, including the burst size and frequency, has mainly relied on live-cell4,6,8 or single-molecule RNA fluorescence in situ hybridization3,5,8,9 recordings of selected loci. Here we determine transcriptome-wide burst frequencies and sizes for endogenous mouse and human genes using allele-sensitive single-cell RNA sequencing. We show that core promoter elements affect burst size and uncover synergistic effects between TATA and initiator elements, which were masked at mean expression levels. Notably, we provide transcriptome-wide evidence that enhancers control burst frequencies, and demonstrate that cell-type-specific gene expression is primarily shaped by changes in burst frequencies. Together, our data show that burst frequency is primarily encoded in enhancers and burst size in core promoters, and that allelic single-cell RNA sequencing is a powerful model for investigating transcriptional kinetics.


Conflict of interest statement

Competing financial interests. The authors declare no competing financial interests.

Figures

Extended Data Figure 1
Extended Data Figure 1. Using profile likelihood to infer transcriptional burst kinetics.
(a) Illustration of the two state-model of transcription. The promoter can be in an ON or OFF state and converts from OFF to ON with a rate kon, and from ON to OFF with rate koff. In the ON state, RNAs are transcribed with rate ksyn and degraded with rate deg. Please see more details in the Methods section. (b) Derivation of a confidence interval for a simulated set of observations with a given burst frequency = 0.5 (n = 200 simulated observations). The quadratic function shown in blue is a transformed version of the log-likelihood as a function of burst frequency, where the most likely parameter value has a likelihood of 0. Standard theory for likelihood methods gives a cutoff value of 1.92 for a 95% confidence interval (solid red line), which can then be traced down to their corresponding value on the x-axis (dashed red lines) to derive a confidence interval. The true value, shown as a green dot, is within the confidence interval. (c) Goodness of fit test for 7,382 genes on the CAST allele of the fibroblast cells (from molecular level input data). The histogram shows the mean expression levels of genes with a good (green) or bad (red) fit (Methods). (d) A scatter plot of the Akaike information criterion (AIC) for the inference obtain from molecule (UMIs) and RPKM values. The green line shown where y=x. (e-f) Scatter plot of the burst frequency and size obtained from inference procedure based on either molecules (UMIs) or RPKM values. (g) Scatter plot of mean expression against inferred burst frequency for all genes in fibroblasts. Red line denotes spline fitted to data. (h) Scatter plot of mean expression against inferred burst size for all genes in fibroblasts. Red line denotes spline fitted to data. (g-h) used the CAST allele. (i) Scatterplot of the percentage of biallelic to silent cells for 10,727 genes, in fibroblasts. The genes are located on the expected curve under the independence model (see Methods and Deng et al. Science 2014 for details).
Extended Data Figure 2
Extended Data Figure 2. Robustness of inference to cell numbers and technical noise in single-cell RNA-seq.
The distribution of inferred burst frequency and sizes as a function of sensitivity (loss of RNA molecules) and cell numbers, based on the location of the parameters in the kinetics parameter space (A-J). Center: Median, Hinges: 1st and 3rd quartiles, Whiskers: 1.5 interquartile range (IQR). Based on 50 simulations for each unique combination of parameters and 100 cells for the sensitivity calculations. Inferred burst sizes were divided by the sensitivity used in simulation (as the inferred burst size scales linearly with sensitivity).
Extended Data Figure 3
Extended Data Figure 3. Gene length effect on burst size and frequency and the effect of core promoter elements on mean expression and burst frequency.
(a-b)Scatter plots of median burst size (a) and frequency (b) compared to median gene length. Genes were binned genes (30 genes per bin). (c) Boxplot of genes binned according to gene loci length (20 genes per group). For each bin, we ranked genes in bin according to their transcript lengths and calculated the gene-level difference to the median burst size of that bin. We see no effect from differing transcript lengths in estimated burst size. Center: Median, Hinges: 1st and 3rd quartiles, Whiskers: 1.5 interquartile range (IQR). (d-e) Mean expression (d) and burst frequency (e), ordered and colored for genes based on their core promoter elements. (Complementing the analysis presented in Fig. 2b but with mean expression and burst frequency as dependent variables). The result of the linear regressions are presented in Supplementary Table 1 (n = 7,186 genes). (f) Scatter plot of burst frequency and size of genes with each dot color by their mean expression level. (g) Boxplots showing the inferred burst size for genes separated according to the presence of core promoter elements, and further grouped into 5 equally sized bins (quintiles, QU1-QU5) according to gene loci lengths. No TATA or Inr: n = 4397 genes (2585, 1124, 635, 36, 17 in each quintile respectively), Only Inr: n = 2035 genes (942, 531, 442, 74, 46 in each quintile respectively), Only TATA: n = 359 genes (129, 126, 58, 31, 15 in each quintile respectively), TATA and Inr: n = 144 genes (53, 45, 24, 19, 3 in each quintile respectively). Center: Median, Hinges: 1st and 3rd quartiles, Whiskers: 1.5 interquartile range (IQR).
Extended Data Figure 4
Extended Data Figure 4. Power analysis in different locations of kinetic parameter space.
The power of detecting 4-fold changes in burst frequency and size as a function of the number of cells depending on the location of transcriptional burst kinetic parameters in parameter space (A-J). Upper panels: Analysis of power for burst frequency and size in indicated location in parameter space. Lower panels: Histogram with expression distributions over cells at the different locations in parameter space.
Extended Data Figure 5
Extended Data Figure 5. Comparison of transcriptional burst kinetics across cell types.
(a-b) Boxplot visualization of cell-type differences in burst frequency and size, as a function of fold changes in mean expression between cell types, as in Fig. 3c. Center: Median, Hinges: 1st and 3rd quartiles, Whiskers: 1.5 interquartile range (IQR). (c-d) Boxplots of the fold change in mean expression for the top 100 genes in each direction for burst frequency and size, respectively (n = 100 genes in each group, two-sided t-test). Center: Median, Hinges: 1st and 3rd quartiles, Whiskers: 1.5 interquartile range (IQR). (e-f) Boxplots of the fold change in normalized read density of H3K27Ac in enhancers (Enhancer magnitude) between cell types. Enhancer linked to genes that had top 100 changes in either burst frequency and size (n = 100 genes in each group, two-sided t-test). Center: Median, Hinges: 1st and 3rd quartiles, Whiskers: 1.5 interquartile range (IQR). (g) Rolling median (n=50) of SNPs per enhancer ordered by the p-value of burst size difference between the CAST and C57 allele in fibroblast cells (profile likelihood test, no adjustment for multiple comparisons).
Extended Data Figure 6
Extended Data Figure 6. Representative images for cell identification and RNA transcript quantification using single-molecule RNA-FISH.
(a-b) Two representative cells for the detection of Msl3 in (a) male fibroblast and (b) male embryonic stem cell (from 140 fibroblasts and 341 ES cells). From left to right: probe detection (Q570), antibody detection (Cy5), Dapi, and identified RNA transcripts.
Extended Data Figure 7
Extended Data Figure 7. Expression distributions and inferred kinetics from single-molecular RNA-FISH and scRNA-seq.
(a-d) Histograms of the expression distributions of genes measured by smFISH and scRNA-seq for genes: Hdac6 (a), Msl3 (b), Mpp1 (c) and Igbp1 (d). Left panel is sm RNA FISH and right panel is scRNA-seq. The number of cells quantified for each gene, cell type and method is presented above each figure item. (e-f) Scatter plots of burst size (e) and frequency (f) inferred based on data from scRNA-seq and smFISH. Data from both fibroblasts and ES cells are shown. Although the number of data points are few and the data do not allow for a systematic comparison between methods, we observed a few trends. There was a good agreement for both burst size and frequency except for the gene Igbp1 that is an outlier in both scatterplots. Igbp1 has increased burst size and lower burst frequency in scRNA-seq compared to smRNA FISH. Excluding Igbp1, we do see a fairly linear correspondence between methods over the remaining 6 data points (3 genes and two cell types). (g-j) Point estimates and confidence intervals shown for each gene, cell type and method based on the profile likelihood method. Number of cells used for the inference is shown in the corresponding histogram in (a-d). P-values for cell-type comparison in burst kinetics is shown per method based on the profile likelihood test.
Extended Data Figure 8
Extended Data Figure 8. Expression distributions for genes with significant strain-differences in burst kinetics.
(a-d) Histograms of the expression distributions for the CAST and C57 alleles in fibroblasts for genes with burst frequency significantly up in CAST (a) and C57 (b), burst size significantly up in CAST (c) and C57 (d). (e) Expression distributions for the 129 and CAST alleles in the wild-type mESCs and mESCs harbouring a CAST-lined deletion of a Sox2 enhancer.
Extended Data Figure 9
Extended Data Figure 9. Conservation of transcriptional kinetics in mouse and human.
(a) Scatter plot of burst frequency between one-to-one orthologs of mouse and human (n = 1,609 genes). (b) Scatter plot of burst size between one-to-one orthologs of mouse and human (n = 1,609 genes). (c) Scatter plot of mean expression between one-to-one orthologs of mouse and human (n = 1,609 genes). (d) Left: Illustrating the test for conservation beyond mean expression level. In both mouse and human, the ortholog is compared to 50 genes of similar mean expression (7 genes in cartoon) and we determine whether the location on the diagonal is consistent relative to the median gene in both species. Right: The fraction of one-to-one orthologs genes (red) and shuffled orthologs (blue) with consistent positioning in transcriptional kinetics space (binomial test, based on 1,609 genes). The error bars denote standard deviations. The limited numbers of cells and the use of RPKM-based transcriptional burst kinetics inference could underestimate the degree of conservation in transcriptional burst kinetics.
Extended Data Figure 10
Extended Data Figure 10. Inference of kinetics in different phases of the cell cycle.
Comparisons of inferred burst frequency and size for the C57 allele in fibroblasts with cells classified according to cell cycle phase. Scatter plots of burst frequency and size are shown for comparisons between S and G1 (a) and S and G2M (c). The GO-terms which are enriched in the group of genes with significant differential burst frequency are shown in (b) and (d) respectively (n = 116 genes with differential burst frequency in b and 75 genes in d).
Figure 1
Figure 1. Transcriptome-wide inference of transcriptional burst kinetics.
(a) Allele-resolution kinetics inferred from scRNA-seq data. The total expression for the Mbln2 gene (top) was separated into allelic expression (paternal: middle, maternal: bottom). Inference was performed independently on total expression and allele-level expression to illustrate that allele-level inference has the required resolution, with expression measured as observed RNA molecules. (b) Inferred burst kinetics for each gene (CAST allele) in primary fibroblasts (red dots, 6,298 genes). Blue contours indicate the inference precision defined as the width of the confidence interval divided by the point estimate from simulated observations (Methods). Burst size in units of observed RNA molecules. (c) Histogram of inferred burst frequencies for CAST allele in primary fibroblasts, in time-scale of mean mRNA degradation rate. (d) Histogram of inferred burst sizes (observed RNA molecules) for CAST allele in primary fibroblasts. (e) Scatter plot comparing inferred burst frequencies with gene-specific mRNA degradation rates (x-axis) against inferred burst frequencies that did not utilize mRNA degradation rates (using the average degradation rate for all genes). Genes with the 50 longest (green) and shortest (red) mRNA degradation rates are marked. Data from ES cells and CAST allele. (f) Histogram of allele-level waiting times between bursts (data from ES cells and CAST allele). (g) Scatter plot showing the inferred gene inactivation (koff) and activation (kon) rates, highlighting that genes have higher koff than kon. Data from fibroblast and CAST allele.
Figure 2
Figure 2. Core promoter elements dictate transcriptional burst size.
(a) Illustration of gene categorization (and coloring) according to TATA and Inr elements in core promoters. (b) Burst size (from linear model) for genes, ordered and colored based on core promoter elements (n = 6,935 genes, F-test). (c) The dependency between burst size and gene length for the gene categories. Burst size prediction from linear model with the shaded areas showing the 95% confidence intervals for the prediction, genes ordered (ascending) according to gene length.
Figure 3
Figure 3. Enhancers regulate burst frequencies to shape cell-type specific expression.
Scatter plots of transcriptome-wide inferred transcriptional burst frequencies (a) and sizes (b) in mouse embryonic stem cells (mESC) and adult tail fibroblasts (n = 4,854 genes). Genes with significant differences (profile likelihood test, FDR<0.05) between cell types are marked in red. (c) Graph depicting cell-type differences in burst frequency and size, as a function of fold changes in mean expression between cell types. Lines represent median fold change in burst size and frequency between cell types for genes binned by expression difference (n genes per bin = 100). (d) Graph depicting cell-type differences in enhancer magnitude (H3K27Ac read densities in enhancers) for genes ordered by cell-type differences in either burst frequency or size. Computed as a rolling median in groups of 200 genes. (e) Validation of scRNA-seq inferred cell-type differences in transcriptional burst kinetics by single-molecule RNA FISH on four genes (Hdac6, Msl3, Mpp1 and Igbp1). The left heatmap denote effect size and direction of change, whereas the right heatmap shows the significance level of cell-type difference in burst kinetics, separated by method, gene and burst kinetic parameter (profile likelihood test). For more information see Extended Data Fig. 7.
Figure 4
Figure 4. Altered burst frequencies by enhancer polymorphisms and deletion.
Scatter plots of the burst frequency (a) and burst size (b) inferred for the CAST/EiJ and C57BL/6J alleles in fibroblasts (n = 5,491 genes). Genes with significant differences (FDR<0.05, profile likelihood test) between genotypes are marked red. (c) SNP density in the enhancers of genes with differential burst frequencies were significantly higher (two-sample t-test). We display the rolling median (n=50) of SNPs per enhancer ordered by the p-value of a burst frequency difference between CAST and C57 (profile likelihood test, no adjustment for multiple comparisons). (d) An illustration of the genetic deletion of the distal Sox2 enhancer. (e) Inferred point estimates of burst frequency and size with 95% confidence intervals for both the 129SvEv (red) and CAST/EiJ (blue) allele in wild type mESCs (solid, n = 57 cells) and after Sox2 enhancer deletion (dashed, n = 174 cells) on the CAST allele. Simulated cases of expression reduced by a drop in burst frequency and size are shown in green and red respectively.

Comment in

Similar articles

Cited by

References

    1. Levine M, Tjian R. Transcription regulation and animal diversity. Nature. 2003;424:147–151. - PubMed
    1. Raj A, van Oudenaarden A. Nature, nurture, or chance: stochastic gene expression and its consequences. Cell. 2008;135:216–226. - PMC - PubMed
    1. Raj A, Peskin CS, Tranchina D, Vargas DY, Tyagi S. Stochastic mRNA synthesis in mammalian cells. PLoS Biol. 2006;4:e309. - PMC - PubMed
    1. Chubb JR, Trcek T, Shenoy SM, Singer RH. Transcriptional pulsing of a developmental gene. Curr Biol. 2006;16:1018–1025. - PMC - PubMed
    1. Levsky JM, Shenoy SM, Pezo RC, Singer RH. Single-cell gene expression profiling. Science. 2002;297:836–840. - PubMed

Publication types

MeSH terms