. 2019 Jan;565(7738):230-233.
doi: 10.1038/s41586-018-0818-3. Epub 2019 Jan 2.

Genomic insights into the 2016-2017 cholera epidemic in Yemen

Affiliations

Genomic insights into the 2016-2017 cholera epidemic in Yemen

François-Xavier Weill et al. Nature. 2019 Jan.

Erratum in

  • Publisher Correction: Genomic insights into the 2016-2017 cholera epidemic in Yemen.
    Weill FX, Domman D, Njamkepo E, Almesbahi AA, Naji M, Nasher SS, Rakesh A, Assiri AM, Sharma NC, Kariuki S, Pourshafie MR, Rauzier J, Abubakar A, Carter JY, Wamala JF, Seguin C, Bouchier C, Malliavin T, Bakhshi B, Abulmaali HHN, Kumar D, Njoroge SM, Malik MR, Kiiru J, Luquero FJ, Azman AS, Ramamurthy T, Thomson NR, Quilici ML. Weill FX, et al. Nature. 2019 Feb;566(7745):E14. doi: 10.1038/s41586-019-0966-0. Nature. 2019. PMID: 30755740

Abstract

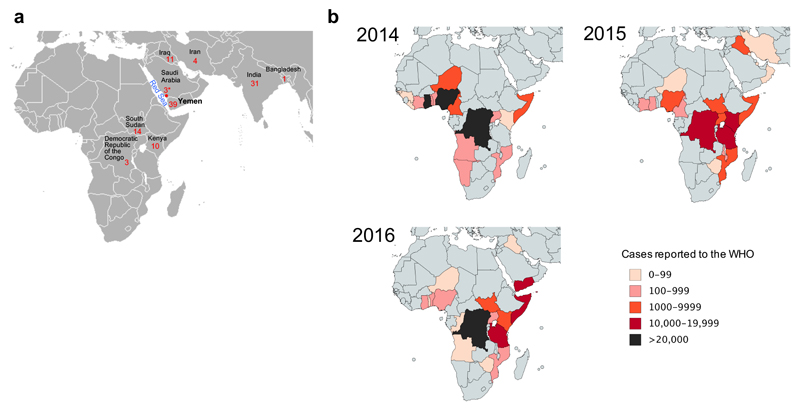
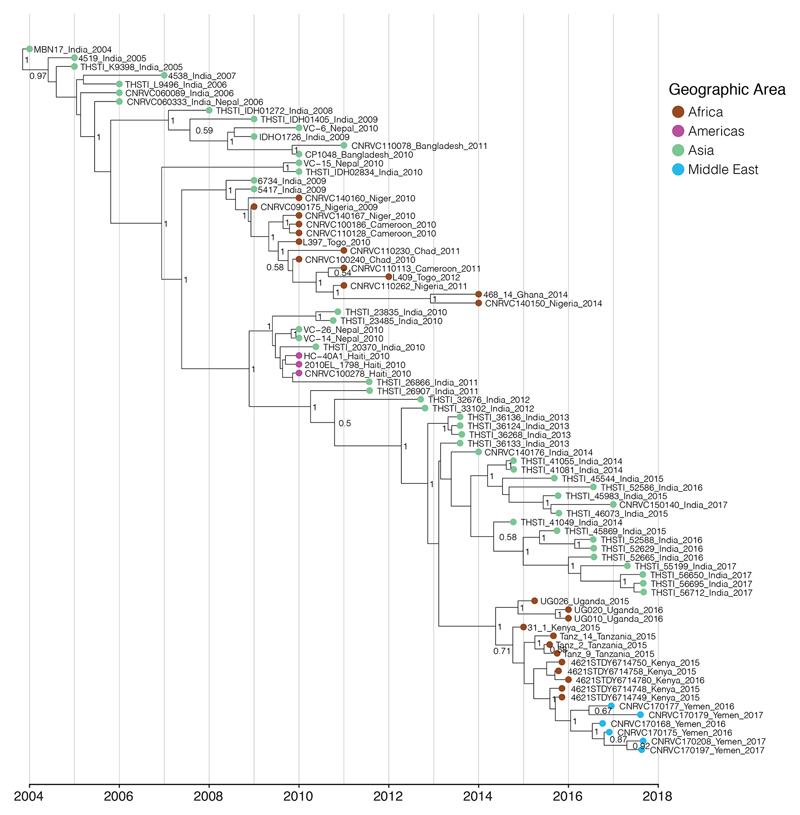
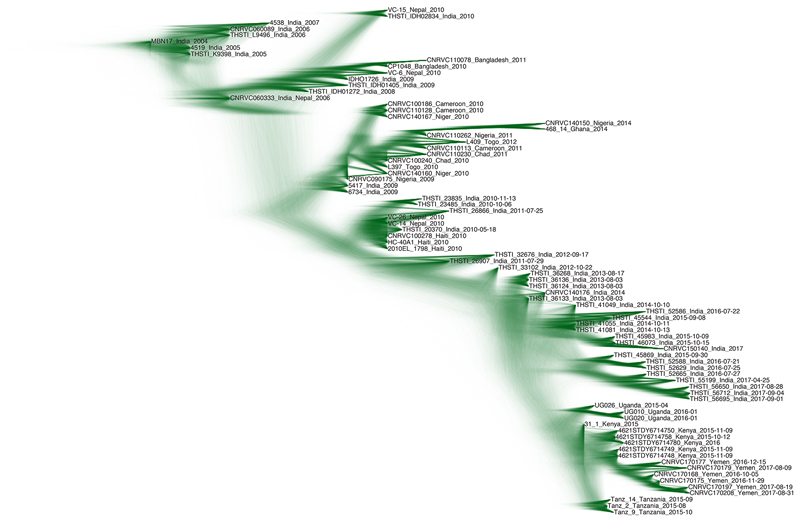
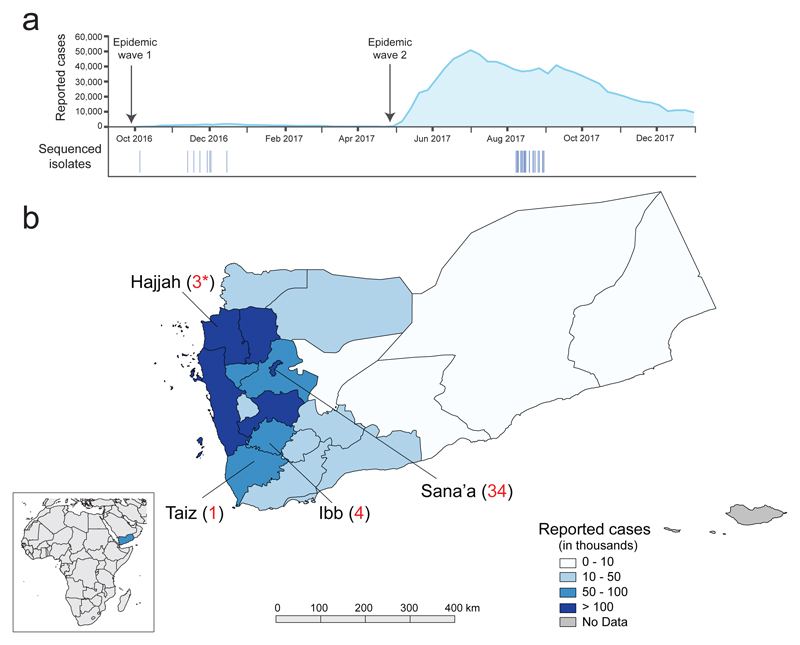
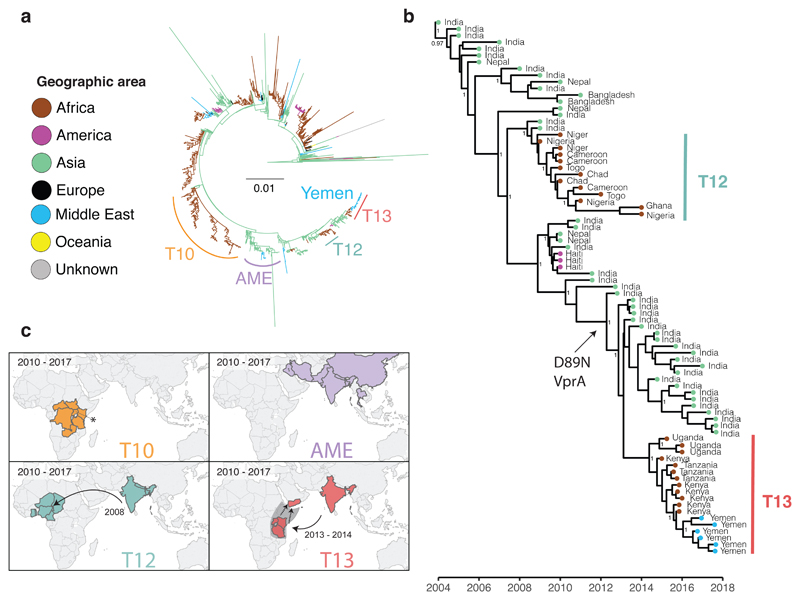
Yemen is currently experiencing, to our knowledge, the largest cholera epidemic in recent history. The first cases were declared in September 2016, and over 1.1 million cases and 2,300 deaths have since been reported1. Here we investigate the phylogenetic relationships, pathogenesis and determinants of antimicrobial resistance by sequencing the genomes of Vibrio cholerae isolates from the epidemic in Yemen and recent isolates from neighbouring regions. These 116 genomic sequences were placed within the phylogenetic context of a global collection of 1,087 isolates of the seventh pandemic V. cholerae serogroups O1 and O139 biotype El Tor2-4. We show that the isolates from Yemen that were collected during the two epidemiological waves of the epidemic1-the first between 28 September 2016 and 23 April 2017 (25,839 suspected cases) and the second beginning on 24 April 2017 (more than 1 million suspected cases)-are V. cholerae serotype Ogawa isolates from a single sublineage of the seventh pandemic V. cholerae O1 El Tor (7PET) lineage. Using genomic approaches, we link the epidemic in Yemen to global radiations of pandemic V. cholerae and show that this sublineage originated from South Asia and that it caused outbreaks in East Africa before appearing in Yemen. Furthermore, we show that the isolates from Yemen are susceptible to several antibiotics that are commonly used to treat cholera and to polymyxin B, resistance to which is used as a marker of the El Tor biotype.


Conflict of interest statement

The authors declare no competing financial interests.

Figures

Extended data Figure 1
Geographic location of the sequenced V. cholerae O1 El Tor isolates and number of reported cholera cases. a, Geographic location of the 116 V. cholerae O1 El Tor isolates sequenced. The number of isolates collected per country is indicated. The three isolates collected in Jizan, Saudi Arabia (denoted by an asterisk) were from Yemeni refugees originating from Hajjah District. The map is a cropped version of the one available at: https://commons.wikimedia.org/wiki/File:BlankMap-World.png. b, Number of cholera cases per country reported to the World Health Organisation (WHO) between 2014 and 2016. The total number of cholera cases reported to the WHO by the countries in panel b was 268,337. The maps were created using Paintmaps, a free online map generating tool (http://www.paintmaps.com/).
Extended data Figure 2
Assessment of the temporal signal within the dataset. a, Linear regression of the root-to-tip distance against sampling time obtained with TempEst [29] using a maximum-likelihood phylogeny of 81 representative seventh pandemic V. cholerae O1 isolates (i.e., those used for the BEAST analysis). Bars on nodes indicate the precision of the isolation date (e.g., if only the year of isolation is known, the bar spans the entire year). b, Comparison of the ucld.mean parameter estimated from 20 date-randomisation BEAST experiments and the original dataset. The rate for the correctly dated tree is shown in red. The median and 95% Bayesian credible interval for the ucld.mean parameter are provided.
Extended data Figure 3
Maximum clade credibility tree produced with BEAST [28] for a subset of 81 representative isolates of the distal part of the genomic wave 3 (i.e., those with the ctxB7 allele). The nodes supported by posterior probability values ≥ 0.5 are indicated.
Extended data Figure 4
Visualisation of the posterior distribution of trees from the BEAST MCMC analysis. The opacity of the branches is scaled according to the number of times a clade is seen in the distribution. There is high support for the East Africa/Yemen clade. The uncertainty in the placement of the node for the Indian/East African isolates is the reason for the low posterior support value for this node in Extended Data Figure 3.
Extended data Figure 5
Multiple sequence alignment of VprA (VC_1320) with two-component response regulators. A non-synonymous mutation at position 89 of VC_1320 resulting in a D-to-N amino-acid change was associated with a phenotype of polymyxin B susceptibility.
Figure 1
Figure 1
Geographic location of the sequenced V. cholerae O1 El Tor isolates and number of reported cholera cases. a, Aggregate number of suspected cholera cases per week in Yemen until December 31st, 2017 (http://yemeneoc.org/bi/), showing the two epidemic waves. The dates of the isolates sequenced in this study are shown under the epidemic curve. b, Geographic location of the 42 V. cholerae O1 El Tor isolates from Yemen. The three isolates collected in Saudi Arabia (denoted by asterisks) were obtained from Yemeni refugees from Hajjah District and are considered to be ‘Yemeni isolates’ throughout the manuscript. The number of cases per governorate is indicated according to reference 1. The governate map of Yemen was created using QGIS v2.16 (https://qgis.org) and the shape file approved for use by the UN Office for the Coordination of Humanitarian Affairs (OCHA) OCHA Yemen country office (https://data.humdata.org/dataset/yemen-admin-boundaries). The small inlay map was created using QGIS v2.16 using the Natural Earth basemap v4.0.0 (https://www.naturalearthdata.com).
Figure 2
Figure 2
Phylogenetic relatedness of the V. cholerae O1 El Tor isolates from the 2016-2017 epidemic in Yemen. a, Maximum likelihood phylogeny of 1,203 genomic sequences. M66 was used as an outgroup. The scale bar denotes substitutions per variable site (SNVs). Branches are coloured according to geographic location, inferred by stochastic mapping of the geographic origin of each isolate onto the tree. The inferred introduction events into Africa are indicated by the letter ‘T’. The sublineage labelled AME (Asia/Middle East) contains the most recent Middle Eastern isolates. b, Maximum clade credibility tree produced with BEAST for a subset of 81 representative isolates of the distal part of genomic wave 3 (i.e., those with the ctxB7 allele). Geographic location of the isolates is indicated in the same colours as in panel a. Selected nodes supported by posterior probability values ≥ 0.8 are shown. Acquisition of the polymyxin susceptibility-associated non-synonymous SNV in VC_1320 (vprA) is indicated. c. The geographic distribution of selected 7PET sublineages. An asterisk denotes data from reference 4. The date ranges shown for introductions are the 95% CI estimate of the MRCA in years. Dashed lines and the grey area in T13 indicate that the lineage was detected in East Africa before its appearance in the Yemen. This does not represent a precise route of transmission. The maps were created with Tableau Desktop version 10.1.5 using the basemap from ©OpenStreetMap contributors (www.openstreetmap.org), available under the Open Database License.

Comment in

  • Genomics can help to monitor cholera.
    [No authors listed] [No authors listed] Nature. 2019 Jan;565(7740):397-398. doi: 10.1038/d41586-019-00206-w. Nature. 2019. PMID: 30670864 No abstract available.

References

    1. Camacho A, et al. Cholera epidemic in Yemen, 2016–18: an analysis of surveillance data. Lancet Glob Health. 2018 doi: 10.1016/S2214-109X(18)30230-4. - DOI - PMC - PubMed
    1. Weill FX, et al. Genomic history of the seventh pandemic of cholera in Africa. Science. 2017;358:785–789. - PubMed
    1. Kachwamba Y, et al. Genetic characterization of Vibrio cholerae O1 isolates from outbreaks between 2011 and 2015 in Tanzania. BMC Infect Dis. 2017;17:157. - PMC - PubMed
    1. Bwire G, et al. Molecular characterization of Vibrio cholerae responsible for cholera epidemics in Uganda by PCR, MLVA and WGS. PLoS Negl Trop Dis. 2018;12:e0006492. - PMC - PubMed
    1. Mutreja A, et al. Evidence for several waves of global transmission in the seventh cholera pandemic. Nature. 2011;477:462–465. - PMC - PubMed

Publication types

LinkOut - more resources