. 2019 Jan;565(7740):516-520.
doi: 10.1038/s41586-018-0833-4. Epub 2019 Jan 2.

Cryo-EM structure of the human α1β3γ2 GABAA receptor in a lipid bilayer

Affiliations

Cryo-EM structure of the human α1β3γ2 GABAA receptor in a lipid bilayer

Duncan Laverty et al. Nature. 2019 Jan.

Abstract

Type A γ-aminobutyric acid (GABAA) receptors are pentameric ligand-gated ion channels and the main drivers of fast inhibitory neurotransmission in the vertebrate nervous system1,2. Their dysfunction is implicated in a range of neurological disorders, including depression, epilepsy and schizophrenia3,4. Among the numerous assemblies that are theoretically possible, the most prevalent in the brain are the α1β2/3γ2 GABAA receptors5. The β3 subunit has an important role in maintaining inhibitory tone, and the expression of this subunit alone is sufficient to rescue inhibitory synaptic transmission in β1-β3 triple knockout neurons6. So far, efforts to generate accurate structural models for heteromeric GABAA receptors have been hampered by the use of engineered receptors and the presence of detergents7-9. Notably, some recent cryo-electron microscopy reconstructions have reported 'collapsed' conformations8,9; however, these disagree with the structure of the prototypical pentameric ligand-gated ion channel the Torpedo nicotinic acetylcholine receptor10,11, the large body of structural work on homologous homopentameric receptor variants12 and the logic of an ion-channel architecture. Here we present a high-resolution cryo-electron microscopy structure of the full-length human α1β3γ2L-a major synaptic GABAA receptor isoform-that is functionally reconstituted in lipid nanodiscs. The receptor is bound to a positive allosteric modulator 'megabody' and is in a desensitized conformation. Each GABAA receptor pentamer contains two phosphatidylinositol-4,5-bisphosphate molecules, the head groups of which occupy positively charged pockets in the intracellular juxtamembrane regions of α1 subunits. Beyond this level, the intracellular M3-M4 loops are largely disordered, possibly because interacting post-synaptic proteins are not present. This structure illustrates the molecular principles of heteromeric GABAA receptor organization and provides a reference framework for future mechanistic investigations of GABAergic signalling and pharmacology.


Conflict of interest statement

The authors declare no competing interests.

Figures
Extended Data Fig 1
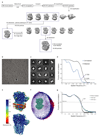
Extended Data Fig 1. Cryo-EM image processing procedure.
a. Overview of cryo-EM data collection and image processing procedure (see Methods). b. Representative micrograph of the α1β3γ2L-Mb38-nanodisc complex obtained using Falcon3 detector and VPP. c. Representative 2D class averages for downscaled data (box size of 240 Å). d. FSC curves for the reconstruction before and after applying a soft mask. e. The unsharpened map from refinement coloured by local resolution estimate (calculated using MonoRes38) and shown at a low isosurface level to enable visualization of the nanodisc (left) and at a high isosurface level (right). f. Angular distribution histogram of particle used in calculating the final 3D reconstruction for the receptor assembly. g. FSC curves for cross-validation between maps and models: model versus summed map (black), model versus half map 1 (used in test refinement, green), model versus half map 2 (not used in test refinement, blue).
Extended Data Fig 2
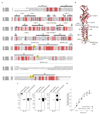
Extended Data Fig 2. Sequence alignment of GABAAR α1, β3 and γ2 subunits, biochemical characterization and binding assays.
a. Alignment of wild-type GABAAR subunit sequences, where number one represents first residue of the mature protein. α-helices (grey cylinders), β-strands (black arrows) and associated loops are indicated. Glycosylation sites are indicated by blue pentagon and the associated subunit residue highlighted in blue. Residues identified as coordinating PIP2 binding are highlighted in yellow and indicated by yellow hexagons. The alignment graphic was prepared on the ESPript 3.0 server (http://espript.ibcp.fr/ESPript/ESPript/). b. Structure of a single α1 subunit. c. Western blot analysis of cell lysates from LMNG solubilized control HEK293 cells and α1β3γ2L GABAAR cells, and purified α1β3γ2L GABAARs in nanodiscs. The arrowhead denotes the band corresponding to the full-length GABAAR subunits which migrates as a species of ~51-55 kDA. With the exception of the α1 subunit (which displays a small degree of proteolysis following reconstitution – denoted by asterisk), GABAAR subunits do not display apparent proteolysis during solubilization, purification and reconstitution. Western blots were repeated twice independently with similar results. d. GABA enhanced displaceable [3H]flunitrazepam binding to purified receptors in a concentration–dependent manner in the presence or absence of Mb38. Points represent individual samples from two separate experiments.
Extended Data Fig 3
Extended Data Fig 3. α1β3γ2 model-map validation and EM density.
a-m. EM density segments for representative regions of each subunit and Mb38. Sharpened map contoured as detailed in Methods.
Extended Data Fig 4
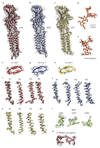
Extended Data Fig 4. Comparison of TMD architecture with α1β2γ2 and α1β1γ2 GABAAR structures in detergent.
a-f. Superposition of subunit chains of α1β3γ2L GABAAR (grey) onto equivalent chains of α1β2γ2 GABAAR in DDM (Conformation B: PDB 6D6T) and the γ2 subunit of α1β2γ2 GABAAR (Conformation A: PDB 6D6U). RMSD values are for Cα atoms over entire subunit. g. Overview of the TMD of α1β3γ2 in nanodisc. h-j. Superposition of TMD for α1β2γ2 GABAAR conformation A (h), conformation B (i), α1β1γ2 GABAAR (PDB: 6DW0 - j) and α1β3γ2-nanodisc complex (grey ribbon). TM helices of the γ2 subunit are labelled. The TM helices of the γ2 show significant distortion in detergent-bound complexes. M4 helices in α1 and γ2 subunits were not modelled in the α1β1γ2 GABAAR. k-n. Superposition of β- subunits reveals conformational differences of γ2+ subunit (α1β3γ2-nanodics complex in grey). Differences of distance (Å) between selected residue Cα atoms (spheres) is indicated by lines. Disruption of the γ2 TMD induces substantial displacement of loop 7, loop 2 and the M2-M3 loop at the ECD-TMD interface in the detergent bound α1β2γ2 structures (l, m), and to a lesser extend in α1β1γ2 GABAAR (n). o-r. Close up view of M2 helices at level of -2’ proline/alanine residues (Cα atoms shown as sphere) in nanodisc (o) and detergent bound structures (p-r).
Extended Data Fig 5
Extended Data Fig 5. Mb38 binding and function.
a. Side and b. top-down view of neighboring α1+ and β3- subunits bound to Mb38. c. Representative normalized current traces obtained in cells expressing α1β3γ2L receptor exposed to GABA (3 μM) alone or with varying concentrations of Mb38 (n = 3-6 cells), applied for 4 s. Currents were normalized to peak current amplitude obtained with GABA (3 μM) alone during the first 1s phase of the trace. The concentration of Mb38 is color-coded as indicated in the legend. d-f. Close-up view of the binding site when viewed approximately parallel to the plane of the membrane. CDR loops 1 (d), 2 (e) and 3 (f) of the Mb38 are colored in turquoise, teal and dark-green respectively and residues involved in interactions shown in ball-and-stick representation. Polar interactions are shown as dotted lines. g. Representative current trace obtained in cells expressing α1β3γ2L receptor exposed to 3 μM Mb38. Mb38 (3 μM) opened 16 ± 11 % (Mean ± SD; n = 5 cells) of the receptors gated by EC10 GABA alone (therefore ~2% of the total receptors expressed).
Extended Data Fig 6
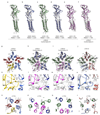
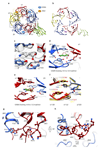
Extended Data Fig 6. Vestibular glycans and interface classes in the α1β3γ2L GABAAR.
a. Side view of the receptor shows the position of vestibular α1 N-linked glycans. For clarity, the near α1 and β3 subunits have been removed. b. View across the extracellular vestibule reveals the stacking of α1 N-linked glycans. Receptor surface is coloured according to electrostatic surface potential and reveals an electropositive ring in middle portion of the ECD vestibule. c-f. Paired views of the interface between principle (+) and complementary (-) subunits viewed from the pore axis outwards (left) and open book view of each subunit when viewed from the receptor periphery (right). Residues involved in forming interactions (defined using PDBePISA45) are colored according to the type of interaction and mapped onto the isosurface representation; polar – cyan, electrostatic/salt bridges – magenta and van der Waals – orange. Arrowheads reveal the openings of defined tunnels between adjacent subunits g. Calculated interfacial buried surface areas and solvation energy gain at complex formation (both calculated using PDBePISA44). The asterisk denotes the second β3 - α1 (chain E-chain A) interface in the pentameric assembly. Radii of tunnels, denoted by arrowhead in panel c-f, were also calculated (see Methods). Open arrowheads in panels c, e denotes cavities forming proposed anesthetic binding sites (as discussed in the text).
Extended Data Fig 7
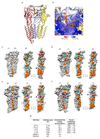
Extended Data Fig 7. Disease mutations associated with α1, β3 and γ2, lateral tunnels and fenestrations at the subunit interfaces.
a, b. Disease mutations associated with GABAA α1, β3 and γ2 subunits are mapped onto the structure and shown in sphere representation. The receptor is viewed parallel to the membrane plane (a) and from the extracellular aspect (b). Outlined boxes highlight position of mutations shown in the panels (c-e). c-e. Close up view of disease mutations associated with the α1 and β3 subunits. Polar interactions between residues are shown as dotted lines. f. Table summarising a number of disease mutations identified in genes for α1, β3 and γ2. Functional effects as determined from experimental studies of channels properties are summarised. g. Exposed surface of the γ2-β3 subunit interface coloured according to electrostatic surface potential. h. Close up view of an electronegative fenestration formed at the γ2-β3 extracellular domain interface. The continuous tunnel leading from extracellular space to the receptor vestibule is outlined. i. Exposed surface of the α1-β3 subunit interface coloured according to electrostatic surface potential. j. Close-up view of the α1-β3 extracellular interface reveals an upper tunnel leading to the mid-portion of the ECD vestibule. A lower tunnel (denoted by arrow) opens into the upper aspect of the ion channel at the level of β3His267, a residue implicated in mediating the effects of propofol.
Extended Data Fig 8
Extended Data Fig 8. Lipid binding sites and functional modulation of GABAAR by PIP2.
a. Well resolved density for POPC lipid moiety (yellow, ball-and-stick representation) at the extracellular aspect of the lipid nanodisc. EM density is shown in chicken wire representation and contoured around the lipids. b. Sequence alignment of GABAAR and GlyR subunits for PIP2 binding regions; the M1-M2 loop, post-M3 and pre-M4 segments. α1 residues forming hydrogen-bonds or salt-bridge interactions with PIP2 are identified by yellow hexagons, and those which are conserved amongst receptor subunits are highlighted in orange (identical) and yellow (similar). The alignment graphic was prepared on the ESPript 3.0 server (http://espript.ibcp.fr/ESPript/ESPript/). c. Representative normalized current traces from the same patch, obtained in a two-pulse protocol, where inside-out patches were exposed to two 5 s etomidate (100μM) pulses 7.5 s apart. During the second pulse, etomidate was either applied alone or co-applied with PLL (250 μg/ml). Currents traces were normalized to the peak current amplitude obtained during the first etomidate pulse. d. Dot plot of peak current amplitudes obtained during the second pulse (co-application of PLL) normalized to the peak current amplitudes obtained with first pulse of etomidate (center value represents mean ± SD; n = 9 patches). Unpaired and paired Students t test (Two-tailed) values obtained are given in the figure.
Extended Data Fig 9
Extended Data Fig 9. Comparisons of agonist sites and analogous pockets at other subunit interfaces.
a. View of the receptor from across the synaptic cleft with the agonist binding sites highlighted. b. Cut-away view of (a) at the level of loops C, reveals EM density (shown as magenta chicken wire representation) at four inter-subunit pockets. c. EM density in the orthosteric binding pocket shown (grey surface representation). For comparison, the top binding pose for GABA is displayed in grey ball-and-stick representation. d, e. Overlay of GABA binding poses from molecular docking calculations at the β3-α1 (d) and α1-β3 (e) binding pockets. The range of estimated free energies of binding (kcal/mol) is given. f. Comparison of the orthosteric binding pocket at the β3-α1 interface (grey), with the 3 unique interfaces observed in the α1β3γ2-Mb38 receptor (coloured as in a.) Superposition of the (-) subunit ECD reveals the relative movement of the (+) subunit ECD. g, h. Modelling of the intracellular end of M3 and M4 helices, contributing to the receptor intracellular domain, shown approximately parallel (g) and perpendicular (h) to the plane of the membrane.
Figure 1
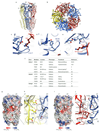
Figure 1. Architecture of full-length α1β3γ2L GABAAR in lipid nanodiscs.
a-c. Side (a), top (b) and bottom (c) views of the sharpened cryo-EM map of α1β3γ2L GABAAR-Mb38 complex in lipid nanodisc. Mb38 and glycans are colored green and orange, respectively. Density contributed by the nanodisc is colored in pale blue. d, e. Side (d) and top (e) views of atomic model of the α1β3γ2L GABAAR in ribbon representation and glycans and lipids in ball-and-stick representation. Subunit coloring reflects that in (a-c). f. Etomidate enhancement of [3H]muscimol binding at α1β3γ2L GABAAR-nanodisc complexes in the presence or absence of Mb38. Each point represents average of at least 3-4 independent measurements and error bars correspond to one standard deviation, with the exception of points for 0.1 and 0.3 μM etomidate with Mb38 which represent two independent measurements.
Figure 2
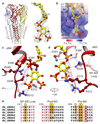
Figure 2. PIP2 binding sites in α1β3γ2L GABAAR.
a. PIP2 bound at the base of α1 subunit TMDs. EM density map contoured around PIP2 (at α1 chain A binding site). b. Electrostatic surface potential shown at the ‘cytosolic’ end of α1 subunit and bound PIP2, shown in stick representation. c, d. PIP2 binding site when viewed approximately parallel to the plane of the membrane (c) and when rotated around the vertical axis (d). e. Sequence alignment of GABAAR α-subunits for PIP2 binding regions. α1 residues forming hydrogen-bonds or salt-bridge interactions with PIP2 are identified by yellow hexagons, and those which are conserved amongst α-receptor subunits are highlighted orange (identical) and yellow (similar).
Figure 3
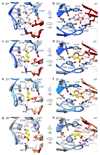
Figure 3. Neurotransmitter binding pocket and docked GABA.
a, b. Close-up view of the binding site when viewed approximately parallel to the plane of the membrane (a) and from the extracellular side (b). GABA, in its most energetically favored pose from computational docking analysis, is shown in grey ball-and-stick representation. Hydrogen bonds, salt bridges and cation-π interactions are shown as dotted lines. c-h. Superposition of the orthosteric binding site of α1β3γ2L (grey) with the alprazolam/GABA bound α1β3γ2L (c, d. PDB 6HUO) GABA-bound α1β1γ2 (e, f. PDB 6DW1) and α1β2γ2 (g, h. PDB 6D6U) GABAAR cryo-EM structures. Experimentally derived GABA (yellow ball-and-stick) poses and interactions (dotted lines) are shown.
Figure 4
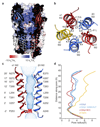
Figure 4. Conductance and permeation pore structure of the α1β3γ2L GABAAR.
a. Cutaway of the receptor showing electrostatic surface potential along the ion conducting pathway. b. Asymmetry in the channel at the level of the activation and desensitization gates. -2’ and 9’ residues are shown in ball-and-stick representation. Distance between Cα of -2’ and 9’ residues are given in Å. c. M2 α-helices from opposing α1 and β3 subunits with sidechains shown for pore lining residues. Spheres represent the solvent accessible volume of the ion channel. Red spheres delimit the narrowest aspect of the channel. d. Profile of pore radius of the α1β3γ2L-Mb38 complex, alprazolam/GABA-bound α1β3γ2L (ALP; PDB ID: 6HUO) and bicuculline-bound α1β3γ2L (BCC; PDB ID: 6HUK) and the benzamidine-bound β3 GABAA (BEN; PDB ID: 4COF).
Figure 5
Figure 5. Anesthetic binding sites in the α1β3γ2L GABAAR TMD
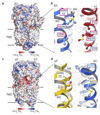
a. Exposed surface of the β3-α1 subunit interface coloured according to electrostatic surface potential. b. Close up view of a cavity formed at the transmembrane β-α interface. Residues identified in photolabeling studies with etomidate and propofol derivates are outlined in magenta and blue respectively. c. Exposed surface of the γ2-β3 subunit interface coloured according to electrostatic surface potential. d. Close up view of a cavity formed at the transmembrane γ-β interface. Residues identified in photolabeling studies with propofol and barbiturate derivates are outlined in blue and orange respectively.

Comment in

References

    1. Sigel E, Steinmann ME. Structure, function, and modulation of GABAA receptors. J Biol Chem. 2012;287:40224–40231. - PMC - PubMed
    1. Olsen RW, Sieghart W. GABAA receptors: subtypes provide diversity of function and pharmacology. Neuropharmacology. 2009;56:141–148. - PMC - PubMed
    1. Braat S, Kooy RF. The GABAA Receptor as a Therapeutic Target for Neurodevelopmental Disorders. Neuron. 2015;86:1119–1130. - PubMed
    1. Macdonald RL, Kang J-Q, Gallagher MJ. Mutations in GABAA receptor subunits associated with genetic epilepsies. J Physiol (Lond.) 2010;588:1861–1869. - PMC - PubMed
    1. Fritschy JM, Mohler H. GABAA-receptor heterogeneity in the adult rat brain: differential regional and cellular distribution of seven major subunits. J Comp Neurol. 1995;359:154–194. - PubMed

Publication types

MeSH terms