. 2019 Jan;565(7740):454-459.
doi: 10.1038/s41586-018-0832-5. Epub 2019 Jan 2.

GABAA receptor signalling mechanisms revealed by structural pharmacology

Affiliations

GABAA receptor signalling mechanisms revealed by structural pharmacology

Simonas Masiulis et al. Nature. 2019 Jan.

Erratum in

Abstract

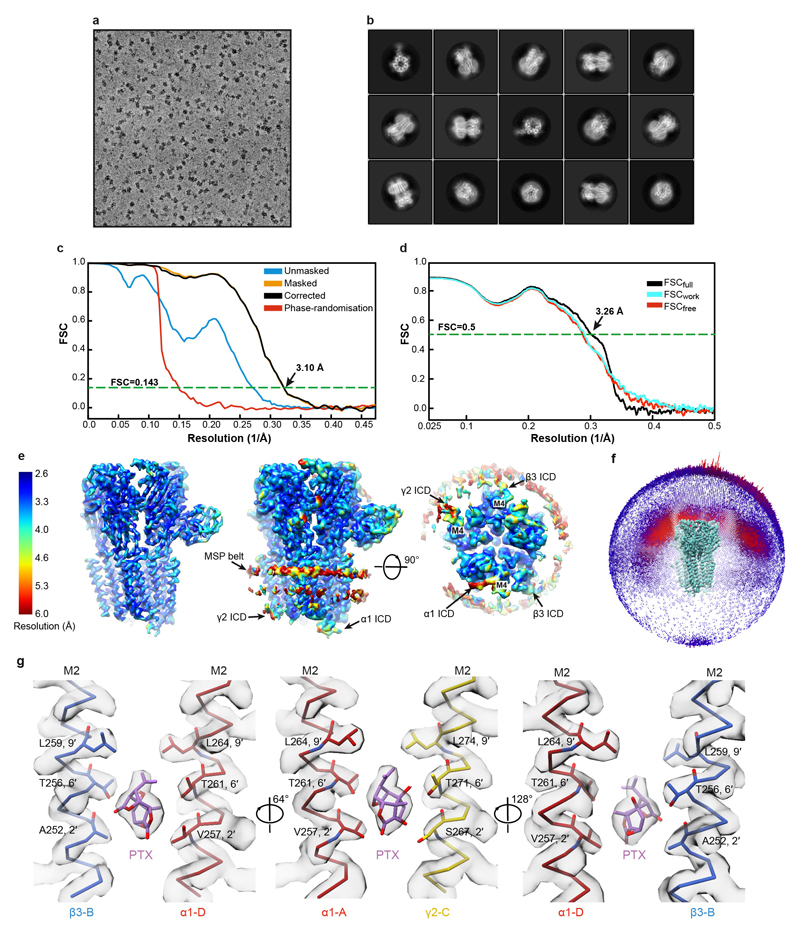
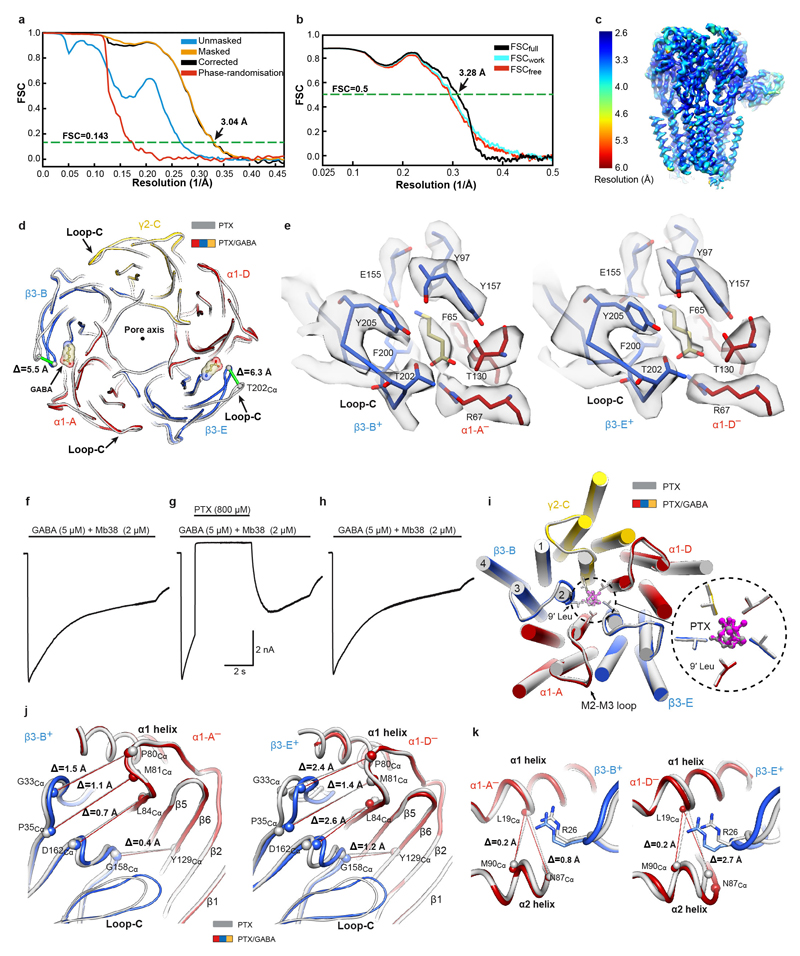
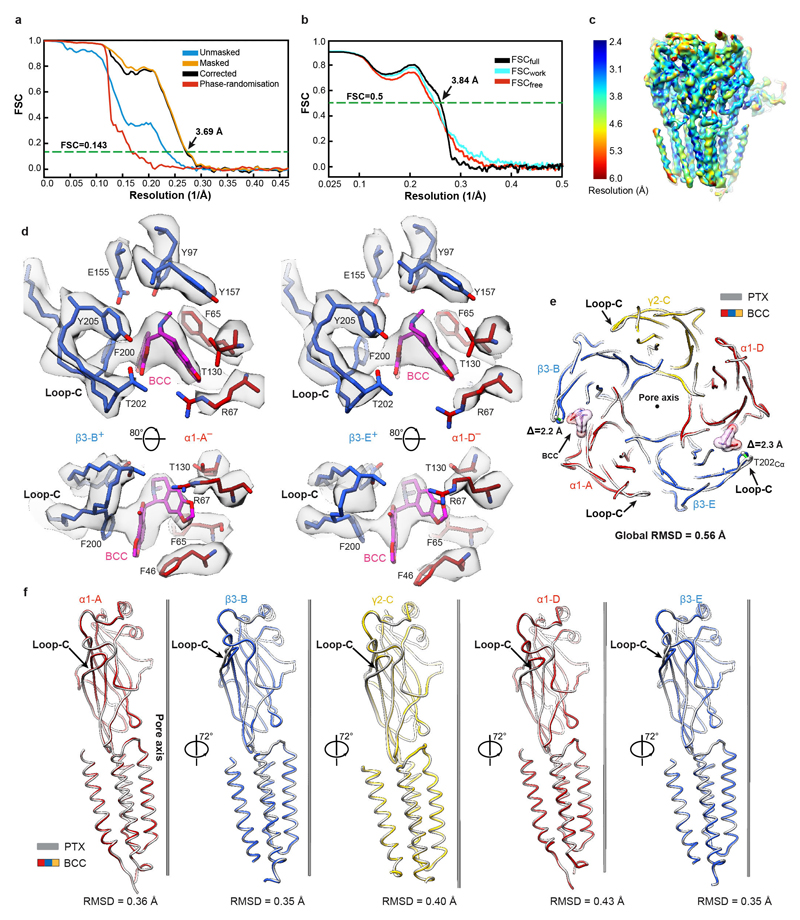
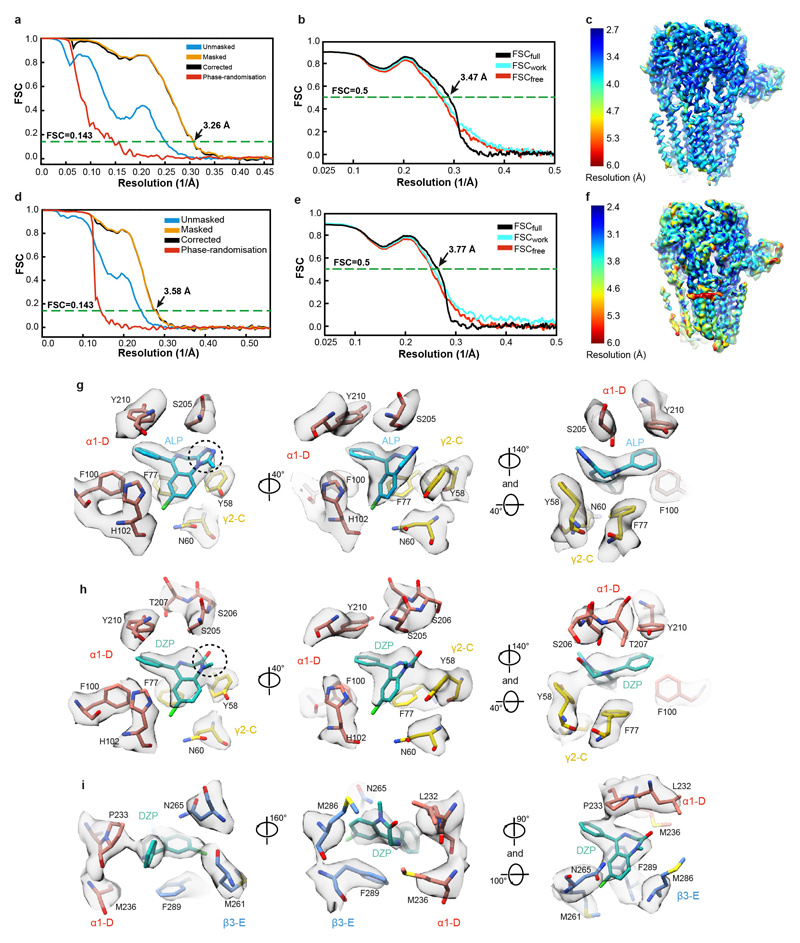
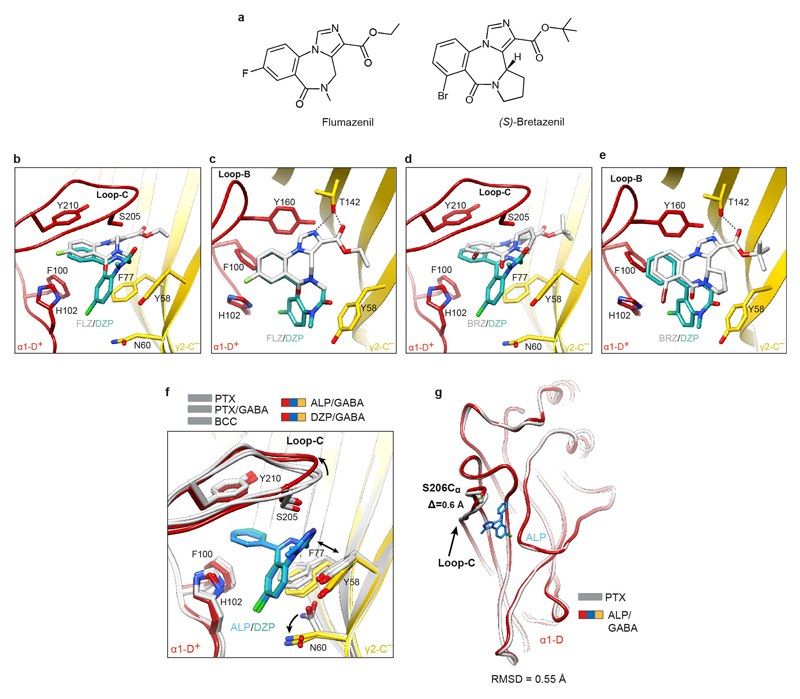
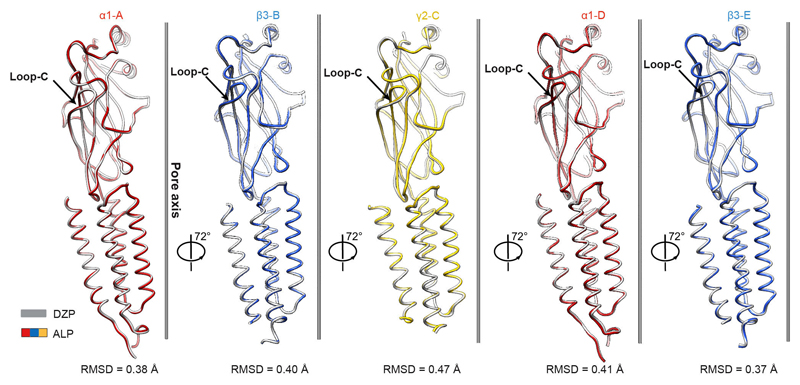
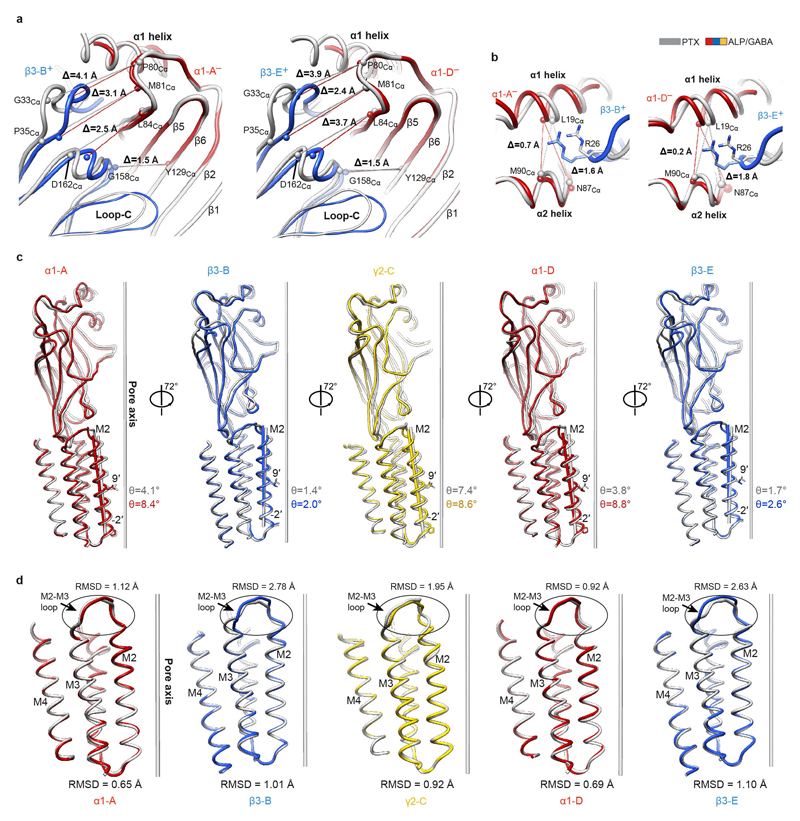
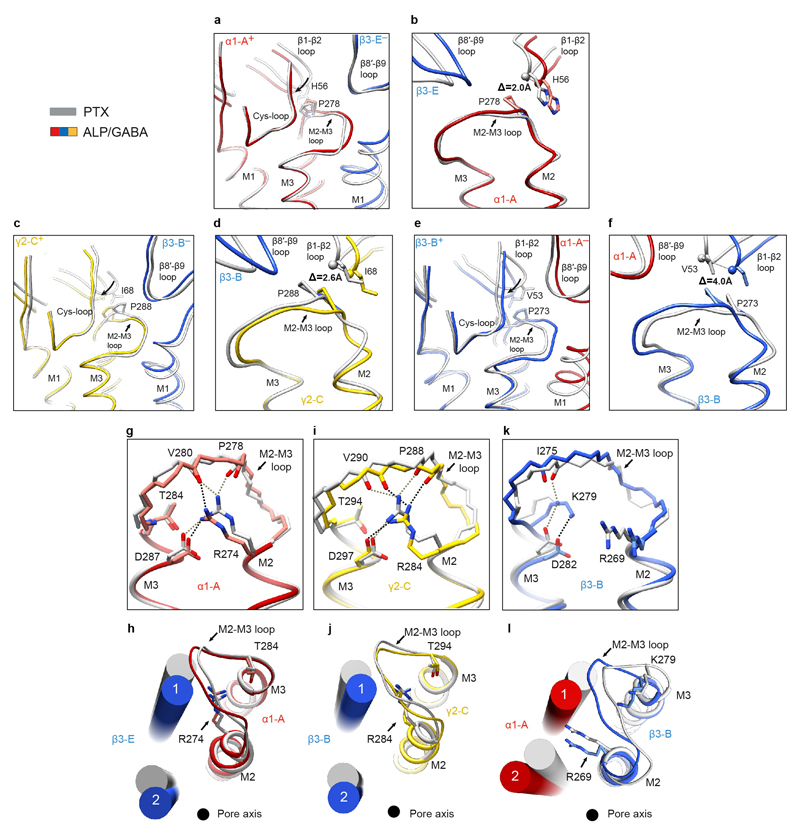
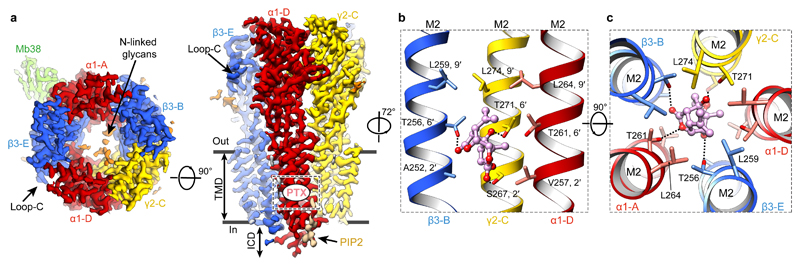
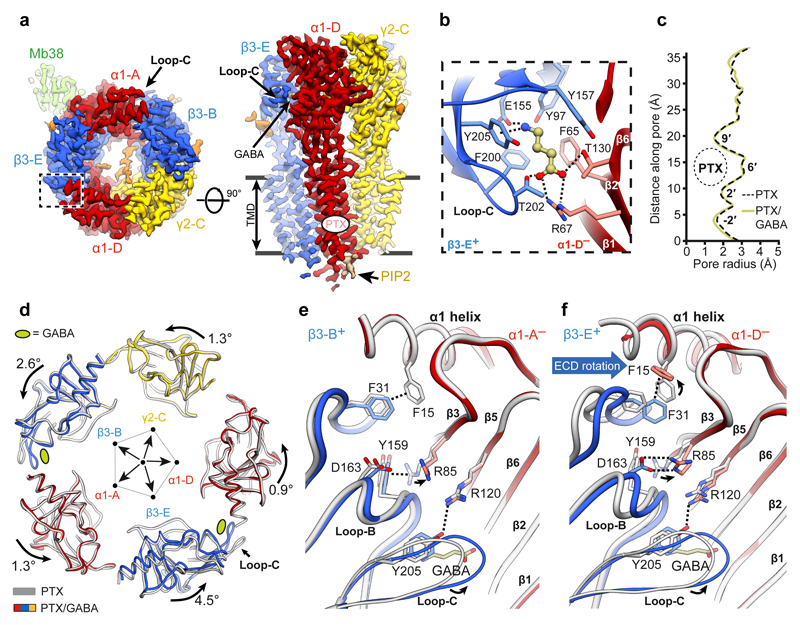
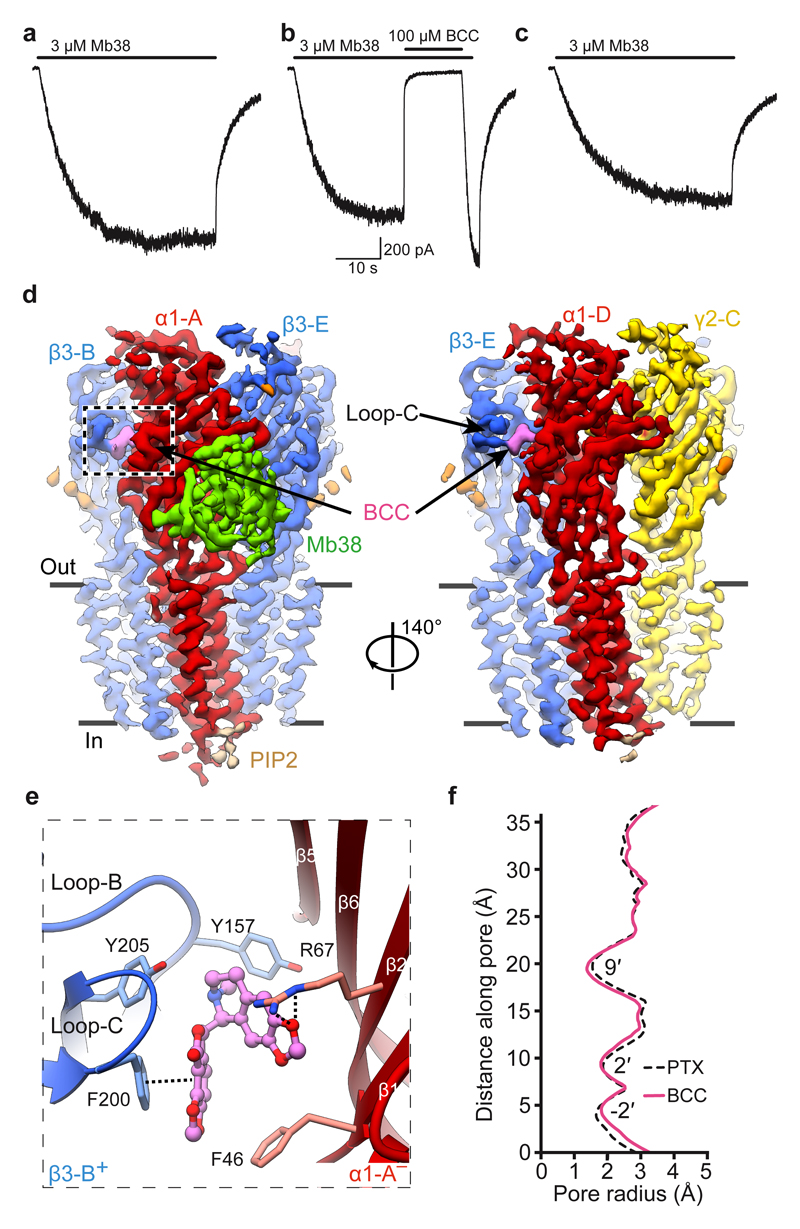
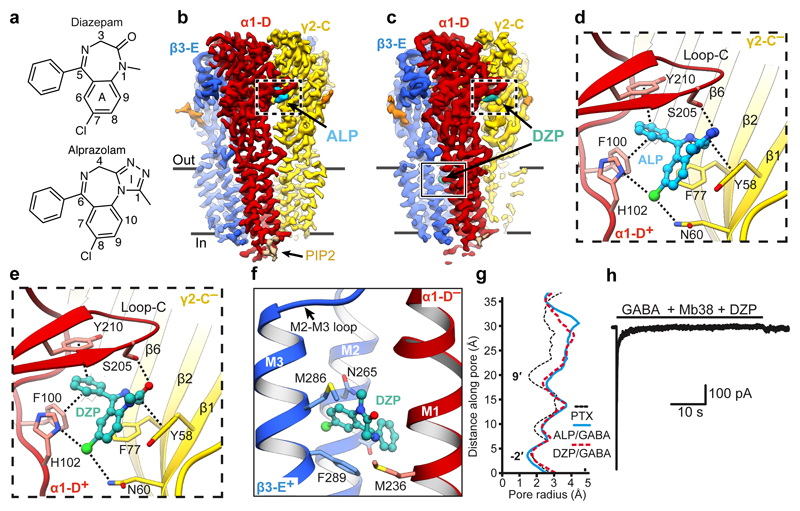
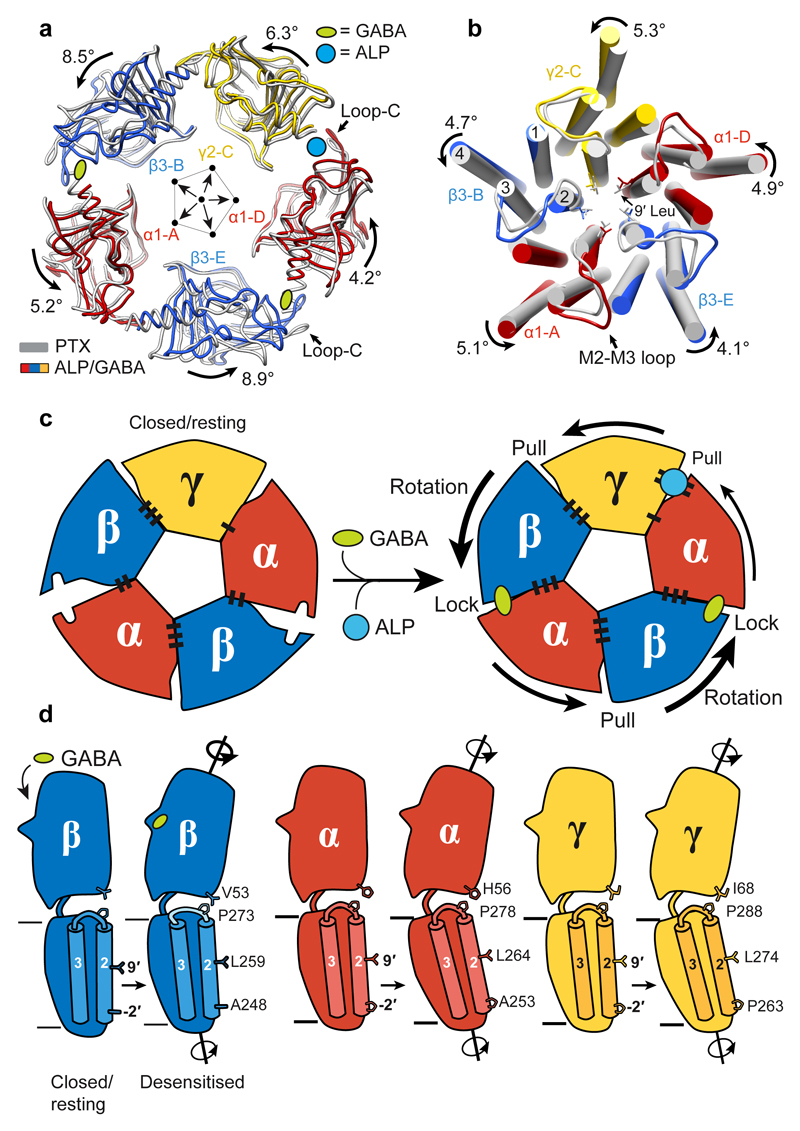
Type-A γ-aminobutyric (GABAA) receptors are ligand-gated chloride channels with a very rich pharmacology. Some of their modulators, including benzodiazepines and general anaesthetics, are among the most successful drugs in clinical use and are common substances of abuse. Without reliable structural data, the mechanistic basis for the pharmacological modulation of GABAA receptors remains largely unknown. Here we report several high-resolution cryo-electron microscopy structures in which the full-length human α1β3γ2L GABAA receptor in lipid nanodiscs is bound to the channel-blocker picrotoxin, the competitive antagonist bicuculline, the agonist GABA (γ-aminobutyric acid), and the classical benzodiazepines alprazolam and diazepam. We describe the binding modes and mechanistic effects of these ligands, the closed and desensitized states of the GABAA receptor gating cycle, and the basis for allosteric coupling between the extracellular, agonist-binding region and the transmembrane, pore-forming region. This work provides a structural framework in which to integrate previous physiology and pharmacology research and a rational basis for the development of GABAA receptor modulators.


Conflict of interest statement

The authors declare no competing interests.

Figures

Extended Data Figure 1
Extended Data Figure 1. Single particle cryo-EM analysis of human α1β3γ2L GABAAR bound to the channel blocker picrotoxin (PTX).
a, Representative micrograph of the PTX-bound GABAAR particles embedded in vitreous ice. b, Representative 2D class averages. c, FSC curves for the 3D reconstruction using gold-standard refinement in RELION. Curves shown for the phase randomisation, unmasked maps, masked and phase-randomisation corrected masked maps. d, Validation of model refinement: model versus summed map (FSCfull), model refined in half-map 1 versus half-map 1 (FSCwork), model refined in half-map 1 versus half-map 2 (FSCfree). e, The final, unsharpened cryo-EM map coloured by local resolution (estimated using MonoRes61) shown at a higher contour level (left) and at a lower level (right) to highlight the nanodisc belt and flexible intracellular domains (ICDs). f, Angular distribution of particle projections. The map of GABAAR-PTX complex is shown in teal. g, Cryo-EM density segments for the PTX binding site between residues 2' and 9' of the M2 transmembrane helices.
Extended Data Figure 2
Extended Data Figure 2. Structural and electrophysiological analyses of human α1β3γ2L GABAAR in complex with PTX and GABA.
a, FSC curves for the 3D reconstruction of the GABAAR bound to PTX and GABA. Curves shown for the phase randomisation, unmasked maps, masked and phase-randomisation corrected masked maps. b, Validation of the model refinement protocol. Curves shown for model versus summed map (FSCfull), model refined in half-map 1 versus half-map 1 (FSCwork), model refined in half-map 1 versus half-map 2 (FSCfree). c, The final, unsharpened cryo-EM map coloured by local resolution (estimated using MonoRes61). d, Superposition of the PTX- and PTX/GABA-bound α1β3γ2 receptor based on the global TMD alignment. The GABA-induced movements of loop-C in each of the of β3 subunits are highlighted by green lines between Cα atoms of Thr202 residues. GABA is shown as spheres (carbon atoms in khaki; nitrogen, blue; oxygens, red). e, Cryo-EM density segments showing GABA binding sites the PTX/GABA-bound structure. f-h, Representative whole-cell current traces elicited from the same HEK cell by three 8.8 s pulses of GABA (5 μM) plus Mb38 (2 μM) each separated by a 1 min wash: (f) Control; (g) one second after the start of the second 8.8 s pulse, PTX (800 μM) was co-applied for 4 s; (h) wash control showing full recovery. PTX inhibited currents by 106 ± 2.6 % (mean ± S.D.; n= 6 cells). In addition, the protocol was repeated with outside–out patches (117 ± 9 % (mean ± S.D.; n = 5 patches). i, Globally superposed PTX- and PTX/GABA-bound α1β3γ2 receptor transmembrane domains viewed from the extracellular space. Side chains of 9' Leu residues are shown as sticks, whereas PTX is represented as balls and sticks. j, k, Superposition of α1 subunit ECDs from PTX-bound and PTX/GABA-bound α1β3γ2 receptors reveal the relative β3 ECD motions towards α1 ECDs, as viewed from outside of the receptor (j) and from the vestibule (k). Differences of distances (Å) between the selected Cα atoms in the complexes without and with GABA are indicated by lines. The PTX-bound structure is shown in grey and the PTX/GABA-bound structure is coloured by subunit (α1, red; β3, blue; γ2, yellow).
Extended Data Figure 3
Extended Data Figure 3. Structural analysis of human α1β3γ2L GABAAR bound to the competitive antagonist bicuculline (BCC).
a, FSC curves for the 3D reconstruction of the GABAAR bound to BCC. Curves shown for the phase randomisation, unmasked maps, masked and phase-randomisation corrected masked maps. b, Validation of the model refinement protocol. Curves shown for model versus summed map (FSCfull), model refined in half-map 1 versus half-map 1 (FSCwork), model refined in half-map 1 versus half-map 2 (FSCfree). c, The final, unsharpened cryo-EM map coloured by local resolution (estimated using MonoRes61). d, Cryo-EM density maps of the BCC-binding pockets. e, Superposition of the PTX- and BCC-bound α1β3γ2 receptor based on the global TMD alignment. The BCC-induced movements of loop-C in each of the β3 subunits are highlighted by green lines between Cα atoms of Thr202 residues. BCC is shown as spheres (carbon atoms in khaki; nitrogen, blue; oxygens, red). f, Superposition of individual subunits from the PTX- and BCC-bound GABAAR structures. Root mean square deviation (RMSD) values (Å) for equivalent Cα in the entire subunits are shown. Loops-C are marked by arrows. The PTX-bound structure is shown in grey and the BCC-bound structure is coloured by subunit (α1, red; β3, blue; γ2, yellow).
Extended Data Figure 4
Extended Data Figure 4. Structural analysis of human α1β3γ2L GABAAR in complexes with alprazolam (ALP) and diazepam (DZP).
a, FSC curves for the 3D reconstruction of the GABAAR bound to ALP. Curves shown for the phase randomisation, unmasked maps, masked and phase-randomisation corrected masked maps. b, Validation of the model refinement protocol. Curves shown for model versus summed map (FSCfull), model refined in half-map 1 versus half-map 1 (FSCwork), model refined in half-map 1 versus half-map 2 (FSCfree). c, The final, unsharpened cryo-EM map coloured by local resolution (estimated using MonoRes61). d-f, same as a-c but for the GABAAR bound to diazepam (DZP). g-i, Cryo-EM density maps of the ligand binding sites: ALP binding in benzodiazepine (BZD) pocket (g), DZP binding in the BZD pocket (h), DZP binding in the general anaesthetic pocket at the β3+/α1 interface (i). Ligands are shown in sticks, ALP carbon atoms coloured in blue, DZP carbon atoms coloured in teal, nitrogens in blue and chlorine atoms in green. Side chains of residues lining the binding pockets are shown as sticks and are numbered. Dotted circles highlight the difference between the structures of alprazolam and diazepam.
Extended Data Figure 5
Extended Data Figure 5. Classical benzodiazepines, flumazenil and bretazenil bind to the same BZD pocket in GABAARs, but use different modes.
ALP/GABA- and DZP/GABA-bound structures are coloured by subunit (α1, red; β3, blue; γ2, yellow), whereas the other superposed structures are shown in grey. Loop-C is in coil representation, to allow better visualization of the benzodiazepine (BZD) pocket. a, Structural formulae of flumazenil (FZL) and (S)-bretazenil (BRZ). b, c, Superposition of γ2 subunit ECDs from the DZP-bound α1β3γ2 and FZL-bound α1β2γ2 receptor structures reveals the FZL (white) position in the BZD pocket relative to DZP (teal). Side-on (b) and top-down views (c) of the pocket are presented. d, e, the same as for b, c but the structural alignment shows the relative position of the BRZ (white). Grey dashed lines indicate hydrogen bonds FZL and BRZ form with γ2Thr142 in the BZD pocket. f, Superposition of γ2 subunit ECDs from the PTX-, PTX/GABA-, BCC-, DZP/GABA- to ALP/GABA-bound γ2 ECD illustrates BZD pocket conformational changes associated with ALP/DZP binding: (i) an outward movement of loop-C; (ii) rearrangement of γ2Tyr58 and γ2Phe77 side chains, and (iii) change of the γ2Asn60 rotamer. g, Superposition of the α1-D subunit ECDs from the PTX-bound and ALP/GABA-bound α1β3γ2 structures shows that ALP binding causes only a minimal outwards motion of the α1 loop-C, by 0.8 Å as measured between Ser206 Cα atom positions.
Extended Data Figure 6
Extended Data Figure 6. Superimposition of individual subunits from ALP- and DZP-bound α1β3γ2L GABAAR structures.
Superposition of the individual subunits from the DZP- (grey) and ALP-bound (α1, red; β3, blue; γ2, yellow) GABAAR structures. Root mean square deviation (RMSD) values are in the 0.38-0.41 Å range for α1 (343-344 equivalent Cα positions), 0.37-0.40 Å for β3 (334-336 equivalent Cα positions) and 0.47 Å for γ2 subunits (330 equivalent Cα positions). Loops-C are marked by arrows.
Extended Data Figure 7
Extended Data Figure 7. Structural analysis of PTX- and ALP/GABA-bound α1β3γ2L GABAAR structures.
The PTX-bound structure is shown in grey and the ALP/GABA-bound structure is coloured by subunit (α1, red; β3, blue; γ2, yellow). a, b, Superposition of α1 subunit ECDs from PTX-bound and ALP/GABA-bound GABAARs reveals the relative β3 ECD motions towards α1 ECDs, as viewed from outside of the receptor (a) and from the vestibule (b). Differences in distances (Å) between the selected Cα atoms in the complexes without and with GABA are indicated with lines. c, Individual subunits from the PTX- and ALP/GABA-bound GABAAR structures superposed based on the global TMD alignment (ALP/GABA TMD over PTX TMD). Angles between vectors representing M2 helices and the pore axis of the PTX-bound structure are shown. Side chains of residues at -2′ and 9′ positions are shown. d, Superposition of TMDs from PTX- and ALP/GABA-bound structures. RMSD values (Å) are shown for entire TMDs and for the M2-M3 loops (see Methods for boundary definitions).
Extended Data Figure 8
Extended Data Figure 8. Conformational differences at the ECD-TMD interfaces between PTX-bound (closed) and ALP/GABA-bound (desensitised) α1β3γ2L GABAAR structures.
The PTX-bound structure is shown in grey and the ALP/GABA-bound structure is coloured by subunit (α1, red; β3, blue; γ2, yellow). The TMDs of the principal subunits of PTX-bound and ALP/GABA-bound structures were superposed allowing visualisation of relative movements of neighbouring ECDs and TMDs. a, b, Structural rearrangements of the ECD–TMD interface between α1-A and β3-E subunits. c, d, the same as a, b, but for γ2-C and β3-B subunits. e, f, the same as a, b, but for β3-B and α1-A subunits. Amino acid residues present in β1-β2 loop tip in each subunit are shown, the Cαs for these residues are represented as spheres and the distances of displacement indicated. The strictly conserved M2-M3 loop proline residue interacting with the β1-β2 loop is shown for each subunit. β1-β2 loop motions are indicated by curved arrows. g-l, Conformational differences in the M2-M3 loop and 19' Arg side chain positions between the PTX- and the ALP/GABA-bound structures shown for α-A (g, h), g2-C (i, j) and b3-B (k, l) subunits. Neighbouring subunit M1 and M2 helices are shown as cylinders. Dashed lines indicate putative hydrogen bond interactions between amino acid side chains and mainchain carbonyls.
Figure 1
Figure 1. Structure of the α1β3γ2L GABAAR in complex with picrotoxin (PTX).
a, Cryo-EM map of the PTX-bound α1β3γ2L GABAAR viewed from the extracellular space (left) and parallel to the membrane plane (right). PTX binding site is boxed. b, c, Side-on (b) and top-down views (c) of PTX (carbon atoms in pink, oxygen atoms in red) bound to the channel pore, with the amino acid side chains lining the site shown as sticks. Dashed lines indicate hydrogen bonds.
Figure 2
Figure 2. Conformational impact of GABA binding to the α1β3γ2L GABAAR.
a, Cryo-EM map of the PTX/GABA-bound α1β3γ2L receptor viewed from the extracellular space (left) and parallel to the membrane plane (right). b, One GABA (balls and sticks; carbon atoms, khaki; oxygens, red; nitrogen, blue) binding pocket viewed from the extracellular space. c, Plot of the pore radii for the receptor bound to PTX and PTX/GABA. d, Superimposition of ECDs from the PTX- (grey) and PTX/GABA-bound receptor structures based on the global TMD alignment. Subunits were radially translated away by 10 Å from the pore axis to allow better visualisation of conformational changes in the ECD upon GABA binding. GABA-induced ECD rotation is defined as angles of rotation around the ECD rotation axes and the direction of motion are shown. e, f, Superimposition of α1 ECDs from PTX-bound and PTX/GABA-bound structures reveals conformational changes induced by GABA binding in the orthosteric pockets at β3-B+/α1-A (e) and β3-E+/α1-D interfaces (f). Dashed lines indicate hydrogen bonds, π-π stacking, π-cation interactions and salt bridges.
Figure 3
Figure 3. Structure of a α1β3γ2L GABAAR closed by the competitive antagonist bicuculline.
a-c, Representative whole-cell current traces elicited from the same cell (n = 4) by a 42s pulse of: Mb38 alone (a); Mb38 plus bicuculline (BCC) co-applied for 13s at 25s mark (b); Mb38 again, after BCC was washed out (c). d, Cryo-EM map of the α1β3γ2 GABAAR-BCC complex viewed parallel to the membrane plane. e, One BCC binding pocket at the β3+/α1 interface, viewed parallel to the membrane. Dashed lines indicate π-π interactions and hydrogen bonds. f, Plot of the pore radii for the α1β3γ2 receptor bound to PTX or BCC.
Figure 4
Figure 4. Structures of a α1β3γ2L GABAAR in desensitised states induced by GABA and alprazolam/diazepam.
a, Structural formulae of diazepam and alprazolam. Diazepine ring atoms are numbered. Imidazole (I) and benzene rings (A) are labelled. b,c, The cryo-EM map of the α1β3γ2 GABAAR in complex with ALP (cyan) (b) and DZP (teal) (c) viewed parallel to the membrane plane. d,e, Views of the benzodiazepine binding site at the α1+/γ2 interface showing ALP (d) and DZP (e) binding modes. Dashed lines indicate π-π interactions and hydrogen bonds. f, The low affinity DZP binding site in the β3+/α1 interface TMD region. g, Plot of the pore radii for the receptor bound to PTX, ALP/GABA and DZP/GABA. h, Representative current traces evoked by co-application of GABA (10 mM) with Mb38 (2 μM) and DZP (100 μM) for 40s to outside-out patches pulled from HEK cells. The currents (n = 6 patches) desensitized completely in three phases; a slow (0.78± 0.84 s-1); medium (16.32 ± 9.34 s-1), and a fast (306.5± 185.9 s-1) rates. Rate values are mean ± S.D. The upper black solid bar shows the duration of ligand application.
Figure 5
Figure 5. Conformational differences between closed-resting and desensitised states in a GABAA receptor.
a, Superimposition of ECDs from PTX (grey) and ALP/GABA structures based on the global TMD alignment. Subunits were radially translated by 10 Å away from the pore axis to allow better visualisation of conformational changes in the ECD upon GABA and ALP binding. GABA- and ALP-induced ECD rotation angles, around the rotational ECD axes, and the direction of motion are shown. b, Global TMD alignment for the PTX- (grey) and ALP/GABA-bound (coloured) structures. 9' Leu side chains are shown as sticks. c, Schematic illustration of conformational changes initiated by GABA binding at the extracellular domain (ECD) level. GABA stabilizes closure of loop-C in each β subunit, causing ECDs to rotate and form stronger β3+/α1 interfaces. The direction and magnitude of rotation are depicted as black arrows of varying thickness. BZDs such as alprazolam bind at the α1+/γ2 interface and reinforce it, facilitating the concerted rotation of the ECDs. Black bars (“stitches”) at the subunit interfaces represent the strength of the interfaces (See Extended Data Table 2.). d, Differences in the ECD-TMD relative orientations between the closed/resting and desensitised states illustrate how GABA binding and ECD rotation impact on transmembrane domains (TMDs). Notably, the M2-M3 loops in β subunits deform more than α and γ equivalents, resulting in lower degrees of M2 tilt and TMD rotation.

Comment in

References

    1. Sieghart W. Structure and pharmacology of gamma-aminobutyric acid A receptor subtypes. Pharmacol Rev. 1995;47:181–234. - PubMed
    1. Barnard EA, et al. International Union of Pharmacology. XV. Subtypes of gamma-aminobutyric acid A receptors: classification on the basis of subunit structure and receptor function. Pharmacol Rev. 1998;50:291–313. - PubMed
    1. Sigel E, Steinmann ME. Structure, function, and modulation of GABAA receptors. J Biol Chem. 2012;287:40224–31. - PMC - PubMed
    1. Möhler H. GABAA receptors in central nervous system disease: anxiety, epilepsy and insomnia. J Recept Signal Transduct. 2006;26:731–740. - PubMed
    1. Olsen RW. Analysis of γ-aminobutyric acid (GABA) type A receptor subtypes using isosteric and allosteric ligands. Neurochem Res. 2014;39:1924–1941. - PubMed

Publication types

MeSH terms